Avamere Rehabilitation of Burien
Nursing Home, Assisted Living & Respite Care · Burien, WA
CMS overall rating Info The Overall CMS Rating is scored from 1 to 5 stars and combines results from health inspections, staffing levels, and quality measures. Health inspections carry the most weight. Staffing and quality scores can increase or decrease the final rating based on performance compared to state and national standards.

Avamere Rehabilitation of Burien

Nursing Home, Assisted Living & Respite Care · Burien, WA
CMS overall rating Info The Overall CMS Rating is scored from 1 to 5 stars and combines results from health inspections, staffing levels, and quality measures. Health inspections carry the most weight. Staffing and quality scores can increase or decrease the final rating based on performance compared to state and national standards.
Calculator: See prices in your area
Avamere Rehabilitation of Burien accepts Medicare, Medicaid, and private pay.

Overview of Avamere Rehabilitation of Burien

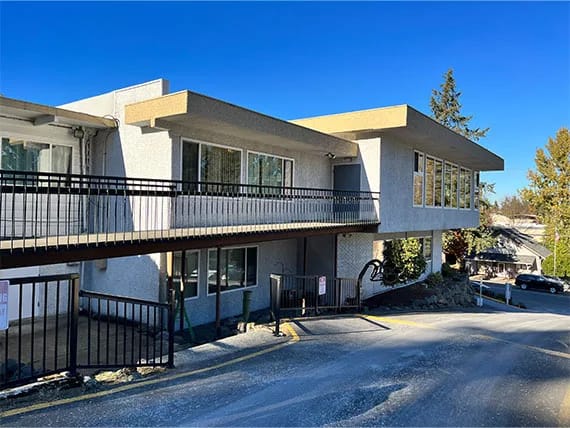
Avamere Rehabilitation of Burien is a premier care facility in Burien, Washington. Their mission is to provide exceptional care and enhance the quality of life for all individuals they serve. With services from skilled nursing to long-term care services, Avamere is ready to help out the best way they know how- with compassion and expertise.
They specialize in rehabilitation and offer physical, occupational, and speech therapy. They understand that healing may take a while, but they will go above and beyond to give their patients the care and support they need. Their healthcare professionals are available 24 hours a day, seven days a week, assuring the families of Burien that their loved ones are in reliable hands.

(206) 242-3213

Quality ratings

Measured by Centers for Medicare & Medicaid Services (CMS)

Overall rating Info The Overall CMS Rating combines results from health inspections, staffing levels and quality measures. Health inspections carry the most weight. Staffing and quality scores can increase or decrease the final rating based on performance compared to state and national standards.
▼ 7.0% Below WA avg. ▼ 7.0% Below WA avg.Click the badge to see the full State ranking.Click here to see the full State ranking.
Health Inspection Info Based on the results of the facility's three most recent standard inspections and any complaint investigations. CMS reviews the number, scope, and severity of deficiencies, with more recent findings weighted more heavily.
▼ 29.0% Below WA avg. ▼ 29.0% Below WA avg.Click the badge to see the full State ranking.Click here to see the full State ranking.
Staffing Info Measures average nursing staff hours per resident per day, including Registered Nurses (RNs) and total nursing staff. Ratings are adjusted based on the level of care residents require and are compared to state and national benchmarks.
▲ 46.1% Above WA avg. ▲ 46.1% Above WA avg.Click the badge to see the full State ranking.Click here to see the full State ranking.
Quality Measures Info Based on clinical and physical health indicators reported to CMS, such as hospital readmissions, falls, pressure ulcers, and improvements in mobility. These measures reflect how well residents' health needs are being managed.
▲ 1.7% Above WA avg. ▲ 1.7% Above WA avg.Click the badge to see the full State ranking.Click here to see the full State ranking.

Staffing hours breakdown

Info Daily nursing hours per resident by staff type, reported to CMS. Higher is generally better — compare this facility to state and national averages to see where staffing stands.

Hours per resident per day — compared to Washington state averages

Total nursing care / resident Info This home is ranked 7th out of 89 homes in Washington. Total adjusted nursing hours per resident per day, combining RN, LPN, and aide time. CMS adjusts this for case-mix so facilities can be fairly compared.
4h 51m per day
Rank #7 / 89Nurse hours — State benchmarkedThis home is ranked 7th out of 89 homes in Washington. Shows adjusted nurse hours per resident per day benchmarked to the Washington average, with a ranking across 89 Washington SNFs. More hours mean more direct care. The national average is about 3.5 hrs; below 3.0 is a red flag.Click the rank badge to see the full State ranking.Click here to see the full State ranking.
This facility Washington avg (4h 13m per day)
vs Washington avg
+15%

3 of 6 metrics below state avg

Standout metric LPN / LVN is +14% above state avg
Staff typeHours / Day / Residentvs state avg
Registered Nurse (RN) Info RNs hold the highest nursing license and can assess residents, interpret test results, and direct care plans. More RN hours per day often signals stronger clinical oversight and faster response to health changes. 43m per day ▼ 19% State avg: 53m per day · National avg: 41m per day
LPN / LVN Info Licensed Practical Nurses (LPNs) or Licensed Vocational Nurses (LVNs) deliver routine hands-on care — medication administration, wound dressing, and monitoring vital signs. They work under RN supervision and make up a large share of daily bedside care. 56m per day ▲ 14% State avg: 49m per day · National avg: 52m per day
Nurse Aide Info Certified Nurse Aides (CNAs) provide the most direct day-to-day assistance: bathing, dressing, feeding, and mobility. Nurse aide hours are typically the largest staffing category and directly affect residents' quality of life. 2h 31m per day ▼ 6% State avg: 2h 41m per day · National avg: 2h 21m per day
Total Nursing (Weekend) Info Combined nursing hours (RN + LPN + Nurse Aide) per resident per day on weekends. Staffing often drops on weekends — this figure reveals whether the facility maintains adequate coverage outside of weekday hours. 4h 4m per day ▲ 8% State avg: 3h 47m per day · National avg: 3h 26m per day
Physical Therapist Info Hours per resident per day provided by licensed Physical Therapists (PTs) or PT Assistants. PT services help residents recover mobility after injury or illness and are especially important for post-acute (short-stay) rehabilitation. 2m per day ▼ 60% State avg: 5m per day · National avg: 4m per day
RN (Weekend) Info Registered nurse hours specifically on weekends. Facilities sometimes reduce RN presence on Saturdays and Sundays — a low weekend RN figure compared to weekday hours can indicate reduced clinical oversight when most administrative staff are absent. 42m per day ▲ 11% State avg: 38m per day · National avg: 29m per day

Types of Care at Avamere Rehabilitation of Burien

Assisted Living Nursing Home Respite Care

Capacity and availability

This home usually has availability

Occupancy lower than 85% suggests more openings may be available.

Lower occupancy than the Washington average: 72.5%
Occupancy rate 64.8% Rank #69 / 94Occupancy rate — State benchmarkedThis home is ranked 69th out of 94 homes in Washington. Shows this facility's occupancy rate versus the Washington average, with its Statewide rank out of 94. Higher occupancy signals strong local demand and financial stability.Click the rank badge to see the full State ranking.Click here to see the full State ranking.
Avg. Length of Stay 93 days
Occupancy rate
64.8% Rank #69 / 94Occupancy rate — State benchmarkedThis home is ranked 69th out of 94 homes in Washington. Shows this facility's occupancy rate versus the Washington average, with its Statewide rank out of 94. Higher occupancy signals strong local demand and financial stability.Click the rank badge to see the full State ranking.Click here to see the full State ranking.
Avg. Length of Stay
93 days
Walk Score
Walk Score: 61 / 100 Rank #34 / 95Walk Score — State benchmarkedThis home is ranked 34th out of 95 homes in Washington. Shows how walkable this facility's neighborhood is compared to the average Walk Score across Washington SNFs. Higher scores benefit residents, families, and staff.Click the rank badge to see the full State ranking.Click here to see the full State ranking.
Moderately walkable. Some errands can be accomplished on foot, with a mix of nearby amenities.

Contact Avamere Rehabilitation of Burien

Staffing Data

Reporting period: October 1 – December 31, 2025 (Q4 2025). Source: CMS Payroll-Based Journal report.

Total staff 108
Employees 105
Contractors 3
Staff to resident ratio 1.37:1
26% worse than Washington average
Washington average ratio: 1.85:1 Washington average ratio: 1.85:1See full Washington ranking
Avg staff/day 51
Average shift 7.8 hours
0% compared with Washington average
Washington average: 8.1 hours Washington average shift: 8.1 hoursSee full Washington ranking
Total staff hours (quarter) 36,625

Nursing staff breakdown

Q4 2025 · Oct 1 – Dec 31 More info This data comes from the CMS Payroll-Based Journal report covering October 1 – December 31, 2025.
Registered Nurse

Manages medical care and health needs.

Total count 14
Average shift length Info Average shift length. Calculated as total hours divided by days worked and average staff per day. 9.1 hours

No contractors work on this role.

Licensed Practical Nurse

Assists with medical care and medications.

Total count 15
Average shift length Info Average shift length. Calculated as total hours divided by days worked and average staff per day. 8 hours

No contractors work on this role.

Certified Nursing Assistant

Helps with daily care and mobility.

Total count 48
Average shift length Info Average shift length. Calculated as total hours divided by days worked and average staff per day. 7.6 hours

No contractors work on this role.

Contractor staffing

Q4 2025 · Oct 1 – Dec 31 More info This data comes from the CMS Payroll-Based Journal report covering October 1 – December 31, 2025.

Total hours from contractors

0.3%

92 contractor hours this quarter

Occupational Therapy Assistant: 2 Medical Director: 1

Staff by category

Q4 2025 · Oct 1 – Dec 31 More info This data comes from the CMS Payroll-Based Journal report covering October 1 – December 31, 2025.
Certified Nursing Assistant4804819,02692100%7.6
Licensed Practical Nurse150156,40592100%8
Registered Nurse140145,10392100%9.1
Speech Language Pathologist6069547379%7
Other Dietary Services Staff2028458087%7.4
Physical Therapy Aide4045466975%7.1
Nurse Practitioner1014806470%7.5
Mental Health Service Worker1014806470%7.5
Dental Services Staff1014506065%7.5
Dietitian1014446470%6.9
Administrator1014435964%7.5
Clinical Nurse Specialist2023834246%7.5
Physical Therapy Assistant2023484751%7.4
Respiratory Therapy Technician5052824246%5.7
Occupational Therapy Aide1011973942%5.1
Qualified Social Worker1011492527%6
Medical Director011481213%4
Occupational Therapy Assistant0224467%7.3
48 Certified Nursing Assistant
% of Days 100%
15 Licensed Practical Nurse
% of Days 100%
14 Registered Nurse
% of Days 100%
6 Speech Language Pathologist
% of Days 79%
2 Other Dietary Services Staff
% of Days 87%
4 Physical Therapy Aide
% of Days 75%
1 Nurse Practitioner
% of Days 70%
1 Mental Health Service Worker
% of Days 70%
1 Dental Services Staff
% of Days 65%
1 Dietitian
% of Days 70%
1 Administrator
% of Days 64%
2 Clinical Nurse Specialist
% of Days 46%
2 Physical Therapy Assistant
% of Days 51%
5 Respiratory Therapy Technician
% of Days 46%
1 Occupational Therapy Aide
% of Days 42%
1 Qualified Social Worker
% of Days 27%
1 Medical Director
% of Days 13%
2 Occupational Therapy Assistant
% of Days 7%

Penalties and fines

Includes penalties issued in 2024

Federal penalties imposed by CMS for regulatory violations, including civil money penalties (fines) and denials of payment for new Medicare/Medicaid admissions.

Source: CMS Penalties Database (Data as of Jan 2026)

Total fines amount $59K Rank #54 / 91Federal fines — State benchmarkedThis home is ranked 54th out of 91 homes in Washington. Shows this facility's cumulative CMS federal fine dollars versus the Washington average among facilities with fines, and where it ranks among 91 skilled nursing facilities in the pool. Lower total dollars mean a better rank.Click the rank badge to see the full State ranking.Click here to see the full State ranking.
27% lower than Washington average

Washington average: $82K

Number of fines 1
46% fewer fines than Washington average

Washington average: 1.8

Payment Denials Info Serious action where Medicare and/or Medicaid temporarily stops payments for new residents until issues are fixed. 0
100% fewer payment denials than Washington average

Washington average: 0.3

Fines amount comparison
This facility $59K
Washington average $82K
Penalty History

Penalties are imposed by CMS for violations of federal nursing home regulations.

1 penalty in the past 3 years

Feb 28, 2024 · $59K

Civil Money Penalty Info Fines imposed for noncompliance, which can be assessed per day or per instance of violation. Feb 28, 2024
$59K

Last updated: Jan 2026

Quality of care over time

These measures show how residents usually do over time at this home, based on health outcomes and preventive care.

High-risk clinical events score Info A composite score based on pressure ulcers, falls with injury, weight loss, walking ability decline, and activities of daily living decline. 12.4
24% worse than Washington average

Washington average: 10.0

Functional decline score Info A composite score based on activities of daily living decline, walking ability decline, and incontinence. 22.7
9% worse than Washington average

Washington average: 20.9

Long-stay resident measures
Average Washington avg: 3.6 Info CMS star rating based on long-stay quality measure performance. 5 stars = significantly above average, 1 star = significantly below average.
Need for Help with Daily Activities Increased Info Percent of long-stay residents whose need for help with daily activities has increased 16.0%
In line with Washington average

Washington average: 16.4%

Walking Ability Worsened Info Percent of long-stay residents whose ability to move independently worsened 24.9%
14% worse than Washington average

Washington average: 21.8%

Low Risk Residents with Bowel/Bladder Incontinence Info Percent of low risk long-stay residents who lose control of their bowels or bladder 27.2%
12% worse than Washington average

Washington average: 24.3%

Falls with Major Injury Info Percent of long-stay residents experiencing one or more falls with major injury 1.7%
34% better than Washington average

Washington average: 2.6%

High Risk Residents with Pressure Ulcers Info Percent of long-stay high risk residents with pressure ulcers 6.7%
35% worse than Washington average

Washington average: 4.9%

Urinary Tract Infection Info Percent of long-stay residents with a urinary tract infection 1.8%
In line with Washington average

Washington average: 1.7%

Lost Too Much Weight Info Percent of long-stay residents who lose too much weight 13.0%
124% worse than Washington average

Washington average: 5.8%

Depressive Symptoms Info Percent of long-stay residents who have depressive symptoms 1.6%
90% better than Washington average

Washington average: 16.2%

Antipsychotic Use Info Percent of long-stay residents who received an antipsychotic medication 4.2%
71% better than Washington average

Washington average: 14.5%

Pneumococcal Vaccine Info Percent of long-stay residents assessed and appropriately given the pneumococcal vaccine 98.6%
In line with Washington average

Washington average: 96.2%

Influenza Vaccine Info Percent of long-stay residents assessed and appropriately given the seasonal influenza vaccine 98.8%
5% better than Washington average

Washington average: 93.8%

Hospitalizations per 1,000 days Info Number of hospitalizations per 1,000 long-stay resident days. 2.11
53% worse than Washington average

Washington average: 1.38

ED visits per 1,000 days Info Number of outpatient emergency department visits per 1,000 long-stay resident days. 1.14
25% better than Washington average

Washington average: 1.51

Short-stay resident measures
Average Washington avg: 3.6 Info CMS star rating based on short-stay quality measure performance. 5 stars = much above average, 1 star = much below average.
Pneumococcal Vaccine Info Percent of short-stay residents assessed and appropriately given the pneumococcal vaccine 91.7%
In line with Washington average

Washington average: 88.1%

Antipsychotic medication increase Info Percent of short-stay residents who newly received an antipsychotic medication 1.1%
22% better than Washington average

Washington average: 1.4%

Influenza Vaccine Info Percent of short-stay residents assessed and appropriately given the seasonal influenza vaccine 91.4%
11% better than Washington average

Washington average: 82.0%

Re-hospitalized after SNF stay Info Percentage of short-stay residents who were re-hospitalized after their nursing home admission. 26.4%
33% worse than Washington average

Washington average: 19.9%

Emergency department visits Info Percentage of short-stay residents who had an outpatient emergency department visit. 9.4%
29% better than Washington average

Washington average: 13.2%

Falls with major injury Info Percentage of SNF residents who experience falls with major injury during their stay. 0.0%
100% better than Washington average

Washington average: 0.8%

Ability to care for self at discharge Info Percentage of residents at or above expected ability to care for themselves at discharge. 44.2%
18% worse than Washington average

Washington average: 53.7%

Successful return to home or community Info Rate of successful return to home or community from a skilled nursing facility. 58.1%
15% better than Washington average

Washington average: 50.6%

Breakdown by payment type

Medicare

32% of new residents, usually for short-term rehab.

Typical stay 25 days

Private pay

58% of new residents, often for short stays.

Typical stay 4 - 5 months

Medicaid

10% of new residents, often for long-term daily care.

Typical stay 2 - 3 months

Facility Characteristics

Source: CMS Long-Term Care Facility Characteristics (Data as of Jan 2026)

Total residents 79
Medicare
6
7.6% of residents
Medicaid
43
54.4% of residents
Private pay or other
30
38% of residents
Programs & Services
Residents Group

Residents meet regularly to discuss policies, care quality, and activities

Active Resident Council

Organized group of residents that meets regularly to discuss facility policies, quality of life, and activities.

Finances and operations

Privately-owned community
Operated by a business corporation.
Home revenue
$13.1M
Operating loss
-$21.4K
Privately-owned community Operated by a business corporation.
Home revenue
$13.1M Rank #53 / 93Revenue — State benchmarkedThis home is ranked 53rd out of 93 homes in Washington. Shows this facility's annual revenue compared to the Washington SNF average. Higher revenue generally means more resources for staffing and capital — read alongside Payroll %.Click the rank badge to see the full State ranking.Click here to see the full State ranking.
Operating loss
-$21.4K
Payroll costs Info The portion of the home's budget spent on staff, including nurses, caregivers, and other employees who support care and operations. Rank #36 / 93Payroll — State benchmarkedThis home is ranked 36th out of 93 homes in Washington. Shows total annual staff payroll benchmarked to the Washington average. Higher payroll investment relative to peers often signals better staffing and less reliance on cheaper contract labor.Click the rank badge to see the full State ranking.Click here to see the full State ranking.
$7.7M
58.8% of revenue Rank #17 / 93Payroll % — State benchmarkedThis home is ranked 17th out of 93 homes in Washington. Shows payroll as a percentage of revenue versus the Washington average. Well-run Washington SNFs typically land around 53–61% — the top third Statewide. Below 25% may signal understaffing or heavy agency use — read with Staffing ratings.Click the rank badge to see the full State ranking.Click here to see the full State ranking.
Other operating costs Info All remaining costs needed to run the home, such as food, utilities, building maintenance, supplies and administrative expenses.
$5.4M
Total costs $13.2M

Who this home usually serves

TYPE OF STAY

Mix of rehab and long-term care

This home supports both short-term rehab and long-term care, with residents staying for a wide range of durations.

Places of interest near Avamere Rehabilitation of Burien

Address 1.8 miles from city center Info Estimated distance in miles from Burien's city center to Avamere Rehabilitation of Burien's address, calculated via Google Maps. — 5.59 miles to nearest hospital (VA Puget Sound Health Care System)

Calculate Travel Distance to Avamere Rehabilitation of Burien

Add your location

Address

Financial Assistance for
Nursing Home in Washington

Avamere Rehabilitation of Burien is located in Burien, Washington.
Here are the financial assistance programs available to residents in Washington.

Get Financial aid guidance

Community Options Program Entry System (COPES)

WA Medicaid COPES

Age 65+ or disabled
General Washington resident, Medicaid-eligible, nursing home-level care need.
Income Limits (2025) ~$2,829/month 300% FBR, individual
Asset Limits $2,000 (individual), $3,000 (couple).
WA

High demand in urban areas (e.g., Seattle).

Benefits
Personal care (5-7 hours/day) Respite (240 hours/year) Adult day care ($70/day) Home modifications ($1,500 avg.)

Washington Family Caregiver Support Program

WA NFCSP

Age Caregiver of someone 60+ (or with dementia)
General Washington resident.
Income Limits No strict limit; prioritizes low-income.
Asset Limits Not applicable.
WA

High urban demand; rural outreach.

Benefits
In-home respite (4-6 hours/day) Adult day care (~$70/day) Short-term facility care (up to 5 days)

Community First Choice (CFC)

Washington Community First Choice

Age 65+ (or disabled 18+)
General WA resident, Medicaid-eligible, need help with 2+ ADLs/IADLs.
Income Limits (2025) ~$2,829/month; QIT optional.
Asset Limits $2,000 (individual), $3,000 (couple).
WA

Broader than COPES; serves ~20,000; self-directed option.

Benefits
Personal care (4-6 hours/day) Respite (~240 hours/year) Assistive devices Training Transportation

Older Americans Act (OAA) Services

Washington OAA Services

Age 60+
General WA resident; no income/asset limits.
Income Limits (2025) None; donations encouraged.
Asset Limits Not assessed.
WA

13 AAAs; includes Meals on Wheels; rural focus.

Benefits
Meals (~$5-$7/meal) Transportation Homemaker services (~4 hours/week) Respite (~5 days/year) Legal aid

Medicare Savings Program (MSP)

Washington Medicare Savings Program

Age 65+ or disabled
General WA resident, Medicare Part A/B.
Income Limits (2025) ~$2,510/month (QMB), ~$3,380/month (SLMB), ~$3,598/month (QI)—individual.
Asset Limits $9,430 (individual), $14,130 (couple).
WA

Includes Extra Help for Part D; no waitlist.

Benefits
Covers Part B premiums ($174.70/month) Deductibles ($240/year) Copays (~20%)

VA Aid and Attendance (A&A) and Housebound Benefits

Washington VA Aid and Attendance/Housebound

Age 65+ or disabled veteran/spouse
General WA resident, wartime service, ADL help (A&A) or homebound.
Income Limits (2025) Net income < ~$1,984/month (veteran with dependent, A&A); pension offsets income.
Asset Limits ~$155,356 net worth
WA

High veteran use; supports rural/urban needs.

Benefits
Cash (~$1,433-$2,642/month veteran, ~$951-$1,318 spouse) for care costs

Senior Citizens Property Tax Exemption

Washington Senior Property Tax Exemption

Age 61+ or disabled retiree
General WA resident, homeowner, income-based.
Income Limits (2025) ~$45,000-$70,000/year varies by county, e.g., King: $70,000
Asset Limits Not assessed; home value cap varies ~$250,000-$400,000
WA

Saves ~$500-$1,500/year; offered statewide.

Benefits
Tax exemption (~$500-$1,500/year depending on county)

Senior Farmers’ Market Nutrition Program (SFMNP)

Washington SFMNP

Age 60+
General WA resident, low-income.
Income Limits (2025) ~$2,322/month 185% FPL
Asset Limits Not assessed.
WA

Vouchers (~$80/season); serves ~20,000 via AAAs.

Benefits
Vouchers (~$80/season) for produce at farmers’ markets

Frequently Asked Questions about Avamere Rehabilitation of Burien

What neighborhood is Avamere Rehabilitation of Burien in?

Avamere Rehabilitation of Burien is in the Evansville neighborhood.

Is Avamere Rehabilitation of Burien in a walkable area?

Avamere Rehabilitation of Burien has a walk score of 61. Moderately walkable. Some errands can be accomplished on foot, with a mix of nearby amenities.

What is the occupancy rate at Avamere Rehabilitation of Burien?

Avamere Rehabilitation of Burien's occupancy is 64.8%.

What is the phone number of Avamere Rehabilitation of Burien?

(206) 242-3213 will put you in contact with the team at Avamere Rehabilitation of Burien.

Is Avamere Rehabilitation of Burien Medicare or Medicaid certified?

Yes — Avamere Rehabilitation of Burien is a CMS-certified provider of Medicare and Medicaid.

Guides for Better Senior Living

Care Cost Calculator: See Prices in Your Area

Nursing Home Data Explorer

Don’t Wait Too Long: 7 Red Flag Signs Your Parent Needs Assisted Living Now

The True Cost of Assisted Living in 2025 – And How Families Are Paying For It

Understanding Senior Living Costs: Pricing Models, Discounts & Financial Assistance

Explore Open Rooms
1 Contact details
2 What type of senior care service are you looking for?
3 What budget do you have in mind for senior care?
4 How soon do you need to find care?
5 Additional details

Thank you for your interest!

Our team will be in touch shortly to help with next steps.