Yellowstone River Nursing and Rehabilitation

Nursing Home in Billings

CMS overall rating Info The Overall CMS Rating combines results from health inspections, staffing levels and quality measures. Health inspections carry the most weight. Staffing and quality scores can increase or decrease the final rating based on performance compared to state and national standards.

Overview of Yellowstone River Nursing and Rehabilitation

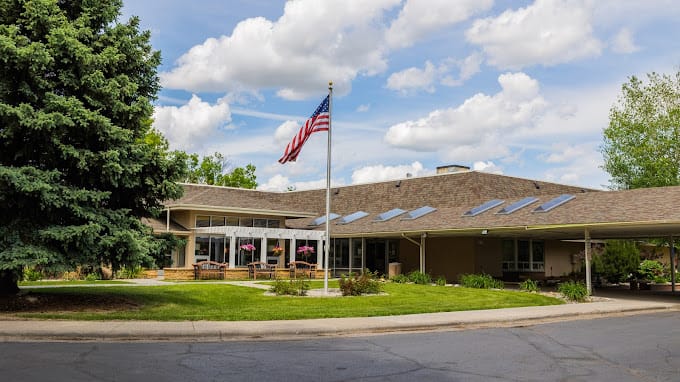
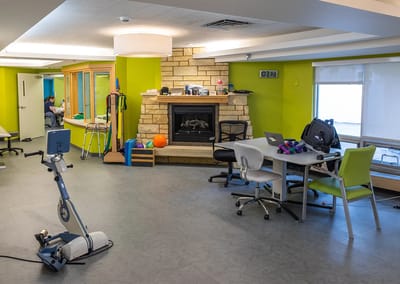
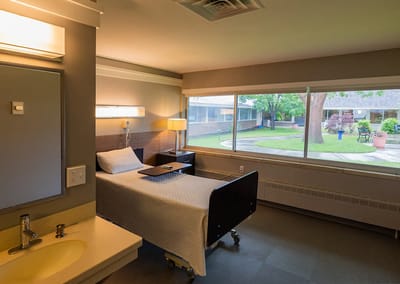
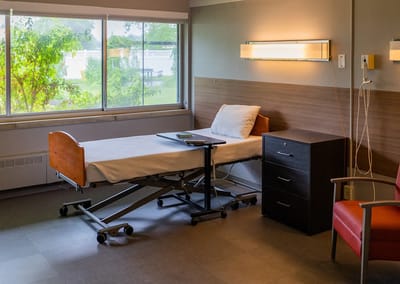
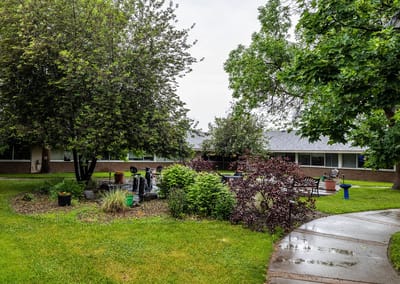
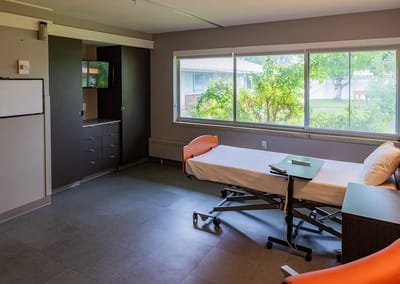
Yellowstone River Nursing & Rehabilitation is a senior living community located in Billings, Montana, offering 24/7 skilled care, including long term care, short-term care and various rehab therapies. They provide a range of services to enhance the quality of life for their residents, emphasizing individual wellness and recovery. Seniors at Yellowstone River can enjoy personalized care in a supportive environment designed to meet their specific needs.

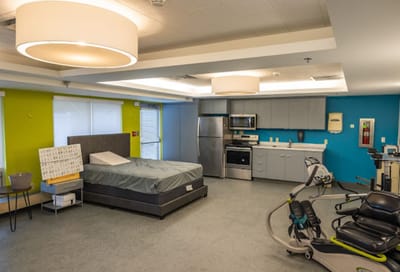
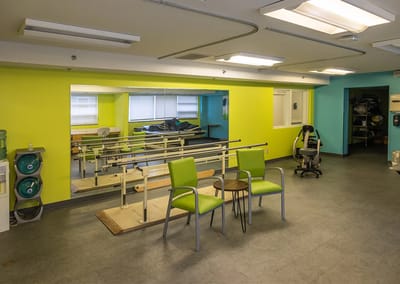
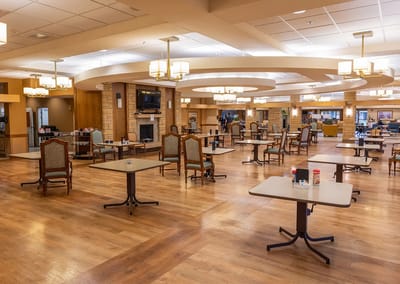
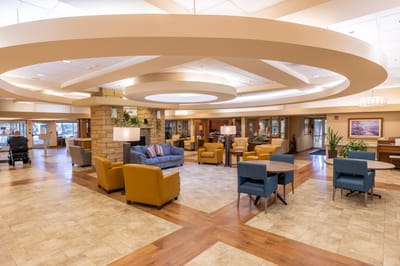
Yellowstone River Nursing & Rehabilitation aims to offer comprehensive and compassionate care to their residents. They provide various amenities and programs, including skilled nursing for pain management, medication, and hygiene, as well as rehabilitation therapy with physical, occupational, and speech therapists. Their goal is to help residents regain independence and improve their overall well-being, whether they require long or short-term care.

(406) 656-6500

Managed by Joe Lilienthal

Administrator

Joe Lilienthal serves as the Administrator at Yellowstone River Nursing and Rehabilitation. He leads the community in providing skilled nursing, short-term rehabilitation, and long-term care services in a compassionate and comfortable environment. Joe and his team focus on customizing care and therapy plans to meet the individual needs of each resident, fostering a family-like atmosphere surrounded by healing views.

Quality ratings

Measured by Centers for Medicare & Medicaid Services (CMS)

Overall rating Info The Overall CMS Rating combines results from health inspections, staffing levels and quality measures. Health inspections carry the most weight. Staffing and quality scores can increase or decrease the final rating based on performance compared to state and national standards.
1/5 ▼ 1.8 Montana average: 2.8/5
Health Inspection Info Based on the results of the facility's three most recent standard inspections and any complaint investigations. CMS reviews the number, scope, and severity of deficiencies, with more recent findings weighted more heavily.
1/5 ▼ 1.6 Montana average: 2.6/5
Staffing Info Measures average nursing staff hours per resident per day, including Registered Nurses (RNs) and total nursing staff. Ratings are adjusted based on the level of care residents require and are compared to state and national benchmarks.
2/5 ▼ 0.9 Montana average: 2.9/5
Quality Measures Info Based on clinical and physical health indicators reported to CMS, such as hospital readmissions, falls, pressure ulcers, and improvements in mobility. These measures reflect how well residents' health needs are being managed.
2/5 ▼ 1.0 Montana average: 3.0/5

Staffing hours breakdown

Info Daily nursing hours per resident by staff type, reported to CMS. Higher is generally better — compare this facility to state and national averages to see where staffing stands.

Hours per resident per day — compared to Montana state averages

Total nursing care / resident Info This home is ranked 13th out of 27 homes in Montana.

Total adjusted nursing hours per resident per day, combining RN, LPN, and aide time. CMS adjusts this for case-mix so facilities can be fairly compared.
3h 34m per day
This facility Montana avg (3h 54m per day)
vs Montana avg
-9%

3 of 5 metrics below state avg

Standout metric Physical Therapist is +75% above state avg
Staff typeHours / dayvs state avg
Registered Nurse (RN) Info RNs hold the highest nursing license and can assess residents, interpret test results, and direct care plans. More RN hours per day often signals stronger clinical oversight and faster response to health changes. 43m per day ▼ 23% State avg: 56m per day · National avg: 41m per day
Nurse Aide Info Certified Nurse Aides (CNAs) provide the most direct day-to-day assistance: bathing, dressing, feeding, and mobility. Nurse aide hours are typically the largest staffing category and directly affect residents' quality of life. 2h 1m per day ▼ 20% State avg: 2h 32m per day · National avg: 2h 21m per day
Total Nursing (Weekend) Info Combined nursing hours (RN + LPN + Nurse Aide) per resident per day on weekends. Staffing often drops on weekends — this figure reveals whether the facility maintains adequate coverage outside of weekday hours. 2h 57m per day ▼ 15% State avg: 3h 29m per day · National avg: 3h 26m per day
Physical Therapist Info Hours per resident per day provided by licensed Physical Therapists (PTs) or PT Assistants. PT services help residents recover mobility after injury or illness and are especially important for post-acute (short-stay) rehabilitation. 7m per day ▲ 75% State avg: 4m per day · National avg: 4m per day
RN (Weekend) Info Registered nurse hours specifically on weekends. Facilities sometimes reduce RN presence on Saturdays and Sundays — a low weekend RN figure compared to weekday hours can indicate reduced clinical oversight when most administrative staff are absent. 42m per day ■ Avg State avg: 41m per day · National avg: 29m per day

Capacity and availability

This home usually has availability

Lower occupancy suggests more openings may be available.

Lower demand than the Montana average: 61.7%
Occupancy rate 65.6%
Avg. Length of Stay 102 days
Occupancy rate
65.6%
Avg. Length of Stay
102 days

Who this home usually serves

TYPE OF STAY

Mix of rehab and long-term care

This home supports both short-term rehab and long-term care, with residents staying for a wide range of durations.

Breakdown by payment type

Medicare

43% of new residents, usually for short-term rehab.

Typical stay 29 days

Private pay

49% of new residents, often for short stays.

Typical stay 1 - 2 months

Medicaid

8% of new residents, often for long-term daily care.

Typical stay 2 - 3 years

Finances and operations

Privately-owned community
Home revenue
$7.6M
Operating loss
-$7.7K
Privately-owned community
Home revenue
$7.6M
Operating loss
-$7.7K
Payroll costs Info The portion of the home's budget spent on staff, including nurses, caregivers, and other employees who support care and operations.
$3.5M
46.8% of revenue
Other operating costs Info All remaining costs needed to run the home, such as food, utilities, building maintenance, supplies and administrative expenses.
$4.0M
Total costs $7.6M
Years in operation
2 years in operation
A newer community that may feature more recent facilities and programs.
Walk Score
Walk Score: 67 / 100
Moderately walkable. Some errands can be accomplished on foot, with a mix of nearby amenities.

About this community

License Details

Facility TypeLong Term Care
StatusCurrent
IssuanceJanuary 6, 2024
ExpirationMay 31, 2027
License Number66

Ownership & Operating Entity

Yellowstone River Nursing and Rehabilitation is administrated by McGaha, Brenda.

Payment & Insurance

2 services
Accept Medicaid
Accept Medicare

Therapy & Rehabilitation

1 service
Rehabilitation Services

Staffing & Medical

2 services
Skilled Nursing
24-Hour Staffing

Additional Services

2 services
Rehabilitation Program
Long Term & Short Term Care

Amenities & Lifestyle

0 amenities
Specific ProgramsRehabilitation Program, Long Term & Short Term Care
Operating HoursMo 00:00-23:59, Tu 00:00-23:59, We 00:00-23:59, Th 00:00-23:59, Fr 00:00-23:59, Sa 00:00-23:59, Su 00:00-23:59

Pricing & Financial Information

What does this home offer?

Building type icon
Building type icon

Building Type: Single-story

Fitness and recreation icon

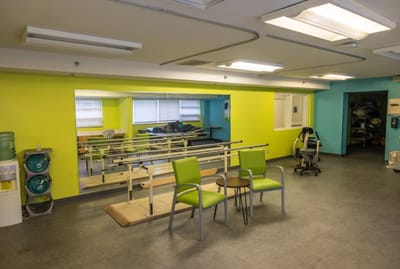
Fitness and Recreation

Types of Care at Yellowstone River Nursing and Rehabilitation

Skilled Nursing Assisted Living

Access & Eligibility

Ways to qualify for care at this community, including accepted programs and payment options.

Medicaid Accepted

This facility is certified for eligible Medicaid services.

Medicare Accepted

This facility is certified for eligible Medicare services.

Payment & Funding Options

Medicaid Medicare Long-term care insurance

Inspection History

In Montana, the Department of Public Health and Human Services, Quality Assurance Division is the state body responsible for inspecting and licensing all senior residential care facilities.

10 visits/inspections Info Inspections are mandatory, regular evaluations conducted by state health departments or regulatory agencies. They ensure the community provides safe, compliant care, covering areas like resident health, staff and management.

Latest inspection

Date December 31, 2025
Complaint Investigation

58 deficiencies

Deficiencies indicate regulatory issues. A higher number implies the facility had several areas requiring improvement.

Montana average: 21 deficiencies

Inspection Report Summary for Yellowstone River Nursing and Rehabilitation

The most recent inspection on December 31, 2025, identified a deficiency related to delayed staff response to a resident’s call light for assistance with activities of daily living. Earlier inspections showed a pattern of deficiencies involving resident care planning, behavioral health services, safety measures to prevent elopement, and issues with nutrition, medication management, and staff abuse. Complaint investigations included substantiated abuse by a staff member and concerns about resident dignity, timely notification, and environmental safety, while most complaints were addressed with staff discipline and training. Enforcement actions such as fines or license suspensions were not listed in the available reports. The facility’s inspection history shows ongoing challenges with resident care and safety, with some efforts to address issues but no clear overall improvement trend.

Health Inspection History

Inspections
Total health inspections 8

Montana average 5.1


Last Health inspection on Aug 2025

Total health citations 49

Montana average 29.7

Citations per inspection
6.12

Montana average 5.72


Health citations are formal notices following inspections when they fail to comply with safety and care standards.

24 of 49 citations resulted from standard inspections; 20 of 49 resulted from complaint investigations; and 5 of 49 came from combined inspections (standard and complaint).

Breakdown of citation severity (last 3 years)
Critical Health citations More info 1
233% worse than Montana average

Montana average: 0.3


Serious Health citations More info 4
82% worse than Montana average

Montana average: 2.2

1 critical citation More info Montana average: 0.3

4 serious citations More info Montana average: 2.2

44 moderate citations More info Montana average: 26.5

0 minor citations More info Montana average: 0.7
Citations history (last 3 years)
Nutrition moderate citation Info Issues related to food quality, meal service, and resident's nutritional needs. Aug 28, 2025
Corrected

Quality of Care moderate citation Info Issues related to how well residents receive appropriate treatment and support for their medical and daily care needs. Aug 28, 2025
Corrected

Quality of Care serious citation Info Issues related to how well residents receive appropriate treatment and support for their medical and daily care needs. Aug 28, 2025
Corrected

Quality of Care serious citation Info Issues related to how well residents receive appropriate treatment and support for their medical and daily care needs. Aug 28, 2025
Corrected

Compare Nursing Homes around Billings The information below is reported by the Montana Department of Public Health and Human Services, Quality Assurance Division.

4 facilities compared · CMS & MT Dept. of Health data · Updated Apr 2026

Filter by care type
Yellowstone River Nursing and Rehabilitation
AL

Assisted Living A licensed, long-term care setting for seniors or individuals with disabilities who need help with daily activities — like bathing, dressing, and medication management — but not 24-hour skilled nursing. Offers housing, meals, and around-the-clock support while aiming to maximize resident independence.

NH

Nursing Home Licensed facility providing 24/7 skilled nursing care for residents with complex, ongoing medical needs. Staffed by RNs, LPNs, and CNAs. Inspected and star-rated annually by CMS. Accepts Medicare (short-term rehab) and Medicaid (long-term care).

Billings (East Central)160 65.6% +6%3.57 +23%-21%3496.15105- 67 Caldwell, Sarah$7.6M$3.5M46.8%275029
Skyline Heights Nursing and Rehabilitation
NH

Nursing Home Licensed facility providing 24/7 skilled nursing care for residents with complex, ongoing medical needs. Staffed by RNs, LPNs, and CNAs. Inspected and star-rated annually by CMS. Accepts Medicare (short-term rehab) and Medicaid (long-term care).

Billings (Colton Heights Apartments)150 54.1% -12%2.99 +12%-34%5748.21171- 57 Preciado, Anna$6.3M$2.2M35.2%275020
Billings Nursing and Rehab -
HC

Home Care Professional care delivered in the person's own home — from companionship and errands to skilled nursing and therapy. Allows seniors to age in place. Medicare covers skilled home health when medically necessary.

MC

Memory Care Secured, specialized care for people living with Alzheimer's or dementia. Staff trained in cognitive impairment, with higher staff-to-resident ratios and an environment designed to reduce confusion and wandering risk.

NH

Nursing Home Licensed facility providing 24/7 skilled nursing care for residents with complex, ongoing medical needs. Staffed by RNs, LPNs, and CNAs. Inspected and star-rated annually by CMS. Accepts Medicare (short-term rehab) and Medicaid (long-term care).

Billings (South Side)100 70.6% +14%3.15----2%-30%4455.6380- 56 -$4.0M$1.2M29.6%275120
Bella Terra Billings -
NH

Nursing Home Licensed facility providing 24/7 skilled nursing care for residents with complex, ongoing medical needs. Staffed by RNs, LPNs, and CNAs. Inspected and star-rated annually by CMS. Accepts Medicare (short-term rehab) and Medicaid (long-term care).

AL

Assisted Living A licensed, long-term care setting for seniors or individuals with disabilities who need help with daily activities — like bathing, dressing, and medication management — but not 24-hour skilled nursing. Offers housing, meals, and around-the-clock support while aiming to maximize resident independence.

Billings (North Park)---------000.00-- 41 -----

Financial Assistance for
Nursing Home in Montana

Get Financial aid guidance

Big Sky Waiver

Montana Medicaid Big Sky Waiver

Age 65+ or disabled
General Montana resident, Medicaid- eligible, nursing home-level care need.
Income Limits (2025) ~$2,829/month 300% FBR, individual
Asset Limits $2,000 (individual), $3,000 (couple).
MT

Rural state; limited providers in some areas.

Benefits
Personal care (5-7 hours/day) Respite (240 hours/year) Home modifications ($1,500 avg.) Meals ($6/meal)

Montana Community First Choice

MT CFC

Age 65+ or disabled
General Montana resident, Medicaid- eligible.
Income Limits ~$1,732/month individual, Medicaid threshold
Asset Limits $2,000 individual
MT

Less intensive than waiver; rural focus.

Benefits
Personal care (up to 40 hours/month) Homemaker services Respite (varies)

Big Sky Rx

Montana Big Sky Rx

Age 65+ or disabled
General Montana resident, enrolled in Medicare Part D, income below limit.
Income Limits (2025) ~$2,510/month (individual), ~$3,380/month (couple).
Asset Limits Not assessed.
MT

Covers up to $38.75/month premium; statewide via AAAs.

Benefits
Prescription drug premium assistance (~$465/year) Reducing out-of-pocket costs

Medicare Savings Program (MSP)

Montana Medicare Savings Program

Age 65+ or disabled
General Montana resident, Medicare Part A/B.
Income Limits (2025) ~$2,510/month (QMB), ~$3,380/month (SLMB), ~$3,598/month (QI)—individual.
Asset Limits $9,430 (individual), $14,130 (couple).
MT

Three tiers; no waitlist; includes Extra Help for Part D.

Benefits
Covers Part B premiums ($174.70/month) Deductibles ($240/year) Copays (~20%)

Montana Caregiver Support Program (via NFCSP)

Montana Caregiver Support Program

Age
General Caregivers of 60+ needing care or 55+ caregivers of others; Montana resident; functional needs (2+ ADLs).
Income Limits (2025) Prioritizes ~$24,980/year (individual); no strict cap.
Asset Limits Not assessed; need-based.
MT

10 AAAs; prioritizes low-income, rural caregivers.

Benefits
Respite (4-6 hours/week or 5 days/year) Adult day care ($50/day) Training Supplies (~$500/year)

Senior Community Service Employment Program (SCSEP)

Montana SCSEP

Age 55+
General unemployed, low-income, Montana resident.
Income Limits (2025) ~$1,983/month 125% FPL
Asset Limits Not specified; income-focused.
MT

Priority for veterans, rural residents; AARP partnership.

Benefits
Paid training (~20 hours/week at ~$7.25/hour) Job placement

VA Aid and Attendance (A&A) and Housebound Benefits

Montana VA Aid and Attendance/Housebound

Age 65+ or disabled veteran/spouse
General Montana resident, wartime service, need for ADL help (A&A) or homebound.
Income Limits (2025) Net income < ~$1,984/month (veteran with dependent, A&A); pension offsets income.
Asset Limits ~$155,356 net worth limit
MT

High veteran demand in rural areas.

Benefits
Cash (~$1,433-$2,642/month veteran, ~$951-$1,318 spouse) for care costs (e.g., in-home, assisted living)

Places of interest near Yellowstone River Nursing and Rehabilitation

Address 4 miles from city center Info Estimated distance in miles from Billings's city center to Yellowstone River Nursing and Rehabilitation's address, calculated via Google Maps. — 0.45 miles to nearest hospital (St Vincent Healthcare)

Calculate Travel Distance to Yellowstone River Nursing and Rehabilitation

Add your location

Address

Staffing Data (Q2 2025)

This data corresponds to Q2 2025 and is based on CMS Payroll-Based Journal.

Total staff 189
Employees 96
Contractors 93
Staff to resident ratio 1.64:1
7% worse than Montana average

Montana average ratio: 1.77:1

Avg staff/day 48
Average shift 9.1 hours
6% better than Montana average

Montana average: 8.6 hours

Total staff hours (quarter) 39,745
Nursing staff breakdown
Registered Nurse

Manages medical care and health needs.

Total count 36
Average shift length Info Average shift length. Calculated as total hours divided by days worked and average staff per day. 9.8 hours

This role is partially covered by contractors.

Licensed Practical Nurse

Assists with medical care and medications.

Total count 19
Average shift length Info Average shift length. Calculated as total hours divided by days worked and average staff per day. 10.1 hours

This role is partially covered by contractors.

Certified Nursing Assistant

Helps with daily care and mobility.

Total count 104
Average shift length Info Average shift length. Calculated as total hours divided by days worked and average staff per day. 9.9 hours

This role is partially covered by contractors.

Contractor staffing

Total hours from contractors

27.7%

11,025 contractor hours this quarter

Certified Nursing Assistant: 58 Registered Nurse: 24 Licensed Practical Nurse: 9 Respiratory Therapy Technician: 1 Qualified Social Worker: 1
Staff by category
Certified Nursing Assistant465810418,64391100%9.9
Registered Nurse1224366,05891100%9.8
Licensed Practical Nurse109195,09691100%10.1
Physical Therapy Aide6061,8276571%6.8
Mental Health Service Worker3031,4086470%8
Other Dietary Services Staff7071,3598897%7.4
Respiratory Therapy Technician2131,3206571%7.8
Speech Language Pathologist3031,2406470%6.9
Qualified Social Worker2136515459%8.9
RN Director of Nursing1015046369%8
Clinical Nurse Specialist1014886167%8
Nurse Practitioner1014725965%8
Administrator1013604549%8
Medication Aide/Technician1013204044%8
104 Certified Nursing Assistant
% of Days 100%
36 Registered Nurse
% of Days 100%
19 Licensed Practical Nurse
% of Days 100%
6 Physical Therapy Aide
% of Days 71%
3 Mental Health Service Worker
% of Days 70%
7 Other Dietary Services Staff
% of Days 97%
3 Respiratory Therapy Technician
% of Days 71%
3 Speech Language Pathologist
% of Days 70%
3 Qualified Social Worker
% of Days 59%
1 RN Director of Nursing
% of Days 69%
1 Clinical Nurse Specialist
% of Days 67%
1 Nurse Practitioner
% of Days 65%
1 Administrator
% of Days 49%
1 Medication Aide/Technician
% of Days 44%

Facility Characteristics

Source: CMS Long-Term Care Facility Characteristics (Data as of Jan 2026)

Total residents 115
Medicare
18
15.7% of residents
Medicaid
90
78.3% of residents
Private pay or other
7
6.1% of residents
Programs & Services
Residents Group

Residents meet regularly to discuss policies, care quality, and activities

Active Resident Council

Organized group of residents that meets regularly to discuss facility policies, quality of life, and activities.

Quality of care over time

These measures show how residents usually do over time at this home, based on health outcomes and preventive care.

High-risk clinical events score Info A composite score based on pressure ulcers, falls with injury, weight loss, walking ability decline, and activities of daily living decline. 14.9
34% worse than Montana average

Montana average: 11.2

Functional decline score Info A composite score based on activities of daily living decline, walking ability decline, and incontinence. 29.4
35% worse than Montana average

Montana average: 21.8

Long-stay resident measures
Below average Montana avg: 2.8 Info CMS star rating based on long-stay quality measure performance. 5 stars = significantly above average, 1 star = significantly below average.
Need for Help with Daily Activities Increased Info Percent of long-stay residents whose need for help with daily activities has increased 30.1%
55% worse than Montana average

Montana average: 19.4%

Walking Ability Worsened Info Percent of long-stay residents whose ability to move independently worsened 29.6%
42% worse than Montana average

Montana average: 20.8%

Low Risk Residents with Bowel/Bladder Incontinence Info Percent of low risk long-stay residents who lose control of their bowels or bladder 28.6%
14% worse than Montana average

Montana average: 25.2%

Falls with Major Injury Info Percent of long-stay residents experiencing one or more falls with major injury 4.0%
7% better than Montana average

Montana average: 4.3%

High Risk Residents with Pressure Ulcers Info Percent of long-stay high risk residents with pressure ulcers 3.6%
42% better than Montana average

Montana average: 6.3%

Urinary Tract Infection Info Percent of long-stay residents with a urinary tract infection 1.2%
57% better than Montana average

Montana average: 2.8%

Lost Too Much Weight Info Percent of long-stay residents who lose too much weight 7.4%
21% worse than Montana average

Montana average: 6.1%

Depressive Symptoms Info Percent of long-stay residents who have depressive symptoms 3.0%
36% better than Montana average

Montana average: 4.7%

Antipsychotic Use Info Percent of long-stay residents who received an antipsychotic medication 31.8%
67% worse than Montana average

Montana average: 19.1%

Pneumococcal Vaccine Info Percent of long-stay residents assessed and appropriately given the pneumococcal vaccine 100.0%
7% better than Montana average

Montana average: 93.8%

Influenza Vaccine Info Percent of long-stay residents assessed and appropriately given the seasonal influenza vaccine 98.9%
6% better than Montana average

Montana average: 93.7%

Hospitalizations per 1,000 days Info Number of hospitalizations per 1,000 long-stay resident days. 1.02
20% better than Montana average

Montana average: 1.27

ED visits per 1,000 days Info Number of outpatient emergency department visits per 1,000 long-stay resident days. 1.69
22% better than Montana average

Montana average: 2.17

Short-stay resident measures
Below average Montana avg: 2.1 Info CMS star rating based on short-stay quality measure performance. 5 stars = much above average, 1 star = much below average.
Pneumococcal Vaccine Info Percent of short-stay residents assessed and appropriately given the pneumococcal vaccine 96.1%
26% better than Montana average

Montana average: 76.4%

Antipsychotic medication increase Info Percent of short-stay residents who newly received an antipsychotic medication 2.2%
27% worse than Montana average

Montana average: 1.8%

Influenza Vaccine Info Percent of short-stay residents assessed and appropriately given the seasonal influenza vaccine 92.8%
26% better than Montana average

Montana average: 73.8%

Re-hospitalized after SNF stay Info Percentage of short-stay residents who were re-hospitalized after their nursing home admission. 28.2%
45% worse than Montana average

Montana average: 19.4%

Emergency department visits Info Percentage of short-stay residents who had an outpatient emergency department visit. 19.8%
32% worse than Montana average

Montana average: 15.0%

Falls with major injury Info Percentage of SNF residents who experience falls with major injury during their stay. 1.8%
127% worse than Montana average

Montana average: 0.8%

Ability to care for self at discharge Info Percentage of residents at or above expected ability to care for themselves at discharge. 49.2%
8% worse than Montana average

Montana average: 53.7%

Successful return to home or community Info Rate of successful return to home or community from a skilled nursing facility. 60.6%
20% better than Montana average

Montana average: 50.6%

Penalties and fines

Federal penalties imposed by CMS for regulatory violations, including civil money penalties (fines) and denials of payment for new Medicare/Medicaid admissions.

Source: CMS Penalties Database (Data as of Jan 2026)

Total fines amount $195K
124% higher than Montana average

Montana average: $87K

Number of fines 4
72% more fines than Montana average

Montana average: 2.3

Payment Denials Info Serious action where Medicare and/or Medicaid temporarily stops payments for new residents until issues are fixed. 1
514% more payment denials than Montana average

Montana average: 0.2

Fines amount comparison
This facility $195K
Montana average $87K
Penalty History

Penalties are imposed by CMS for violations of federal nursing home regulations.

Civil Money Penalty Info Fines imposed for noncompliance, which can be assessed per day or per instance of violation. Aug 28, 2025
$134K
Payment Denial Info Serious action where Medicare and/or Medicaid temporarily stops payments for new residents until issues are fixed. Aug 28, 2025
47 days
Civil Money Penalty Info Fines imposed for noncompliance, which can be assessed per day or per instance of violation. Jun 4, 2025
$19K
Civil Money Penalty Info Fines imposed for noncompliance, which can be assessed per day or per instance of violation. Jun 22, 2023
$39K

Last updated: Jan 2026

Guides for Better Senior Living

Care Cost Calculator: See Prices in Your Area

Nursing Home Data Explorer

Don’t Wait Too Long: 7 Red Flag Signs Your Parent Needs Assisted Living Now

The True Cost of Assisted Living in 2025 – And How Families Are Paying For It

Understanding Senior Living Costs: Pricing Models, Discounts & Financial Assistance

Explore Open Rooms
1 Contact details
2 What type of senior care service are you looking for?
3 What budget do you have in mind for senior care?
4 How soon do you need to find care?
5 Additional details

Thank you for your interest!

Our team will be in touch shortly to help with next steps.