Eagle Cliff Healthcare Community
Nursing Home & Assisted Living · Billings, MT
CMS overall rating Info CMS (the Centers for Medicare & Medicaid Services) is the federal agency that rates nursing home quality. Its Overall Rating runs from 1 to 5 stars, combining health inspections, staffing, and quality measures, with inspections weighted most heavily.

Eagle Cliff Healthcare Community

Nursing Home & Assisted Living · Billings, MT
CMS overall rating Info CMS (the Centers for Medicare & Medicaid Services) is the federal agency that rates nursing home quality. Its Overall Rating runs from 1 to 5 stars, combining health inspections, staffing, and quality measures, with inspections weighted most heavily.
Calculator: See prices in your area
Eagle Cliff Healthcare Community accepts Medicare, Medicaid, and private pay.

Overview of Eagle Cliff Healthcare Community

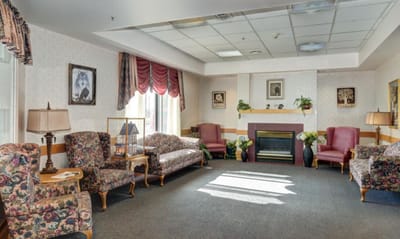
Eagle Cliff Healthcare Community is a skilled nursing and rehabilitation center that provides peaceful living for short-term or long-term residents in Yellowstone County. The skilled nursing home also provides services for memory care. Residents choosing from all kinds of living options receive supportive assistance for everyday living with enriching activities, contributing to a high success rate for recovery.

Eagle Cliff Healthcare Community has designed a personalized care plan tailored to each unique individual– inclusive of specialized therapies with licensed care professionals, skilled nurses, therapists, and post-hospital care.

Quality ratings

Measured by Centers for Medicare & Medicaid Services (CMS)

Overall rating Info The Overall CMS Rating combines results from health inspections, staffing levels and quality measures. Health inspections carry the most weight. Staffing and quality scores can increase or decrease the final rating based on performance compared to state and national standards.
▼ 32.2% Below MT avg. ▼ 32.2% Below MT avg.MT average: 2.9Click the badge to see the full State ranking.Click here to see the full State ranking.
Health Inspection Info Based on the results of the facility's three most recent standard inspections and any complaint investigations. CMS reviews the number, scope, and severity of deficiencies, with more recent findings weighted more heavily.
▼ 29.8% Below MT avg. ▼ 29.8% Below MT avg.MT average: 2.8Click the badge to see the full State ranking.Click here to see the full State ranking.
Staffing Info Measures average nursing staff hours per resident per day, including Registered Nurses (RNs) and total nursing staff. Ratings are adjusted based on the level of care residents require and are compared to state and national benchmarks.
▼ 6.8% Below MT avg. ▼ 6.8% Below MT avg.MT average: 3.2Click the badge to see the full State ranking.Click here to see the full State ranking.
Quality Measures Info Based on clinical and physical health indicators reported to CMS, such as hospital readmissions, falls, pressure ulcers, and improvements in mobility. These measures reflect how well residents' health needs are being managed.
At MT avg. At MT avg.MT average: 3.0Click the badge to see the full State ranking.Click here to see the full State ranking.

Staffing hours breakdown

Info Daily nursing hours per resident by staff type, reported to CMS. Higher is generally better — compare this facility to state and national averages to see where staffing stands.

Hours per resident per day — compared to Montana state averages

Total nursing care / resident Info This home is ranked 21st out of 38 homes in Montana for nurse hours. Total adjusted nursing hours per resident per day, combining RN, LPN, and aide time. CMS adjusts this for case-mix so facilities can be fairly compared.
3h 32m per day
Rank #21 / 38Nurse hours — State benchmarkedThis home is ranked 21st out of 38 homes in Montana. Shows adjusted nurse hours per resident per day benchmarked to the Montana average, with a ranking across 38 Montana facilities. More hours mean more direct care. The national average is about 3.5 hrs; below 3.0 is a red flag.Rankings are based only on facilities in Montana that report data for that category. Facilities without available data are excluded from the ranking.Click the rank badge to see the full State ranking.Click here to see the full State ranking.
This facility Montana avg (4h 32m per day)
vs Montana avg
-22%

5 of 6 metrics below state avg

Standout metric LPN / LVN is +57% above state avg
Staff type Hours / Day / Resident vs state avg
Registered Nurse (RN) Info RNs hold the highest nursing license and can assess residents, interpret test results, and direct care plans. More RN hours per day often signals stronger clinical oversight and faster response to health changes. 30m per day ▼ 47% State avg: 56m per day · National avg: 41m per day
LPN / LVN Info Licensed Practical Nurses (LPNs) or Licensed Vocational Nurses (LVNs) deliver routine hands-on care — medication administration, wound dressing, and monitoring vital signs. They work under RN supervision and make up a large share of daily bedside care. 47m per day ▲ 57% State avg: 30m per day · National avg: 52m per day
Nurse Aide Info Certified Nurse Aides (CNAs) provide the most direct day-to-day assistance: bathing, dressing, feeding, and mobility. Nurse aide hours are typically the largest staffing category and directly affect residents' quality of life. 2h 0m per day ▼ 21% State avg: 2h 32m per day · National avg: 2h 21m per day
Weekend Total Nursing Info Combined nursing hours (RN + LPN + Nurse Aide) per resident per day on weekends. Staffing often drops on weekends — this figure reveals whether the facility maintains adequate coverage outside of weekday hours. 2h 53m per day ▼ 17% State avg: 3h 29m per day · National avg: 3h 26m per day
Physical Therapist Info Hours per resident per day provided by licensed Physical Therapists (PTs) or PT Assistants. PT services help residents recover mobility after injury or illness and are especially important for post-acute (short-stay) rehabilitation. 0m per day ▼ 94% State avg: 4m per day · National avg: 4m per day
Weekend RN Info Registered nurse hours specifically on weekends. Facilities sometimes reduce RN presence on Saturdays and Sundays — a low weekend RN figure compared to weekday hours can indicate reduced clinical oversight when most administrative staff are absent. 19m per day ▼ 53% State avg: 41m per day · National avg: 29m per day

Capacity and availability

This home usually has availability

Lower occupancy than the Montana average: 61.7%
Occupancy rate
27.9% Rank #35 / 39Occupancy rate — State benchmarkedThis home is ranked 35th out of 39 homes in Montana. Shows this facility's occupancy rate versus the Montana average, with its Statewide rank out of 39. Higher occupancy signals strong local demand and financial stability.Rankings are based only on facilities in Montana that report data for that category. Facilities without available data are excluded from the ranking.Click the rank badge to see the full State ranking.Click here to see the full State ranking.
Avg. Length of Stay
455 days
Bed community size
129-bed community Rank #10 / 106Bed count — State benchmarkedThis home is ranked 10th out of 106 homes in Montana. Shows this facility's certified or reported bed count compared to other Montana facilities. Larger communities may offer more amenities, programs, and on-site services for residents and families.Rankings are based only on facilities in Montana that report data for that category. Facilities without available data are excluded from the ranking.Click the rank badge to see the full State ranking.Click here to see the full State ranking.
A larger shared setting that may offer more common spaces and organized community services.
Walk Score
Walk Score: 3 / 100 Rank #148 / 159Walk Score — State benchmarkedThis home is ranked 148th out of 159 homes in Montana. Shows how walkable this facility's neighborhood is compared to the average Walk Score across Montana facilities. Higher scores benefit residents, families, and staff.Rankings are based only on facilities in Montana that report data for that category. Facilities without available data are excluded from the ranking.Click the rank badge to see the full State ranking.Click here to see the full State ranking.
Car-dependent. Most errands require a car, with limited nearby walkable options.

Contact Eagle Cliff Healthcare Community

Inspection History

In Montana, the Department of Public Health and Human Services, Quality Assurance Division is the state body responsible for inspecting and licensing all senior residential care facilities.

Since 2023 · 3 years of data 62 deficiencies

Inspection Scorecard Info This scorecard compares key inspection, deficiency, and complaint metrics at this facility against the Montana state average. Metrics rated ≥15% worse than average are highlighted in red; those ≥15% better are highlighted in green.

Since 2023 vs. Montana state average
Overall vs. MT average 2 Worse Metrics worse than Montana average:
• Total deficiencies (195% above)
• Deficiencies per year (196% above)
0 Better No metrics in this bucket.
Latest Inspection March 27, 2025 Routine

Deficiencies Info Deficiencies are formal regulatory issues recorded during state inspections.

This Facility MT Average vs. MT Avg
Total deficiencies Info Formal regulatory issues recorded by inspectors across all inspection types. 62 21 This facility has 195% more total deficiencies than a typical Montana nursing home (62 vs. MT avg 21).↑ 195% worse
Deficiencies per year Info Average deficiencies per year since 2023. 20.7 7 This facility has 196% more deficiencies per year than a typical Montana nursing home (20.7 vs. MT avg 7).↑ 196% worse

Inspection Reports Summary Info An editor-reviewed summary of the themes and findings across this facility's recent inspection reports.

  • March 27, 2025 inspection found 6 deficiencies including unsafe medication administration, improper use of lifts, dietary sanitation failures, and inadequate infection control causing minimal harm to some residents.
  • August 1, 2024 complaint investigation substantiated failures in timely refunds, grievance handling, resident neglect, abuse reporting, and supervision, resulting in actual harm and elopement incidents.
  • November 7, 2024 routine surveys identified 18 deficiencies including uncertified infection preventionist, missed vaccinations, unsafe environment, incomplete assessments, medication errors, infection control lapses, and insufficient dietary staffing.

Health Inspection History

Inspections since 2023
Total health inspections 6

Montana average 5.1


Last Health inspection on Mar 2025

Total health citations
64 Rank #36 / 39Health citations — State benchmarkedThis home is ranked 36th out of 39 homes in Montana. Shows this facility's total health deficiency citations benchmarked to the Montana State average, with a ranking across all 39 MT facilities. Lower citation counts earn a better rank.Rankings are based only on facilities in Montana that report data for that category. Facilities without available data are excluded from the ranking.Click the rank badge to see the full State ranking.Click here to see the full State ranking.

Montana average 29.7

Citations per inspection
10.67 Rank #38 / 39Citations per inspection — State benchmarkedThis home is ranked 38th out of 39 homes in Montana. Shows average deficiency citations per CMS inspection for this facility versus the Montana mean across 39 facilities with citation data. Lower is better.Rankings are based only on facilities in Montana that report data for that category. Facilities without available data are excluded from the ranking.Click the rank badge to see the full State ranking.Click here to see the full State ranking.

Montana average 5.72


Health citations are formal notices following inspections when they fail to comply with safety and care standards.

43 of 64 citations resulted from standard inspections; 17 of 64 resulted from complaint investigations; and 4 of 64 came from combined inspections (standard and complaint).

Breakdown of citation severity (last 3 years)
Critical health citations
0
100% better than Montana average

Montana average: 0.3


Serious health citations
4
82% worse than Montana average

Montana average: 2.2

0 critical citations Montana average: 0.3

4 serious citations Montana average: 2.2

57 moderate citations Montana average: 26.5

3 minor citations Montana average: 0.7
Citations history (last 3 years)
Infection Control moderate citation Mar 27, 2025
Corrected

Nutrition moderate citation Mar 27, 2025
Corrected

Pharmacy moderate citation Mar 27, 2025
Corrected

Quality of Care moderate citation Mar 27, 2025
Corrected

Staffing Data

Reporting period: October 1 – December 31, 2025 (Q4 2025). Source: CMS Payroll-Based Journal report.

Total staff 99
Employees 88
Contractors 11
Staff to resident ratio 1.34 : 1
28% fewer staff per resident than Montana average
Montana average ratio: 1.86 : 1 Montana average ratio: 1.86 : 1See full Montana ranking
Avg staff/day 41
Average shift 8 hours
7% worse than Montana average
Montana average: 8.6 hours Montana average shift: 8.6 hoursSee full Montana ranking
Total staff hours (quarter) 30,354

Nursing staff breakdown

Q4 2025 · Oct 1 – Dec 31 More info This data comes from the CMS Payroll-Based Journal report covering October 1 – December 31, 2025.
Registered Nurse

Manages medical care and health needs.

RN Staff Info All 11 RN Staff are full-time employees. No contractors work on this role. 11
Average shift length Info Average shift length. Calculated as total hours divided by days worked and average staff per day. 8.6 hours
Licensed Practical Nurse

Assists with medical care and medications.

LPN Staff Info All 15 LPN Staff are full-time employees. No contractors work on this role. 15
Average shift length Info Average shift length. Calculated as total hours divided by days worked and average staff per day. 8.9 hours
Certified Nursing Assistant

Helps with daily care and mobility.

CNA Staff Info All 42 CNA Staff are full-time employees. No contractors work on this role. 42
Average shift length Info Average shift length. Calculated as total hours divided by days worked and average staff per day. 9.2 hours

Contractor staffing

Q4 2025 · Oct 1 – Dec 31 More info This data comes from the CMS Payroll-Based Journal report covering October 1 – December 31, 2025.

Total hours from contractors

1.9%

578 contractor hours this quarter

Speech Language Pathologist: 3 Respiratory Therapy Technician: 3 Qualified Social Worker: 2 Physical Therapy Assistant: 1 Medical Director: 1 Physical Therapy Aide: 1

Staff by category

Q4 2025 · Oct 1 – Dec 31 More info This data comes from the CMS Payroll-Based Journal report covering October 1 – December 31, 2025.
Certified Nursing Assistant 42 0 42 15,162 92 100% 9.2
Licensed Practical Nurse 15 0 15 5,630 92 100% 8.9
Dental Services Staff 10 0 10 3,207 92 100% 7.6
Registered Nurse 11 0 11 2,404 92 100% 8.6
Clinical Nurse Specialist 2 0 2 1,018 72 78% 7.8
Other Dietary Services Staff 3 0 3 622 74 80% 6.6
RN Director of Nursing 1 0 1 495 43 47% 11.5
Nurse Practitioner 1 0 1 447 54 59% 8.3
Nurse Aide in Training 1 0 1 440 40 43% 11
Speech Language Pathologist 0 3 3 345 67 73% 2.6
Administrator 1 0 1 332 39 42% 8.5
Physical Therapy Aide 0 1 1 96 64 70% 1.5
Physical Therapy Assistant 0 1 1 68 73 79% 0.9
Qualified Social Worker 0 2 2 36 19 21% 1.9
Respiratory Therapy Technician 0 3 3 31 44 48% 0.7
Occupational Therapy Aide 1 0 1 19 8 9% 2.4
Medical Director 0 1 1 2 1 1% 2
42 Certified Nursing Assistant
% of Days 100%
15 Licensed Practical Nurse
% of Days 100%
10 Dental Services Staff
% of Days 100%
11 Registered Nurse
% of Days 100%
2 Clinical Nurse Specialist
% of Days 78%
3 Other Dietary Services Staff
% of Days 80%
1 RN Director of Nursing
% of Days 47%
1 Nurse Practitioner
% of Days 59%
1 Nurse Aide in Training
% of Days 43%
3 Speech Language Pathologist
% of Days 73%
1 Administrator
% of Days 42%
1 Physical Therapy Aide
% of Days 70%
1 Physical Therapy Assistant
% of Days 79%
2 Qualified Social Worker
% of Days 21%
3 Respiratory Therapy Technician
% of Days 48%
1 Occupational Therapy Aide
% of Days 9%
1 Medical Director
% of Days 1%

Penalties and fines

Includes penalties issued in 2023-2024

Federal penalties imposed by CMS for regulatory violations, including civil money penalties (fines) and denials of payment for new Medicare/Medicaid admissions.

Source: CMS Penalties Database (Data as of Jan 2026)

Total fines amount $99K Rank #31 / 39Federal fines — State benchmarkedThis home is ranked 31st out of 39 homes in Montana. Shows this facility's cumulative CMS federal fine dollars versus the Montana average among facilities with fines, and where it ranks among 39 facilities in the pool. Lower total dollars mean a better rank.Rankings are based only on facilities in Montana that report data for that category. Facilities without available data are excluded from the ranking.Click the rank badge to see the full State ranking.Click here to see the full State ranking.
14% higher than Montana average

Montana average: $87K

Number of fines 5
115% more fines than Montana average

Montana average: 2.3

Payment Denials Info Serious action where Medicare and/or Medicaid temporarily stops payments for new residents until issues are fixed. 0
100% fewer payment denials than Montana average

Montana average: 0.2

Fines amount comparison
This facility $99K
Montana average $87K
Penalty History

Penalties are imposed by CMS for violations of federal nursing home regulations.

4 penalties in the past 3 years

Multiple penalties were reported in the last 3 years.

Civil Money Penalty Info Fines imposed for noncompliance, which can be assessed per day or per instance of violation. Aug 1, 2024
$59K
Civil Money Penalty Info Fines imposed for noncompliance, which can be assessed per day or per instance of violation. Feb 12, 2024
$2K
Civil Money Penalty Info Fines imposed for noncompliance, which can be assessed per day or per instance of violation. Jan 22, 2024
$3K
Civil Money Penalty Info Fines imposed for noncompliance, which can be assessed per day or per instance of violation. Oct 26, 2023
$17K

Last updated: Jan 2026

Quality of care over time

These measures show how residents usually do over time at this home, based on health outcomes and preventive care.

High-risk clinical events score Info A composite score based on pressure ulcers, falls with injury, weight loss, walking ability decline, and activities of daily living decline. 15.6
40% worse than Montana average

Montana average: 11.2

Functional decline score Info A composite score based on activities of daily living decline, walking ability decline, and incontinence. 27.8
28% worse than Montana average

Montana average: 21.8

Long-stay resident measures
Below average Montana avg: 3.0 Info CMS star rating based on long-stay quality measure performance. 5 stars = significantly above average, 1 star = significantly below average.
Need for Help with Daily Activities Increased Info Percent of long-stay residents whose need for help with daily activities has increased 21.1%
9% worse than Montana average

Montana average: 19.4%

Walking Ability Worsened Info Percent of long-stay residents whose ability to move independently worsened 36.4%
75% worse than Montana average

Montana average: 20.8%

Low Risk Residents with Bowel/Bladder Incontinence Info Percent of low risk long-stay residents who lose control of their bowels or bladder 26.1%
In line with Montana average

Montana average: 25.2%

Falls with Major Injury Info Percent of long-stay residents experiencing one or more falls with major injury 3.9%
11% better than Montana average

Montana average: 4.3%

High Risk Residents with Pressure Ulcers Info Percent of long-stay high risk residents with pressure ulcers 8.7%
39% worse than Montana average

Montana average: 6.3%

Urinary Tract Infection Info Percent of long-stay residents with a urinary tract infection 0.0%
100% better than Montana average

Montana average: 2.8%

Lost Too Much Weight Info Percent of long-stay residents who lose too much weight 8.0%
31% worse than Montana average

Montana average: 6.1%

Depressive Symptoms Info Percent of long-stay residents who have depressive symptoms 6.8%
44% worse than Montana average

Montana average: 4.7%

Antipsychotic Use Info Percent of long-stay residents who received an antipsychotic medication 14.0%
27% better than Montana average

Montana average: 19.1%

Pneumococcal Vaccine Info Percent of long-stay residents assessed and appropriately given the pneumococcal vaccine 88.0%
6% worse than Montana average

Montana average: 93.8%

Influenza Vaccine Info Percent of long-stay residents assessed and appropriately given the seasonal influenza vaccine 98.6%
5% better than Montana average

Montana average: 93.7%

Hospitalizations per 1,000 days Info Number of hospitalizations per 1,000 long-stay resident days. 2.15
69% worse than Montana average

Montana average: 1.27

ED visits per 1,000 days Info Number of outpatient emergency department visits per 1,000 long-stay resident days. 2.28
5% worse than Montana average

Montana average: 2.17

Short-stay resident measures
Average Montana avg: 2.3 Info CMS star rating based on short-stay quality measure performance. 5 stars = much above average, 1 star = much below average.
Pneumococcal Vaccine Info Percent of short-stay residents assessed and appropriately given the pneumococcal vaccine 85.7%
12% better than Montana average

Montana average: 76.4%

Antipsychotic medication increase Info Percent of short-stay residents who newly received an antipsychotic medication 4.8%
175% worse than Montana average

Montana average: 1.8%

Influenza Vaccine Info Percent of short-stay residents assessed and appropriately given the seasonal influenza vaccine 87.8%
19% better than Montana average

Montana average: 73.8%

Re-hospitalized after SNF stay Info Percentage of short-stay residents who were re-hospitalized after their nursing home admission. 15.4%
21% better than Montana average

Montana average: 19.4%

Emergency department visits Info Percentage of short-stay residents who had an outpatient emergency department visit. 17.9%
19% worse than Montana average

Montana average: 15.0%

Falls with major injury Info Percentage of SNF residents who experience falls with major injury during their stay. 0.0%
100% better than Montana average

Montana average: 0.8%

Ability to care for self at discharge Info Percentage of residents at or above expected ability to care for themselves at discharge. 67.4%
26% better than Montana average

Montana average: 53.7%

Successful return to home or community Info Rate of successful return to home or community from a skilled nursing facility. 43.6%
14% worse than Montana average

Montana average: 50.6%

Breakdown by payment type

Medicare

62% of new residents, usually for short-term rehab.

Typical stay 23 days

Private pay

7% of new residents, often for short stays.

Typical stay 2 - 3 years

Medicaid

31% of new residents, often for long-term daily care.

Typical stay 3 - 4 years

Facility Characteristics

Source: CMS Long-Term Care Facility Characteristics (Data as of Jan 2026)

Total residents 74
Medicare
9
12.2% of residents
Medicaid
61
82.4% of residents
Private pay or other
4
5.4% of residents
Programs & Services
Residents Group

Residents meet regularly to discuss policies, care quality, and activities

Active Resident Council

Organized group of residents that meets regularly to discuss facility policies, quality of life, and activities.

Finances and operations

Based on CMS SNF Cost Report for fiscal year ending in 09/2023.

For-profit
Operated by a single business entity.
Net patient revenue Info Net patient revenue — what the home actually collects for resident care, after contractual allowances, bad debt and discounts are subtracted from its gross charges (CMS cost report, Worksheet G-3). It covers resident care only; money the home earns from other sources is shown separately as "Other income."
$3.5M
Net patient income Info Net patient income: net patient revenue minus the home's total operating expenses. A positive figure means it earns more from resident care than it spends to deliver it; a negative figure means the opposite. It excludes non-operating "other income."
-$1.4M
For-profit Operated by a single business entity.
Net patient revenue Info Net patient revenue — what the home actually collects for resident care, after contractual allowances, bad debt and discounts are subtracted from its gross charges (CMS cost report, Worksheet G-3). It covers resident care only; money the home earns from other sources is shown separately as "Other income."
$3.5M Rank #25 / 35Revenue — State benchmarkedThis home is ranked 25th out of 35 homes in Montana. Shows this facility's annual revenue compared to the Montana average. Higher revenue generally means more resources for staffing and capital — read alongside Payroll %.Rankings are based only on facilities in Montana that report data for that category. Facilities without available data are excluded from the ranking.Click the rank badge to see the full State ranking.Click here to see the full State ranking.
Net patient income Info Net patient income: net patient revenue minus the home's total operating expenses. A positive figure means it earns more from resident care than it spends to deliver it; a negative figure means the opposite. It excludes non-operating "other income."
-$1.4M
Other income Info Money the home earns outside of resident care — such as investments, grants, rentals and other non-operating sources (CMS cost report, Worksheet G-3). It is tracked separately from net patient revenue: it is not part of that figure, and it is not included in net patient income.
-$81.3K
Payroll costs Info Staff salaries plus wage-related costs — benefits such as payroll taxes, health insurance and retirement — from the home's own accounting records (CMS cost report, Worksheet A). Contract or agency labor is counted separately, under other operating costs. Rank #27 / 35Payroll — State benchmarkedThis home is ranked 27th out of 35 homes in Montana. Shows total annual staff payroll benchmarked to the Montana average. Higher payroll investment relative to peers often signals better staffing and less reliance on cheaper contract labor.Rankings are based only on facilities in Montana that report data for that category. Facilities without available data are excluded from the ranking.Click the rank badge to see the full State ranking.Click here to see the full State ranking.
$1.7M 47.2% of net patient revenue Info Payroll as a share of revenue: staff salaries and wage-related benefits divided by net patient revenue. A higher figure means more of each revenue dollar goes to staff pay. Rank #29 / 35Payroll % — State benchmarkedThis home is ranked 29th out of 35 homes in Montana. Shows payroll as a percentage of revenue versus the Montana average. Well-run Montana facilities typically land around 65–71% — the top third Statewide. Below 25% may signal understaffing or heavy agency use — read with Staffing ratings.Rankings are based only on facilities in Montana that report data for that category. Facilities without available data are excluded from the ranking.Click the rank badge to see the full State ranking.Click here to see the full State ranking.
Other operating costs Info Everything it costs to run the home apart from payroll — food, utilities, supplies, maintenance, contract labor and administration. Calculated as total operating expense minus payroll (staff salaries and wage-related benefits).
$3.3M
Total costs Info The home's total operating expense for the year — all the costs of running it, salaries included (CMS cost report, Worksheet G-3).
$4.9M

What does this home offer?

Housing options icon

Housing Options: Private Rooms / Semi-Private Rooms

Building type icon
Building type icon

Building Type: Single-story

Transportation services icon

Transportation Services

Fitness and recreation icon

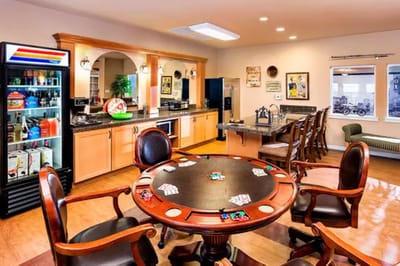
Fitness and Recreation

Who this home usually serves

TYPE OF STAY

Mostly short-term rehab stays

Most residents typically stay for a few weeks or months before returning home or moving on.

Most new residents arrive under Medicare (62% of admissions), and a typical Medicare stay runs around 23 days.

Admissions
29 total

Coverage residents most often arrive under.

Medicare 62%
Private pay 7%
Medicaid 31%
Discharges
31 total

Coverage residents most often leave under.

Medicare 35%
Private pay 13%
Medicaid 52%

Places of interest near Eagle Cliff Healthcare Community

Address 4.0 miles from city center Info Estimated distance in miles from Billings's city center to Eagle Cliff Healthcare Community's address, calculated via Google Maps.

Calculate Travel Distance to Eagle Cliff Healthcare Community

Add your location

Address

Compare Nursing Homes around Billings

The information below is reported by the Montana Department of Public Health and Human Services, Quality Assurance Division.

2 facilities compared · CMS & MT Dept. of Health data

Westpark Village
NH
AL
Billings (Solomon Avenue)
181
Facility 181
MT AVG 70
Rank #5 / 106
- -
4.31
Facility 4.31
MT AVG 4.53
Rank #12 / 38
-14% -5%
$27.8k
Facility $27.8k
MT AVG $83.8k
Rank #19 / 39
28
Facility 28
MT AVG 29.7
Rank #18 / 39
4.7
Facility 4.7
MT AVG 5.7
Rank #10 / 39
2 28 -
64
Facility 64
MT AVG 43
Rank #37 / 159
Community Nursing, Inc
$17.4M
Facility $17.4M
MT AVG $6.3M
Rank #2 / 35
$8.4M
Facility $8.4M
MT AVG $2.8M
Rank #2 / 35
48.5%
Facility 48.5%
MT AVG 45.6%
Rank #8 / 35
275043
Eagle Cliff Healthcare Community
NH
AL
Billings (Heights)
129
Facility 129
MT AVG 70
Rank #10 / 106
27.9%
Facility 27.9%
MT AVG 61.7%
Rank #35 / 39
-55%
3.54
Facility 3.54
MT AVG 4.53
Rank #21 / 38
-29% -22%
$80.9k
Facility $80.9k
MT AVG $83.8k
Rank #31 / 39
64
Facility 64
MT AVG 29.7
Rank #36 / 39
10.7
Facility 10.7
MT AVG 5.7
Rank #38 / 39
4 36 -
3
Facility 3
MT AVG 43
Rank #148 / 159
Amin Family Limited Partnership
$3.5M
Facility $3.5M
MT AVG $6.3M
Rank #25 / 35
$1.7M
Facility $1.7M
MT AVG $2.8M
Rank #27 / 35
47.2%
Facility 47.2%
MT AVG 45.6%
Rank #29 / 35
275123

Financial Assistance for
Nursing Home in Montana

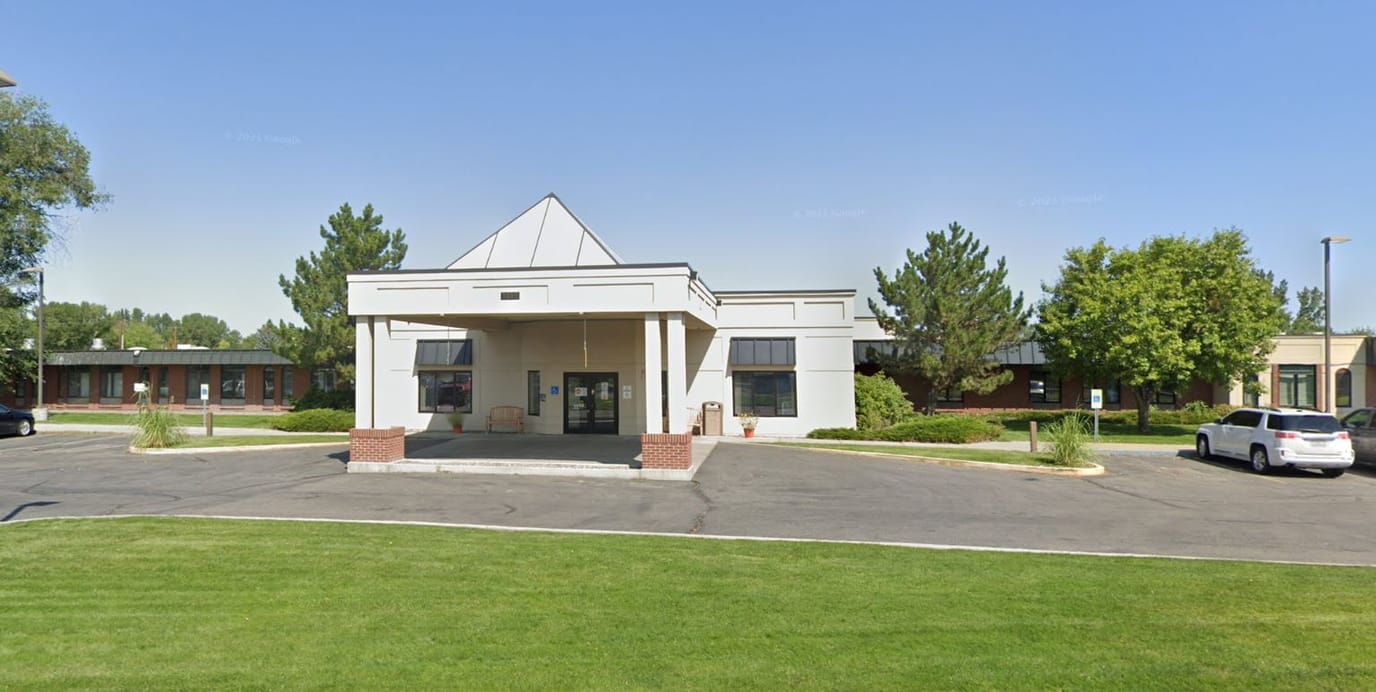
Eagle Cliff Healthcare Community is located in Billings, Montana.
Here are the financial assistance programs available to residents in Montana.

Get Financial aid guidance

Big Sky Waiver

Montana Medicaid Big Sky Waiver

Age 65+ or disabled
General Montana resident, Medicaid- eligible, nursing home-level care need.
Income Limits (2025) ~$2,829/month 300% FBR, individual
Asset Limits $2,000 (individual), $3,000 (couple).
MT

Rural state; limited providers in some areas.

Benefits
Personal care (5-7 hours/day) Respite (240 hours/year) Home modifications ($1,500 avg.) Meals ($6/meal)

Montana Community First Choice

MT CFC

Age 65+ or disabled
General Montana resident, Medicaid- eligible.
Income Limits ~$1,732/month individual, Medicaid threshold
Asset Limits $2,000 individual
MT

Less intensive than waiver; rural focus.

Benefits
Personal care (up to 40 hours/month) Homemaker services Respite (varies)

Big Sky Rx

Montana Big Sky Rx

Age 65+ or disabled
General Montana resident, enrolled in Medicare Part D, income below limit.
Income Limits (2025) ~$2,510/month (individual), ~$3,380/month (couple).
Asset Limits Not assessed.
MT

Covers up to $38.75/month premium; statewide via AAAs.

Benefits
Prescription drug premium assistance (~$465/year) Reducing out-of-pocket costs

Medicare Savings Program (MSP)

Montana Medicare Savings Program

Age 65+ or disabled
General Montana resident, Medicare Part A/B.
Income Limits (2025) ~$2,510/month (QMB), ~$3,380/month (SLMB), ~$3,598/month (QI)—individual.
Asset Limits $9,430 (individual), $14,130 (couple).
MT

Three tiers; no waitlist; includes Extra Help for Part D.

Benefits
Covers Part B premiums ($174.70/month) Deductibles ($240/year) Copays (~20%)

Montana Caregiver Support Program (via NFCSP)

Montana Caregiver Support Program

Age
General Caregivers of 60+ needing care or 55+ caregivers of others; Montana resident; functional needs (2+ ADLs).
Income Limits (2025) Prioritizes ~$24,980/year (individual); no strict cap.
Asset Limits Not assessed; need-based.
MT

10 AAAs; prioritizes low-income, rural caregivers.

Benefits
Respite (4-6 hours/week or 5 days/year) Adult day care ($50/day) Training Supplies (~$500/year)

VA Aid and Attendance (A&A) and Housebound Benefits

Montana VA Aid and Attendance/Housebound

Age 65+ or disabled veteran/spouse
General Montana resident, wartime service, need for ADL help (A&A) or homebound.
Income Limits (2025) Net income < ~$1,984/month (veteran with dependent, A&A); pension offsets income.
Asset Limits ~$155,356 net worth limit
MT

High veteran demand in rural areas.

Benefits
Cash (~$1,433-$2,642/month veteran, ~$951-$1,318 spouse) for care costs (e.g., in-home, assisted living)

Frequently Asked Questions about Eagle Cliff Healthcare Community

What neighborhood is Eagle Cliff Healthcare Community in?

Eagle Cliff Healthcare Community is in the Heights neighborhood of Billings.

Is Eagle Cliff Healthcare Community in a walkable area?

Eagle Cliff Healthcare Community has a walk score of 3. Car-dependent. Most errands require a car, with limited nearby walkable options.

What is the occupancy rate at Eagle Cliff Healthcare Community?

Eagle Cliff Healthcare Community's occupancy is 40.1%.

Does Eagle Cliff Healthcare Community operate as a for-profit or non-profit?

Eagle Cliff Healthcare Community is registered as a for-profit in MT.

Are there photos of Eagle Cliff Healthcare Community?

Yes — there are 4 photos of Eagle Cliff Healthcare Community in the photo gallery on this page.

What is the address of Eagle Cliff Healthcare Community?

Eagle Cliff Healthcare Community is located at 1415 Yellowstone River Rd, Billings, MT 59105.

What is the phone number of Eagle Cliff Healthcare Community?

(406) 245-9330 will put you in contact with the team at Eagle Cliff Healthcare Community.

Guides for Better Senior Living

Care Cost Calculator: See Prices in Your Area

Nursing Home Data Explorer

Don’t Wait Too Long: 7 Red Flag Signs Your Parent Needs Assisted Living Now

The True Cost of Assisted Living in 2025 – And How Families Are Paying For It

Understanding Senior Living Costs: Pricing Models, Discounts & Financial Assistance