


Aventura at The Heights
Nursing Home, Assisted Living, Hospice Care, Memory Care, Respite Care & Skilled Nursing · Pikesville, MD
Aventura at The Heights
Nursing Home, Assisted Living, Hospice Care, Memory Care, Respite Care & Skilled Nursing · Pikesville, MD
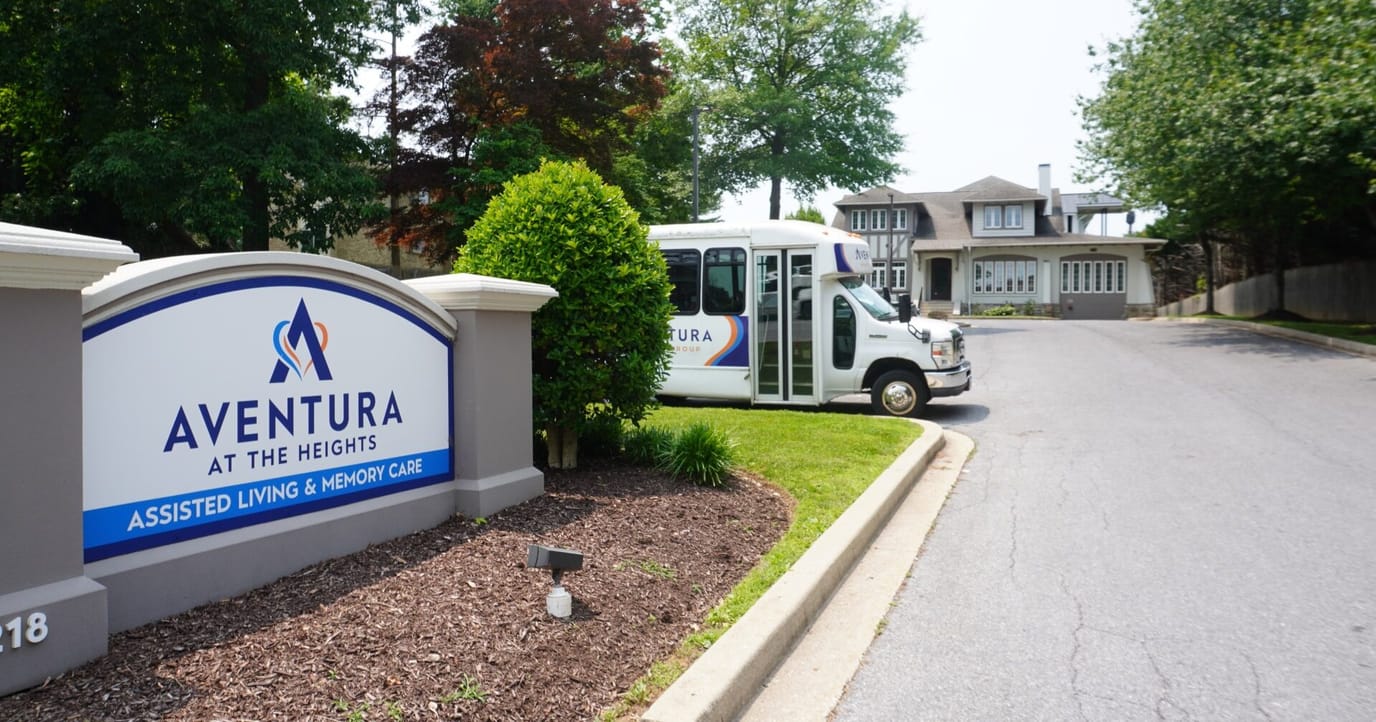
Overview of Aventura at the Heights
Aventura at the Heights is an assisted living community focused on assisting memory care for all seniors seeking additional support to enhance their quality of life. A proud member of the Aventura, The Heights is ensured to provide a professional senior living environment focused on the wellness, health, and social aspects of each resident. The Aventura experience present in The Heights in Baltimore is guaranteed to create connections and provide engaging experiences among members of the community while maintaining a balance of independence and extra comprehensive assistance.
Life at The Heights provides the Aventura way, they provide an array of services: stroke recovery, respite care, transitional care, long-term care, respite stays, and ventilator care– all designed to fit the lifestyle of seniors with specific needs. Aventura also provides a wound care program where residents with surgical or diabetic wounds may need therapy for a complication-free recovery; with that, there are respiratory therapists on-site who are ready to offer relief for residents who are struggling with respiratory emergencies.
68-bed community Rank #186 / 685Bed count — State benchmarkedThis home is ranked 186th out of 685 homes in Maryland for bed count. Shows this facility's certified or reported bed count compared to other Maryland facilities. Larger communities may offer more amenities, programs, and on-site services for residents and families.Facilities with the same value for a metric share the same rank. Rankings are based only on facilities in Maryland that report data for that category. Facilities without available data are excluded from the ranking.Click the rank badge to see the full State ranking.Click here to see the full State ranking.
A moderately sized community that may balance personal attention with shared amenities and social activities.
4 years in operation Rank #194 / 210Years in operation — State benchmarkedThis home is ranked 194th out of 210 homes in Maryland for years in operation. Shows how long this facility has been in operation compared to other Maryland facilities. Longer operating histories may benefit residents, families, and staff.Facilities with the same value for a metric share the same rank. Rankings are based only on facilities in Maryland that report data for that category. Facilities without available data are excluded from the ranking.Click the rank badge to see the full State ranking.Click here to see the full State ranking.
An established community with some operational experience and growing routines.
Walk Score: 41 / 100 Rank #508 / 985Walk Score — State benchmarkedThis home is ranked 508th out of 985 homes in Maryland for walk score. Shows how walkable this facility's neighborhood is compared to the average walk score across Maryland facilities. Higher scores benefit residents, families, and staff.Facilities with the same value for a metric share the same rank. Rankings are based only on facilities in Maryland that report data for that category. Facilities without available data are excluded from the ranking.Click the rank badge to see the full State ranking.Click here to see the full State ranking.
Somewhat walkable. A few nearby services may be reachable on foot, but most trips require transportation.
About this community
Facility TypeAssisted Living
CountyBaltimore City
Apartment
$141 - $184 per day
Hospice Affiliations
Dedicated Alzheimer's Unit
Mild Alzheimer's Level
Moderate Alzheimer's Level
Severe Alzheimer's Level
Demographics
Resident demographic information for this facility.
Gender
- Female 66.7%
- Male 33.3%
Age Distribution
- 85-94 43.3%
- 75-84 23.3%
- 95+ 20%
- 65-74 10%
- ≤64 3.3%
Ethnicity
- White 100%
Infection Prevention & Vaccination
How this facility protects residents through staff vaccination policies and immunization practices.
Mandatory Vaccination Policy
The facility requires certain vaccinations for staff as part of its infection prevention measures.
What does this home offer?
Minimum Age: 55 Years Old
No pets allowed
Housing Options: Studio / 1 Bed
Building Type: 3-story
Transportation Services
Housekeeping Services
Social and Recreational Activities
Reviews (1)
Aventura at The Heights Reviews
Dan Zaleski
What do you like most about living here?
As a resident here for the last 4 months, I have experienced nothing but kindness from the staff and residence here. I receive a written schedule every morning during breakfast with the daily activities that are planned for the day (which include but aren't limited to bingo arts and crafts and even movies that we all watch together). The meal menu is provided and prepared by an actual chef that keeps the meals flavorful and entertaining (there also substitutions made for dietary needs or if you just don't like what's on the menu that night). The nursing staff are knowledgeable and well-versed on conditions that I may need or require due to my medical needs and circumstances. The management staff are very quick to respond to any issues that may arise throughout the day and answer any questions that may come up.
Rating Their Experiences
Are there enough caregivers to handle the residents' needs, especially during emergencies?
Yes
Are the common areas pleasant and comfortable for socializing or relaxing?
Yes
How would you rate the quality and variety of the meals? (1-5)
5
How was the units offered in this community?
Well
Do you feel safe living in this community?
Yes
How well do you think the community handles emergencies or unexpected events?
Great
Are special diets handled well?
Yes
Is the dining schedule flexible enough to meet your preferences?
Yes
How do you feel about the level of social interaction available with other residents?
Great
Are there any hidden fees or unexpected charges?
No
Would you recommend this community to others looking for senior living options?
Yes
Is there anything you wish you knew before moving in?
Places of interest near Aventura at The Heights
![]() 0.7 miles from city center
0.7 miles from city center
![]() Estimated distance in miles from Pikesville's city center to Aventura at The Heights's address, calculated via Google Maps.
Estimated distance in miles from Pikesville's city center to Aventura at The Heights's address, calculated via Google Maps.
Calculate Travel Distance to Aventura at The Heights
Add your location
Compare Nursing Homes around Pikesville
The information below is reported by the Maryland Department of Health, Office of Health Care Quality.
| King David Nursing and Rehabilitation Center | NH HOS PC RC SNF | Pikesville (Colonial Village) | 100
Facility
100
MD AVG
42
Rank
#109 / 685 |
99.5%
Facility
99.5%
MD AVG
80.3
Rank
#1 / 97 | +24% | 3.39
Facility
3.39
MD AVG
3.77
Rank
#80 / 143 | -77% | -10% | $0
Facility
$0
MD AVG
$65.0k
Rank
#1 / 145 | 60
Facility
60
MD AVG
49.9
Rank
#106 / 145 | 15.0
Facility
15.0
MD AVG
12.8
Rank
#105 / 145 | - | 100 | - |
72
Facility
72
MD AVG
43
Rank
#160 / 985 | 4260 Group LLC | $16.3MFiscal year ending 12/2023
Facility
$16.3MFiscal year ending 12/2023
MD AVG
$18.7M
Rank
#74 / 144 | $2.3MFiscal year ending 12/2023
Facility
$2.3MFiscal year ending 12/2023
MD AVG
$6.5M
Rank
#77 / 144 | 14.3%Fiscal year ending 12/2023
Facility
14.3%Fiscal year ending 12/2023
MD AVG
38.5%
Rank
#78 / 144 | 215022 | ||||
| Autumn Lake Healthcare at Pikesville | NH HOS PC RC SNF | Pikesville (Sudbrook Lane) | 140
Facility
140
MD AVG
42
Rank
#49 / 685 |
81.3%
Facility
81.3%
MD AVG
80.3
Rank
#64 / 97 | +1% | 3.56
Facility
3.56
MD AVG
3.77
Rank
#63 / 143 | -37% | -6% | $0
Facility
$0
MD AVG
$65.0k
Rank
#1 / 145 | 67
Facility
67
MD AVG
49.9
Rank
#116 / 145 | 16.8
Facility
16.8
MD AVG
12.8
Rank
#117 / 145 | 1 | 114 | - |
79
Facility
79
MD AVG
43
Rank
#99 / 985 | Pikesville Operator, LLC | $15.9MFiscal year ending 12/2023
Facility
$15.9MFiscal year ending 12/2023
MD AVG
$18.7M
Rank
#82 / 144 | $2.3MFiscal year ending 12/2023
Facility
$2.3MFiscal year ending 12/2023
MD AVG
$6.5M
Rank
#59 / 144 | 14.2%Fiscal year ending 12/2023
Facility
14.2%Fiscal year ending 12/2023
MD AVG
38.5%
Rank
#24 / 144 | 215082 |
Financial Assistance for
Nursing Home in Maryland
Aventura at The Heights is located in Pikesville, Maryland.
Here are the financial assistance programs available to residents in Maryland.
Frequently Asked Questions about Aventura at The Heights
Is Aventura at The Heights in a walkable area?
Aventura at The Heights has a walk score of 41. Somewhat walkable. A few nearby services may be reachable on foot, but most trips require transportation.
How long has Aventura at The Heights been in business?
Aventura at The Heights has been operating for approximately 4 years, based on available licensing and registration records.
Are pets allowed at Aventura at The Heights?
No, Aventura at The Heights has a no-pet policy.
How many beds does Aventura at The Heights have?
Aventura at The Heights has 68 beds.
Are there photos of Aventura at The Heights?
Yes — there are 8 photos of Aventura at The Heights in the photo gallery on this page.
What is the address of Aventura at The Heights?
Aventura at The Heights is located at 7218 Park Heights Ave, Pikesville, MD 21208.
What is the phone number of Aventura at The Heights?
(410) 318-8000 will put you in contact with the team at Aventura at The Heights.
Guides for Better Senior Living
Care Cost Calculator: See Prices in Your Area
Nursing Home Data Explorer
Don’t Wait Too Long: 7 Red Flag Signs Your Parent Needs Assisted Living Now
The True Cost of Assisted Living in 2025 – And How Families Are Paying For It
Understanding Senior Living Costs: Pricing Models, Discounts & Financial Assistance
Updated on
