Explore Open Rooms

1 Contact details
2 What type of senior care service are you looking for?
3 What budget do you have in mind for senior care?
4 How soon do you need to find care?
5 Additional details

Thank you for your interest!

Our team will be in touch shortly to help with next steps.

Nursing Home in Ithaca

CMS overall rating Info The Overall CMS Rating combines results from health inspections, staffing levels and quality measures. Health inspections carry the most weight. Staffing and quality scores can increase or decrease the final rating based on performance compared to state and national standards.

Beechtree Center For Rehabilitation & Nursing

318 S Albany St, Ithaca, NY 14850 View map
Overview of Beechtree Center for Rehabilitation & Nursing

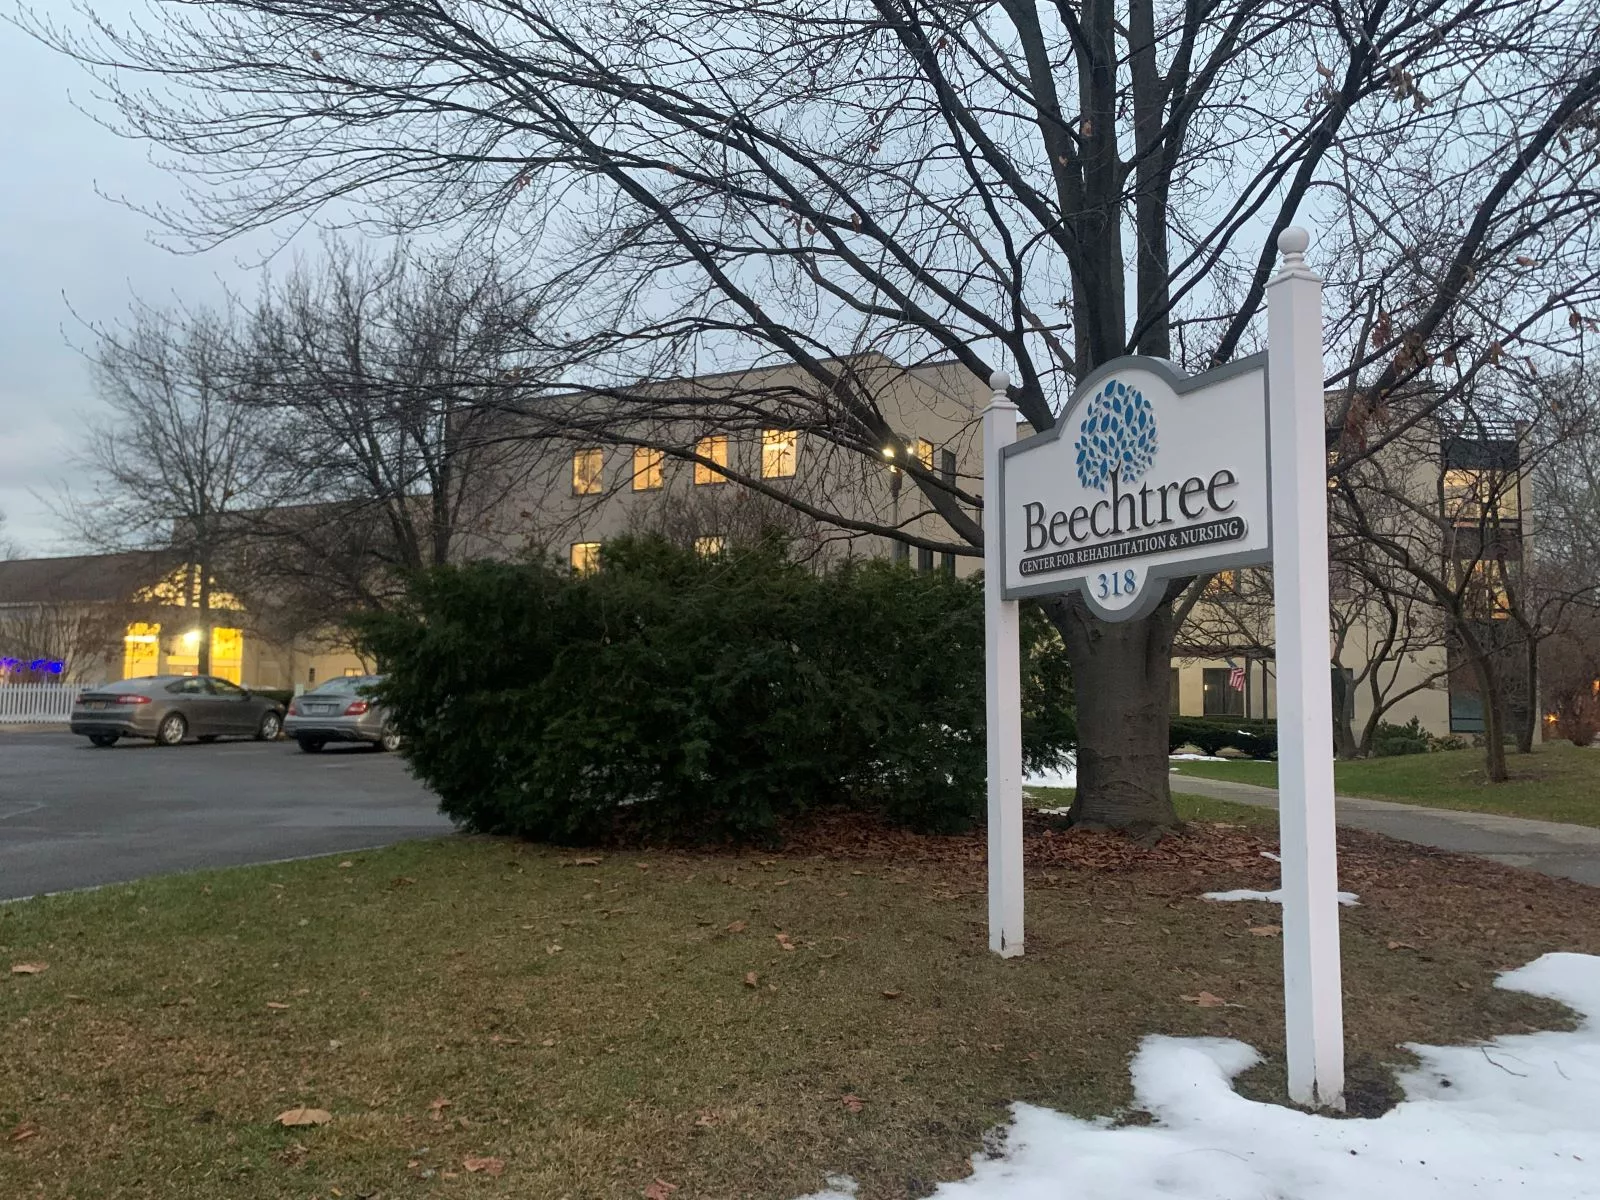
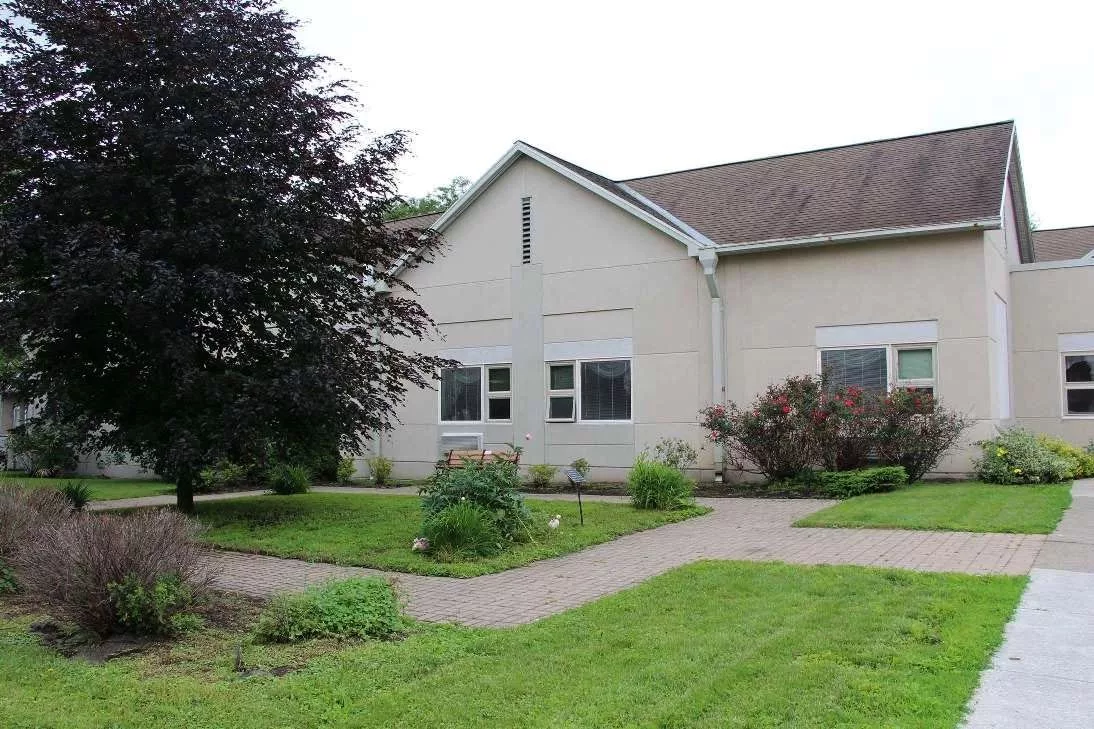
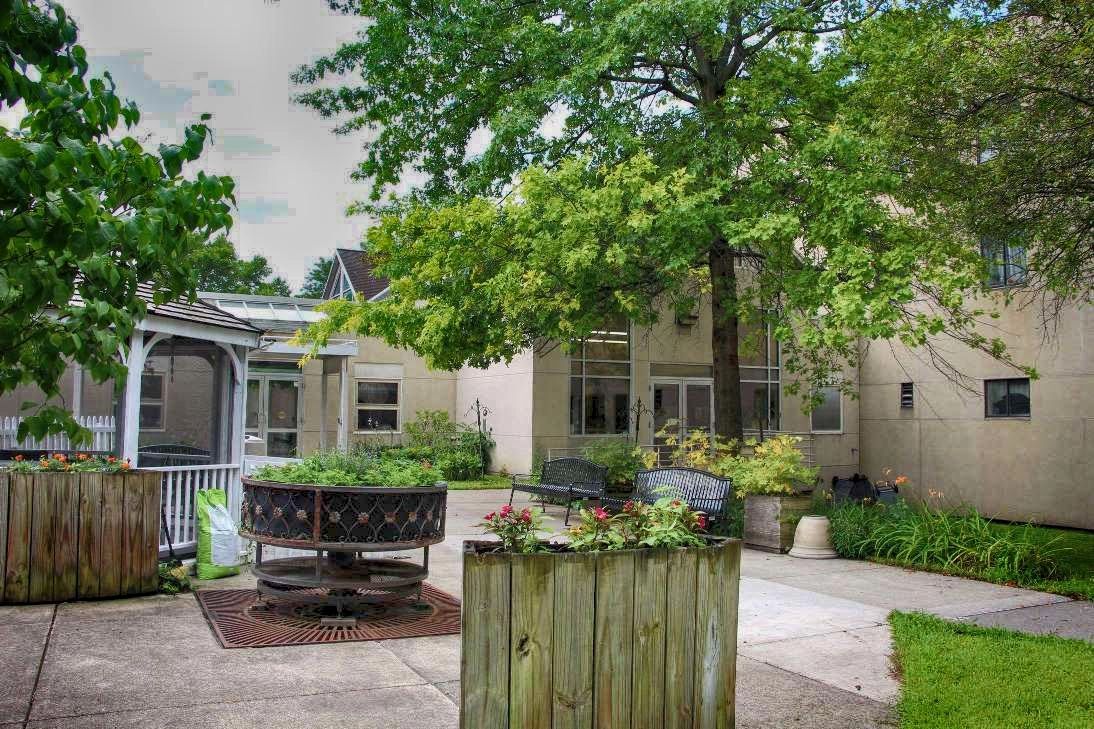
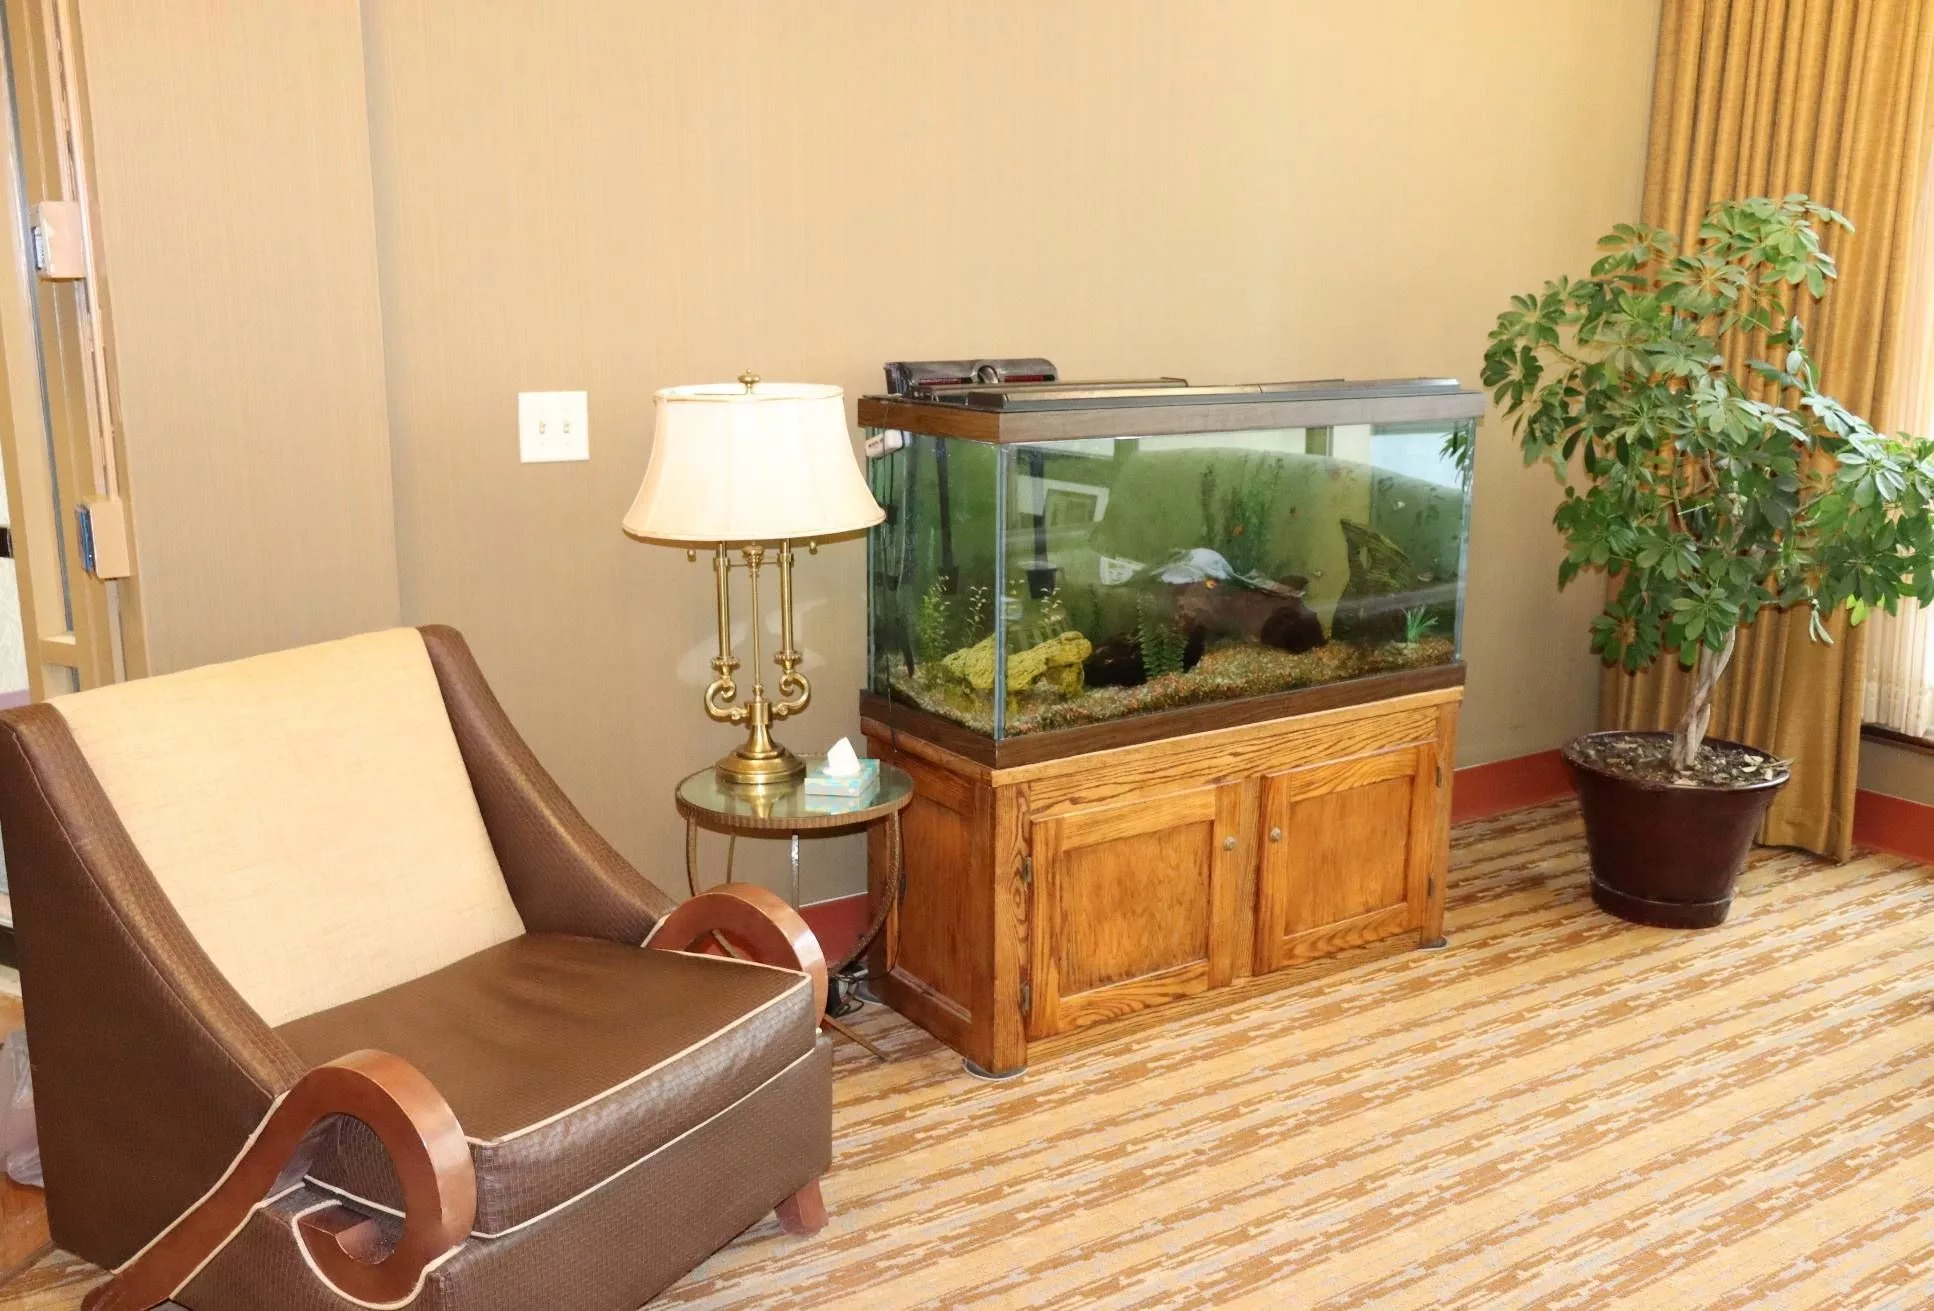
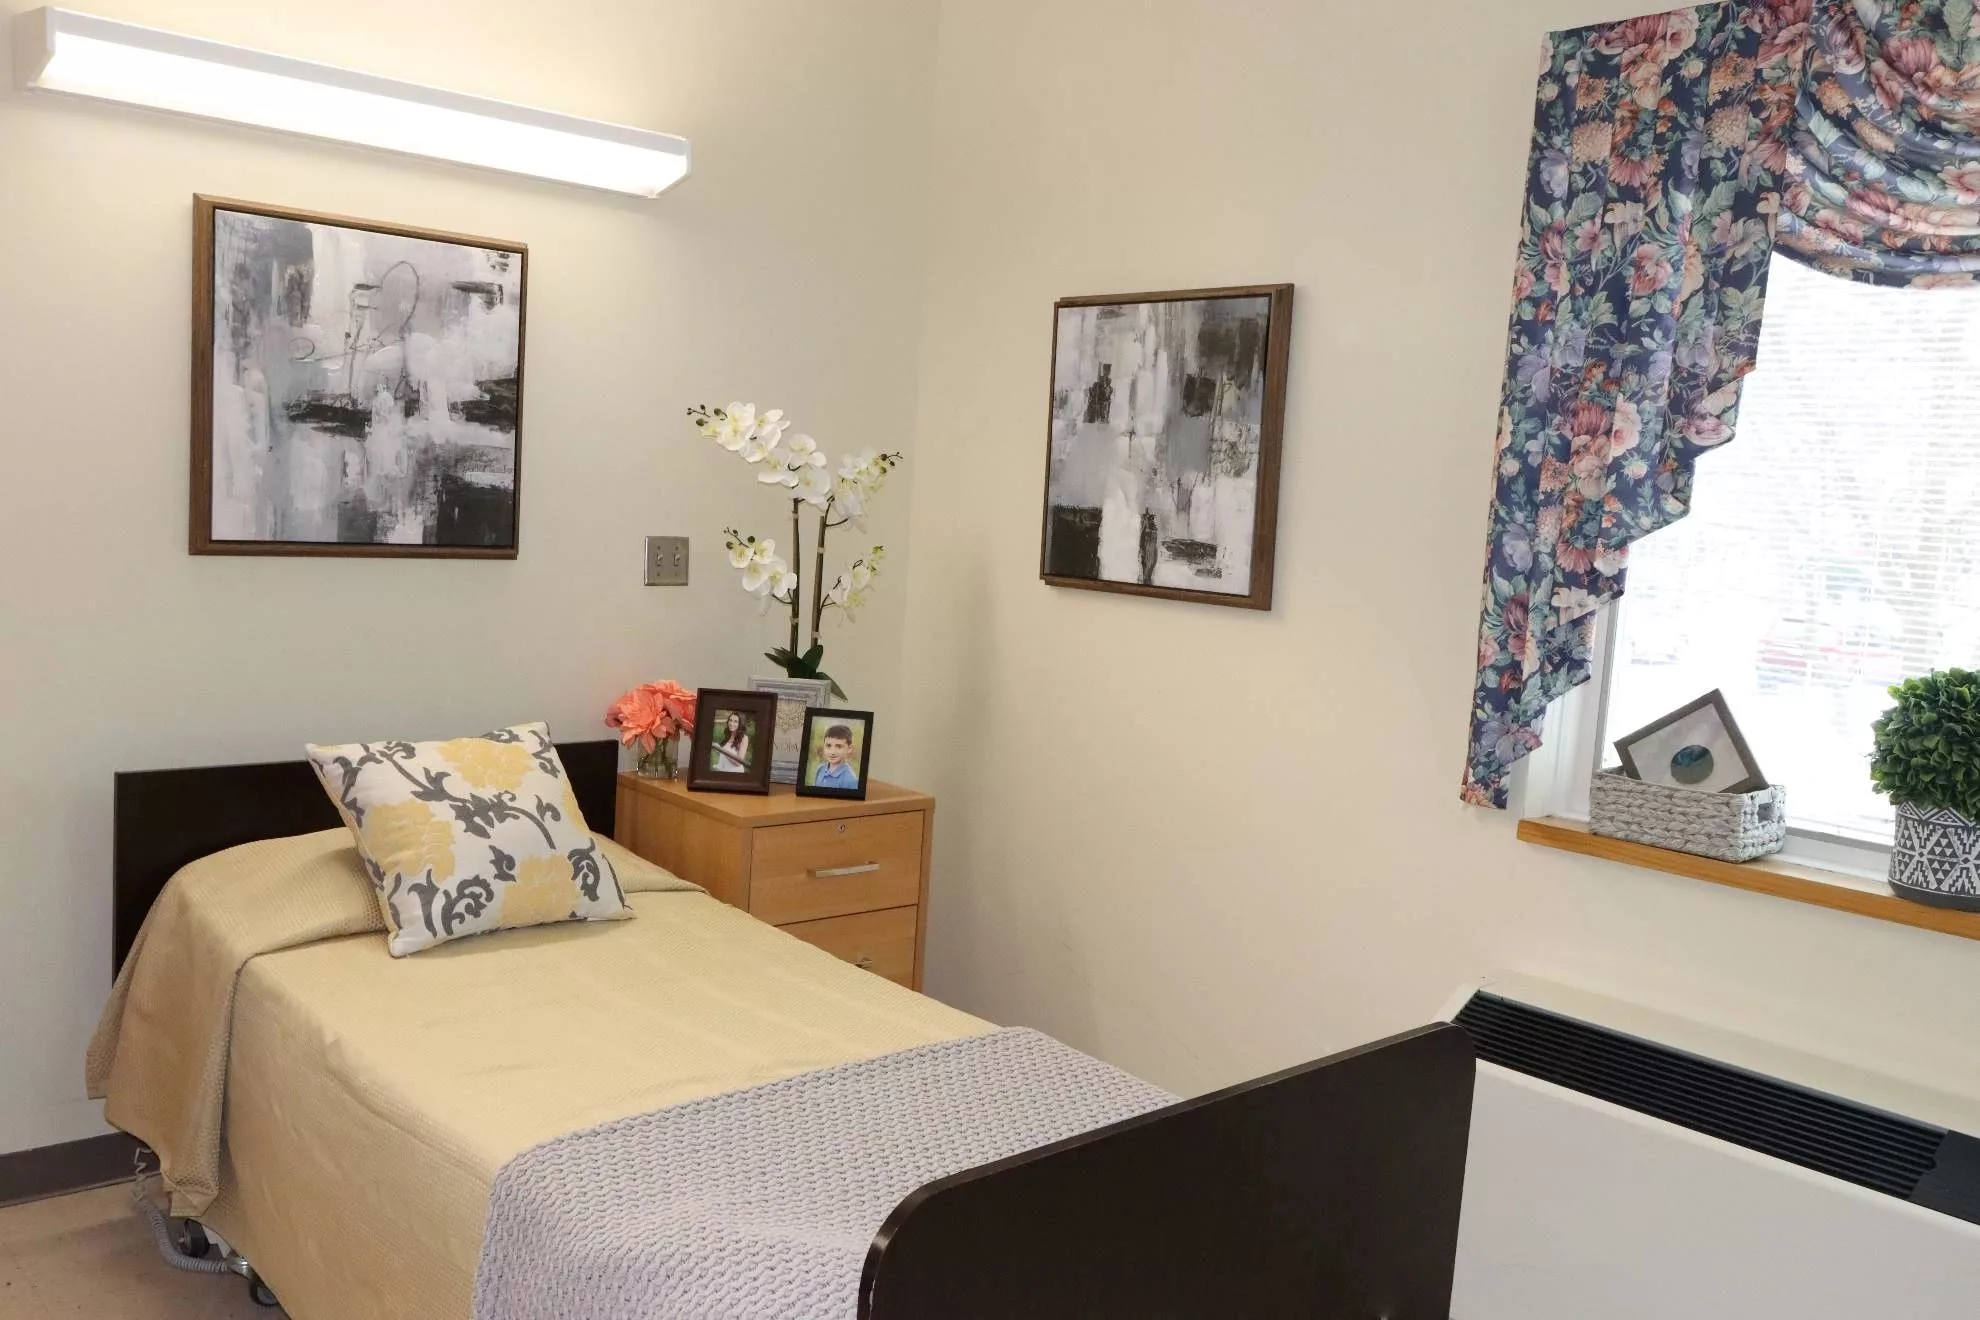
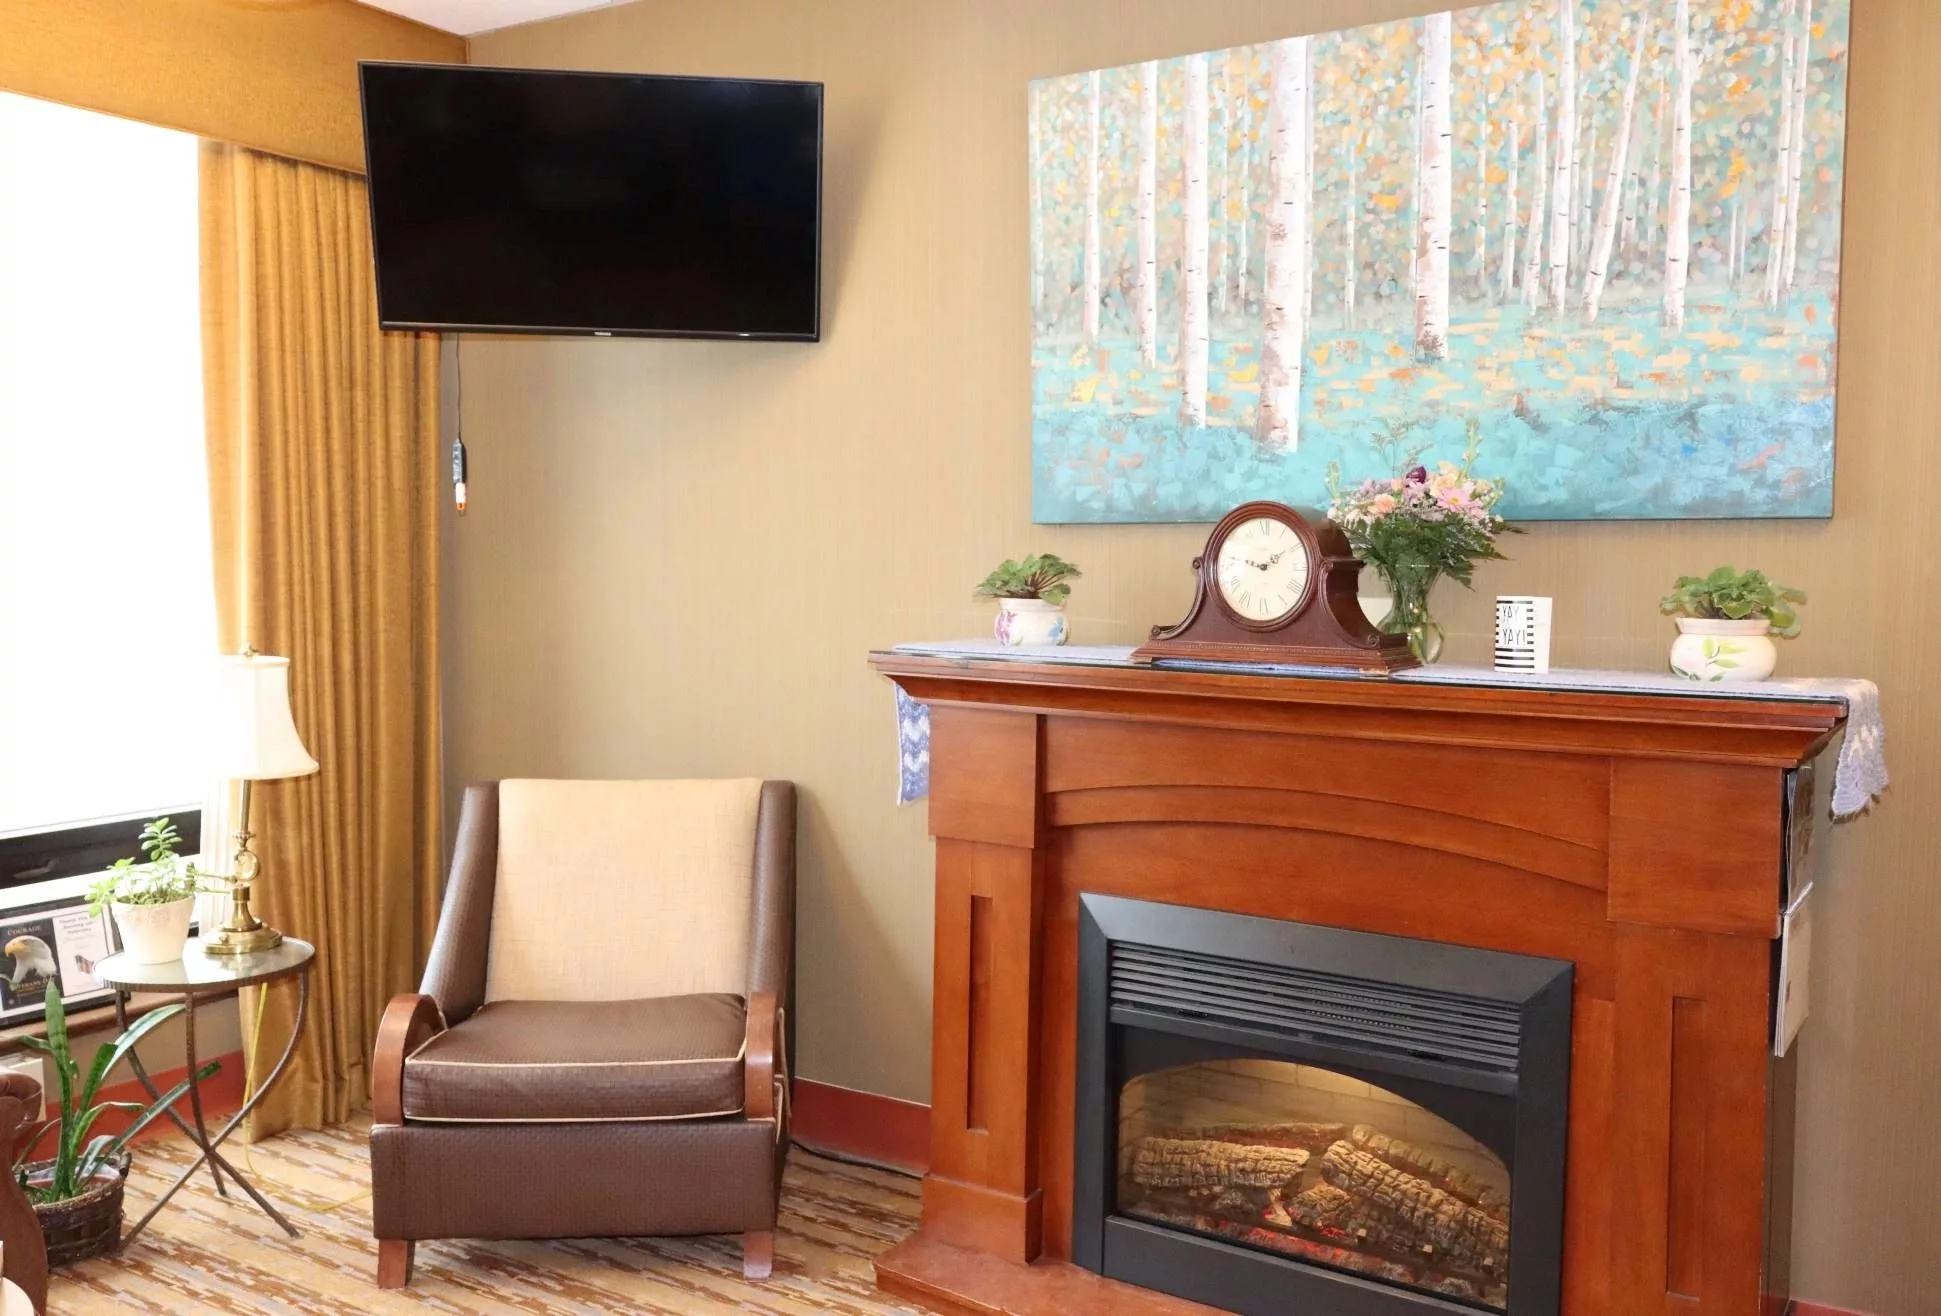
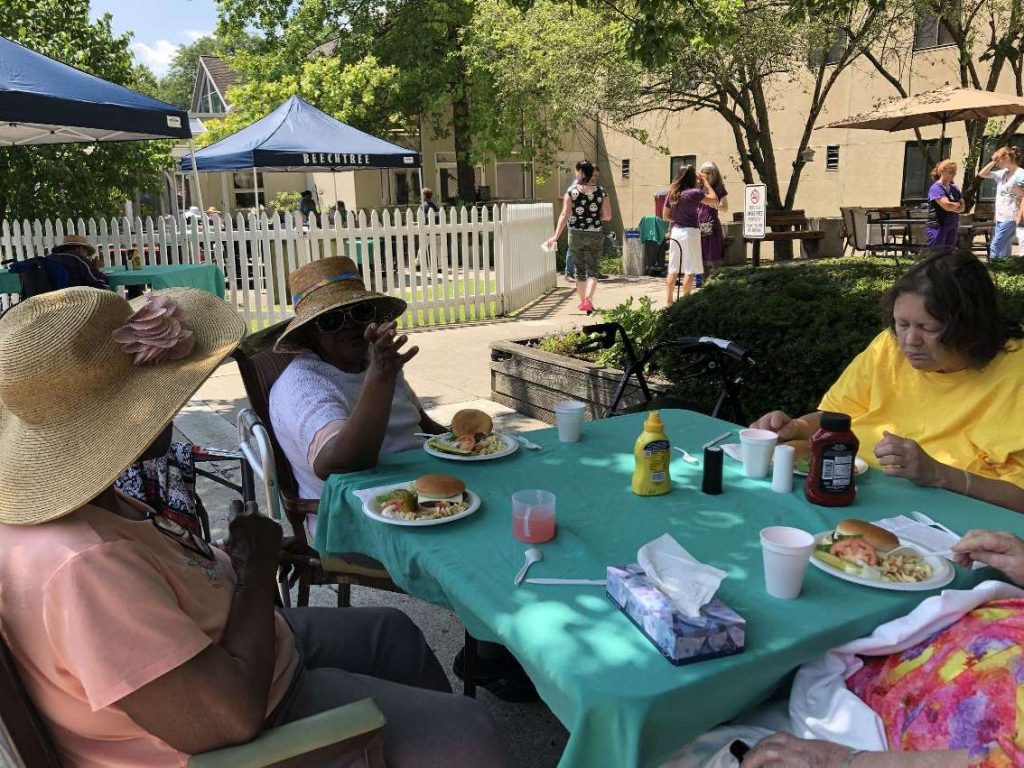
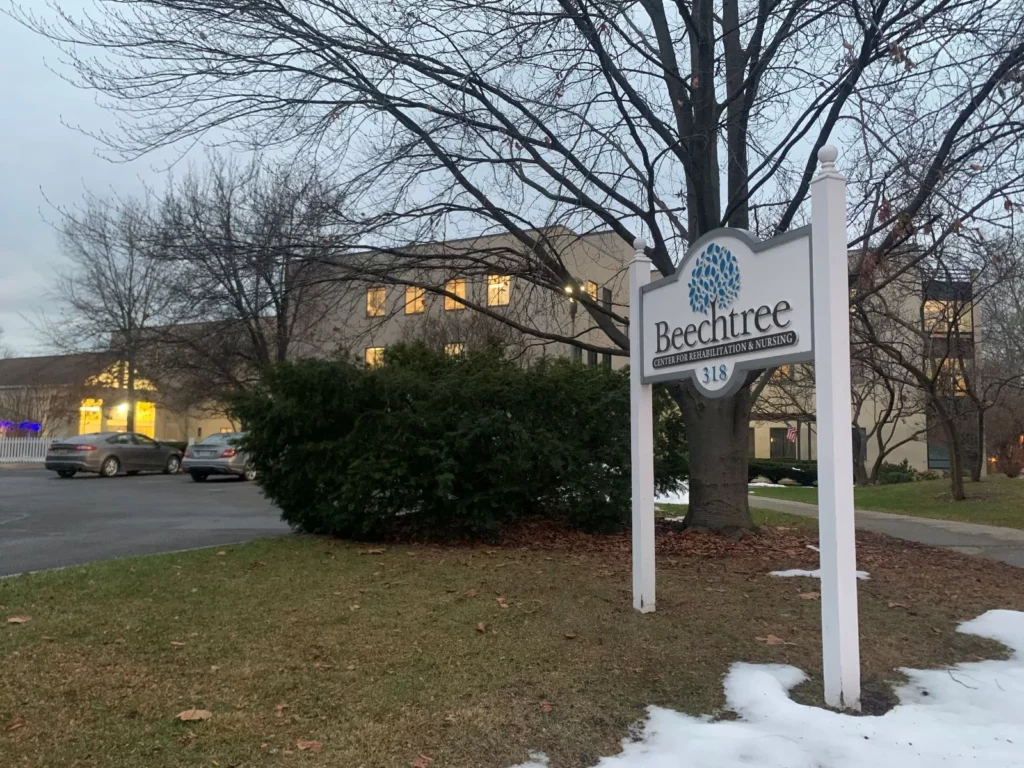
Beechtree Center is a distinguished 120-bed skilled nursing residence and rehabilitation center located in downtown Ithaca, New York. Providing 24-hour skilled nursing care, this community ensures a secure and engaging environment where each resident is treated with utmost dignity and respect. Beechtree Center for Rehabilitation and Nursing takes pride in consistently delivering the highest level of customer satisfaction. The center addresses physical, social, emotional, and spiritual needs, striving to create a home-like environment that cares for everyone.
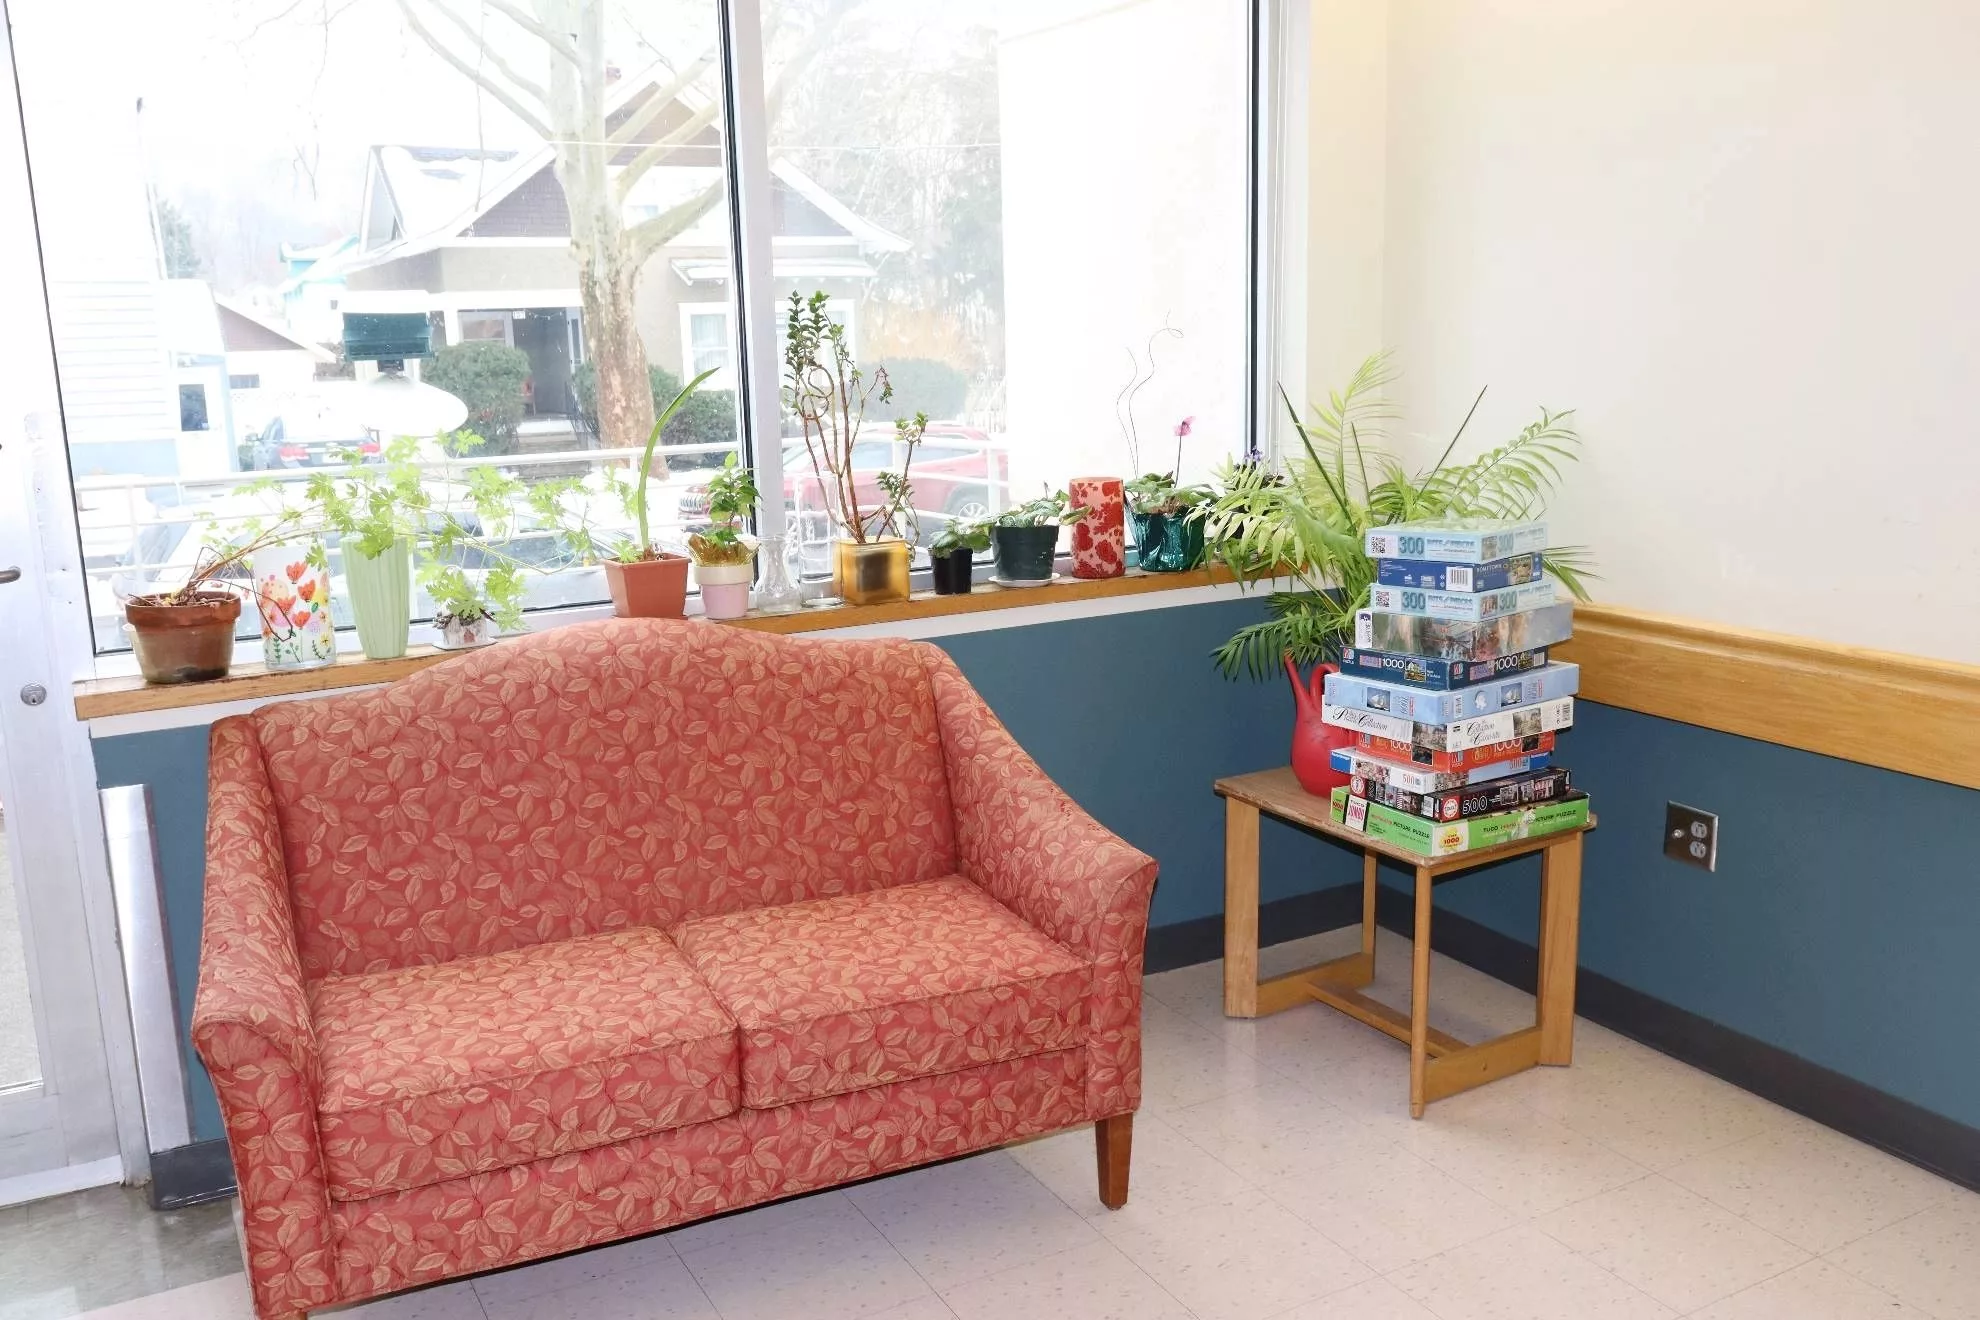
Beechtree embraces the concept of Person-Centered Care, prioritizing the importance of quality of life alongside quality of care. Their devoted staff partners closely with residents and their families, aiming to achieve and maintain the highest quality of life for every individual. From waking up early to choosing the timing of showers or baths, Beechtree endeavors to accommodate individual preferences, allowing residents and staff to make decisions collaboratively. The center also offers restaurant-style dining, serving freshly prepared food, adding to the overall comfort and home-like atmosphere that they provide for seniors.

(607) 273-4166

Quality ratings

Measured by Centers for Medicare & Medicaid Services (CMS)

Overall rating Info The Overall CMS Rating combines results from health inspections, staffing levels and quality measures. Health inspections carry the most weight. Staffing and quality scores can increase or decrease the final rating based on performance compared to state and national standards.
1/5
New York average: 3.1/5
Health Inspection Info Based on the results of the facility's three most recent standard inspections and any complaint investigations. CMS reviews the number, scope, and severity of deficiencies, with more recent findings weighted more heavily.
2/5
New York average: 2.8/5
Staffing Info Measures average nursing staff hours per resident per day, including Registered Nurses (RNs) and total nursing staff. Ratings are adjusted based on the level of care residents require and are compared to state and national benchmarks.
1/5
New York average: 2.7/5
Quality Measures Info Based on clinical and physical health indicators reported to CMS, such as hospital readmissions, falls, pressure ulcers, and improvements in mobility. These measures reflect how well residents' health needs are being managed.
3/5
New York average: 4.0/5

Nursing care per resident

Info This shows how many total hours of nursing staff time are available per resident each day. Higher numbers usually mean more staff support.
2h 57m per day

This home provides 16% less nursing time per resident than the New York average.

New York average: 3h 29m per day

Staffing hours breakdown

Info Hours of care per resident per day, broken down by staff type. Data from CMS Medicare.
Staff type Facility State avg National avg
Registered Nurse (RN) Info Registered nurse hours per resident per day. 28m per day 42m per day 41m per day
Nurse Aide Info Nurse aide hours per resident per day. 1h 48m per day 2h 11m per day 2h 21m per day
Total Nursing (Weekend) Info Total number of nurse staff hours per resident per day on weekends. 2h 22m per day 3h 10m per day 3h 26m per day
Physical Therapist Info Physical therapist staff hours per resident per day. 10m per day 7m per day 4m per day
RN (Weekend) Info Registered nurse hours per resident per day on weekends. 14m per day 28m per day 29m per day

Capacity and availability

Medium-capacity home

Offers a balance of services and community atmosphere.

Total beds 120

This home is often near full

That suggests steady demand, but availability may be limited.

Higher demand than most homes in New York
Occupancy rate 95%
Residents per day (avg) 111
Occupancy rate
95%
Residents per day (avg)
111

Who this home usually serves

TYPE OF STAY

Mostly short-term rehab stays

Most residents typically stay for a few weeks or months before returning home or moving on.

Might be optimal for
Short stays Recovery Medicare-covered care

Breakdown by payment type

Medicare

46% of new residents, usually for short-term rehab.

Typical stay 1 - 2 months

Private pay

41% of new residents, often for short stays.

Typical stay 1 - 2 months

Medicaid

12% of new residents, often for long-term daily care.

Typical stay 2 - 3 years

Finances and operations

Privately-owned community
Operated by a partnership between two or more business owners.
Home revenue
$14.3M
Operating loss
-$2.1M
Privately-owned community Operated by a partnership between two or more business owners.
Home revenue
$14,282,713.00
Operating loss
$-2,111,302.00
Payroll costs Info The portion of the home's budget spent on staff, including nurses, caregivers, and other employees who support care and operations.
$6.8M
47.7% of revenue
Other operating costs Info All remaining costs needed to run the home, such as food, utilities, building maintenance, supplies and administrative expenses.
$9.5M
Total costs $16.3M
Bed community size
120-bed community
A larger shared setting that may offer more common spaces and organized community services.
Walk Score
Walk Score: 91 / 100
Walker's paradise. Daily errands do not require a car, with many shops and services nearby.

About this community

License Details

Facility TypeNursing Home
CountyTompkins

Ownership & Operating Entity

Beechtree Center For Rehabilitation & Nursing is legally operated by BTRNC, LLC (For Profit).

Therapy & Rehabilitation

3 services
Rehabilitation Services
Respite Care
Short-Term Rehab

Staffing & Medical

2 services
Skilled Nursing
24-Hour Staffing

Additional Services

3 services
Short Term Rehabilitation
Long Term Care / Skilled Nursing
Alzheimer’s / Dementia Program

Amenities & Lifestyle

5 amenities
Music And Memory Programs
Pet Therapy
Recreation Therapy
Restaurant Style Dining
Specialized Resident And Guest Services
Specific ProgramsShort Term Rehabilitation, Long Term Care / Skilled Nursing, Alzheimer’s / Dementia Program, Respite Care, Music and Memory Program, Pet Therapy, Recreation Therapy, Resident / Guest Services, Restaurant Style Dining and Therapeutic Diets

Dining & Nutrition

Food DescriptionRestaurant style dining with therapeutic diets.

Types of Care at Beechtree Center For Rehabilitation & Nursing

Memory Care Respite Care
Contact Beechtree Center For Rehabilitation & Nursing

Inspection History

In New York, the Department of Health, Office of Aging and Long Term Care performs unannounced onsite inspections to monitor compliance with state and federal healthcare regulations.

5 inspections

4 with citations, 1 without citations

14 on-site complaint investigations

New York average: 9 inspections (5 with citations), 15 on-site complaint investigations

88 complaints

78 complaints per 100 occupied beds

New York average: 49.9 complaints per 100 occupied beds

Formal expressions of dissatisfaction or concern made by residents, or their families regarding various aspects of the care, services, and environment provided.

New York average: 79 complaints

Latest inspection

Date August 29, 2025
Complaint Investigation

20 total citations

17 health citations 3 life safety citations

Citations indicate regulatory violations. A higher number implies the facility had several areas requiring improvement.

New York average: 29 citations

New York average: 20 health citations

New York average: 4 life safety citations

73 deficiencies

Deficiencies indicate regulatory issues. A higher number implies the facility had several areas requiring improvement.

New York average: 22 deficiencies

Health Inspection History

Inspections
Total health inspections 3

New York average 3.6


Last Health inspection on Aug 2025

Total health citations 20

New York average 18.5

Citations per inspection
6.67

New York average 5.05


Health citations are formal notices following inspections when they fail to comply with safety and care standards.

10 of 20 citations resulted from standard inspections; and 10 of 20 came from combined inspections (standard and complaint).

Breakdown of citation severity (last 3 years)
Critical Health citations More info 0
100% better than New York average

New York average: 0.2


Serious Health citations More info 0
100% better than New York average

New York average: 0.2

0 critical citations More info New York average: 0.2

0 serious citations More info New York average: 0.2

20 moderate citations More info New York average: 17.4

0 minor citations More info New York average: 0.7
Citations history (last 3 years)
Infection Control moderate citation Info Issues related to preventing and controlling infections, including hygiene practices and safety protocols. Aug 29, 2025
Corrected

Nutrition moderate citation Info Issues related to food quality, meal service, and resident's nutritional needs. Aug 29, 2025
Corrected

Nutrition moderate citation Info Issues related to food quality, meal service, and resident's nutritional needs. Aug 29, 2025
Corrected

Nutrition moderate citation Info Issues related to food quality, meal service, and resident's nutritional needs. Aug 29, 2025
Corrected

Compare Nursing Homes around Ithaca The information below is reported by the New York State Department of Health.

1 facility compared · CMS & NY Dept. of Health data · Updated Apr 2026

Filter by care type
Beechtree Center For Rehabilitation & Nursing
NH

Nursing Home Licensed facility providing 24/7 skilled nursing care for residents with complex, ongoing medical needs. Staffed by RNs, LPNs, and CNAs. Inspected and star-rated annually by CMS. Accepts Medicare (short-term rehab) and Medicaid (long-term care).

MC

Memory Care Secured, specialized care for people living with Alzheimer's or dementia. Staff trained in cognitive impairment, with higher staff-to-resident ratios and an environment designed to reduce confusion and wandering risk.

RC

Respite Care Short-term temporary care — days to weeks — to give family caregivers a break. Full care provided during the stay. Often used after hospitalization or to trial a facility before a permanent placement decision.

Ithaca
120
95.0%
+8%
2.95
-27%
-18%
0
20
6.7
0
111
91
Koenig, Uri
$14.2M
$6.8M
47.8%
335017

Places of interest near Beechtree Center For Rehabilitation & Nursing

Address 0.6 miles from city center — 1.07 miles to nearest hospital (Cornell Health at Cornell University)

Address 318 S Albany St, Ithaca, NY 14850

Calculate Travel Distance to Beechtree Center For Rehabilitation & Nursing

Add your location

Address

Staffing Data (Q2 2025)

This data corresponds to Q2 2025 and is based on CMS Payroll-Based Journal.

Total staff 178
Employees 166
Contractors 12
Staff to resident ratio 1.53:1
775% better than New York average

New York average ratio: 0.18:1

Avg staff/day 70
Average shift 7.5 hours
0% compared with New York average

New York average: 7.7 hours

Total staff hours (quarter) 47,534
Nursing staff breakdown
Registered Nurse

Manages medical care and health needs.

Total count 16
Average shift length Info Average shift length. Calculated as total hours divided by days worked and average staff per day. 7.6 hours

No contractors work on this role.

Licensed Practical Nurse

Assists with medical care and medications.

Total count 31
Average shift length Info Average shift length. Calculated as total hours divided by days worked and average staff per day. 7.8 hours

This role is partially covered by contractors.

Certified Nursing Assistant

Helps with daily care and mobility.

Total count 57
Average shift length Info Average shift length. Calculated as total hours divided by days worked and average staff per day. 7.8 hours

No contractors work on this role.

Contractor staffing

Total hours from contractors

4%

1,899 contractor hours this quarter

Licensed Practical Nurse: 12
Staff by category
Certified Nursing Assistant5705718,21791100%7.8
Licensed Practical Nurse1912316,85291100%7.8
Physical Therapist130133,92791100%6.5
Registered Nurse160163,3759099%7.6
Occupational Therapy Aide9092,99691100%7
Nurse Aide in Training200202,4938391%6.7
Respiratory Therapy Technician8081,9056673%6.9
Physical Therapy Assistant5051,6286875%6.9
Speech Language Pathologist4041,2636470%7.6
Clinical Nurse Specialist2029456571%8.1
Mental Health Service Worker2028876470%7.6
Nurse Practitioner1017496774%11.2
Dietitian4047137178%7
Other Dietary Services Staff3036217582%6.7
Administrator2024886167%8
Qualified Social Worker1014766066%7.9
57 Certified Nursing Assistant
% of Days 100%
31 Licensed Practical Nurse
% of Days 100%
13 Physical Therapist
% of Days 100%
16 Registered Nurse
% of Days 99%
9 Occupational Therapy Aide
% of Days 100%
20 Nurse Aide in Training
% of Days 91%
8 Respiratory Therapy Technician
% of Days 73%
5 Physical Therapy Assistant
% of Days 75%
4 Speech Language Pathologist
% of Days 70%
2 Clinical Nurse Specialist
% of Days 71%
2 Mental Health Service Worker
% of Days 70%
1 Nurse Practitioner
% of Days 74%
4 Dietitian
% of Days 78%
3 Other Dietary Services Staff
% of Days 82%
2 Administrator
% of Days 67%
1 Qualified Social Worker
% of Days 66%

Facility Characteristics

Source: CMS Long-Term Care Facility Characteristics (Data as of Jan 2026)

Total census
116 residents
Residents by payment source
Medicare
30 residents (25.9%)
Medicaid
78 residents (67.2%)
Private pay or other
8 residents (6.9%)
Programs & Services
Residents' Group

Residents meet regularly to discuss policies, care quality, and activities

Nurse Aide Training

State-approved Nurse Aide Training and Competency Evaluation Program on-site

Active Resident Council

Organized group of residents that meets regularly to discuss facility policies, quality of life, and activities.

Quality of care over time

These measures show how residents usually do over time at this home, based on health outcomes and preventive care.

High-risk clinical events score Info A composite score based on pressure ulcers, falls with injury, weight loss, walking ability decline, and activities of daily living decline. 10.3
5% worse than New York average

New York average: 9.8

Functional decline score Info A composite score based on activities of daily living decline, walking ability decline, and incontinence. 19.1
5% worse than New York average

New York average: 18.1

Long-stay resident measures
Above average New York avg: 4.3 Info CMS star rating based on long-stay quality measure performance. 5 stars = significantly above average, 1 star = significantly below average.
Need for Help with Daily Activities Increased Info Percent of long-stay residents whose need for help with daily activities has increased 16.0%
In line with New York average

New York average: 16.4%

Walking Ability Worsened Info Percent of long-stay residents whose ability to move independently worsened 9.1%
45% better than New York average

New York average: 16.6%

Low Risk Residents with Bowel/Bladder Incontinence Info Percent of low risk long-stay residents who lose control of their bowels or bladder 32.2%
50% worse than New York average

New York average: 21.4%

Falls with Major Injury Info Percent of long-stay residents experiencing one or more falls with major injury 5.9%
98% worse than New York average

New York average: 3.0%

High Risk Residents with Pressure Ulcers Info Percent of long-stay high risk residents with pressure ulcers 11.8%
64% worse than New York average

New York average: 7.2%

Urinary Tract Infection Info Percent of long-stay residents with a urinary tract infection 0.8%
44% better than New York average

New York average: 1.4%

Lost Too Much Weight Info Percent of long-stay residents who lose too much weight 8.9%
46% worse than New York average

New York average: 6.1%

Depressive Symptoms Info Percent of long-stay residents who have depressive symptoms 11.3%
38% better than New York average

New York average: 18.1%

Antipsychotic Use Info Percent of long-stay residents who received an antipsychotic medication 10.8%
14% better than New York average

New York average: 12.6%

Pneumococcal Vaccine Info Percent of long-stay residents assessed and appropriately given the pneumococcal vaccine 86.7%
5% worse than New York average

New York average: 91.4%

Influenza Vaccine Info Percent of long-stay residents assessed and appropriately given the seasonal influenza vaccine 97.3%
In line with New York average

New York average: 95.2%

Hospitalizations per 1,000 days Info Number of hospitalizations per 1,000 long-stay resident days. 1.22
29% better than New York average

New York average: 1.71

ED visits per 1,000 days Info Number of outpatient emergency department visits per 1,000 long-stay resident days. 3.48
158% worse than New York average

New York average: 1.35

Short-stay resident measures
Below average New York avg: 3.7 Info CMS star rating based on short-stay quality measure performance. 5 stars = much above average, 1 star = much below average.
Pneumococcal Vaccine Info Percent of short-stay residents assessed and appropriately given the pneumococcal vaccine 38.3%
50% worse than New York average

New York average: 76.6%

Antipsychotic medication increase Info Percent of short-stay residents who newly received an antipsychotic medication 2.0%
58% worse than New York average

New York average: 1.3%

Influenza Vaccine Info Percent of short-stay residents assessed and appropriately given the seasonal influenza vaccine 65.2%
17% worse than New York average

New York average: 78.8%

Re-hospitalized after SNF stay Info Percentage of short-stay residents who were re-hospitalized after their nursing home admission. 22.3%
8% worse than New York average

New York average: 20.6%

Emergency department visits Info Percentage of short-stay residents who had an outpatient emergency department visit. 19.4%
100% worse than New York average

New York average: 9.7%

Falls with major injury Info Percentage of SNF residents who experience falls with major injury during their stay. 1.7%
121% worse than New York average

New York average: 0.8%

Ability to care for self at discharge Info Percentage of residents at or above expected ability to care for themselves at discharge. 56.5%
5% better than New York average

New York average: 53.7%

Successful return to home or community Info Rate of successful return to home or community from a skilled nursing facility. 51.2%
In line with New York average

New York average: 50.6%

Guides for Better Senior Living

Care Cost Calculator: See Prices in Your Area

Nursing Home Data Explorer

Don’t Wait Too Long: 7 Red Flag Signs Your Parent Needs Assisted Living Now

The True Cost of Assisted Living in 2025 – And How Families Are Paying For It

Understanding Senior Living Costs: Pricing Models, Discounts & Financial Assistance

Financial Aid for New York Seniors

Get financial aid guidance

Community First Choice Option

NY Medicaid CFCO

Age 65+ or disabled, New York resident, Medicaid- eligible, care need (not necessarily nursing home level).

~$2,829/month (300% FBR, individual).

$30,182 (individual, higher due to NY Medicaid expansion).

Higher asset limit; urban density increases demand.

Expanded In-Home Services for the Elderly Program (EISEP)

NY EISEP

Age 60+, New York resident, at risk of decline but not nursing home level.

~$2,500/month (individual, varies).

$15,000 (individual).

Cost-sharing required above certain income; urban/rural balance.

Senior Citizen Rent Increase Exemption (SCRIE)

NY SCRIE

Age 62+, NYC resident, live in rent-controlled/stabilized apartment, spend >1/3 of income on rent.

$50,000/year (household).

No strict asset cap, but income-focused eligibility.

Limited to NYC’s rent-regulated units; high demand in urban areas.

Senior Citizen Homeowners’ Exemption (SCHE)

NY SCHE

Age 65+, NYC resident, own and live in a 1-3 family home, co-op, or condo.

$58,399/year (household).

No strict asset cap, income-driven eligibility.

Applies only in NYC; excludes large apartment buildings.

New York Foundation for Senior Citizens (NYFSC) Home Sharing Program

NYFSC Home Sharing

One participant must be 60+ (host or guest), NYC resident, able to share living space.

No strict limit, but targets those needing cost relief.

Not applicable; focus on housing need.

Primarily NYC-focused; limited slots due to demand.