Birmingham Green

Senior Communities Home
Overview of Birmingham Green

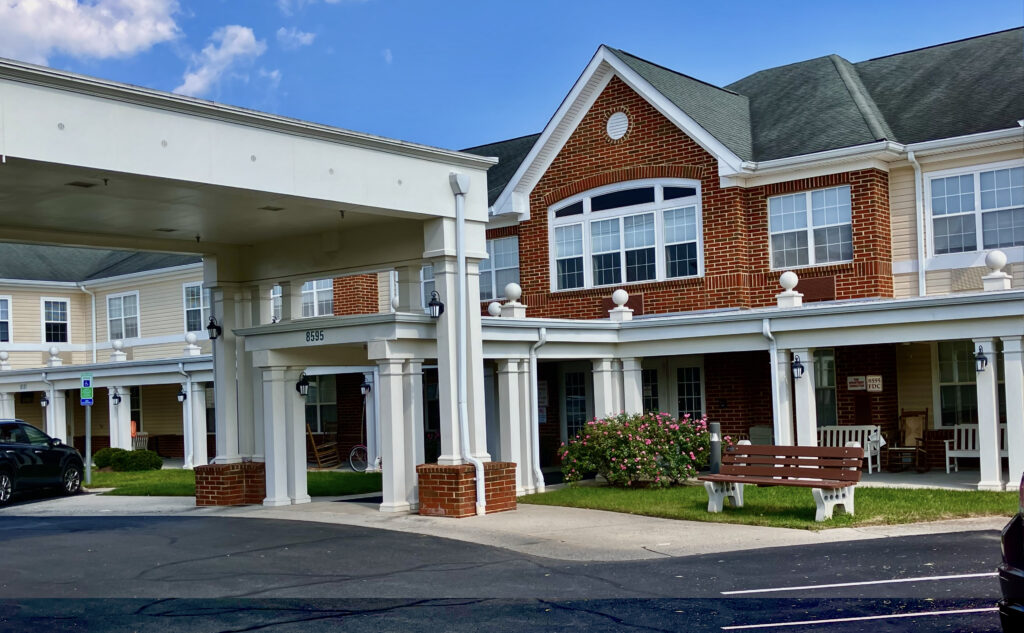
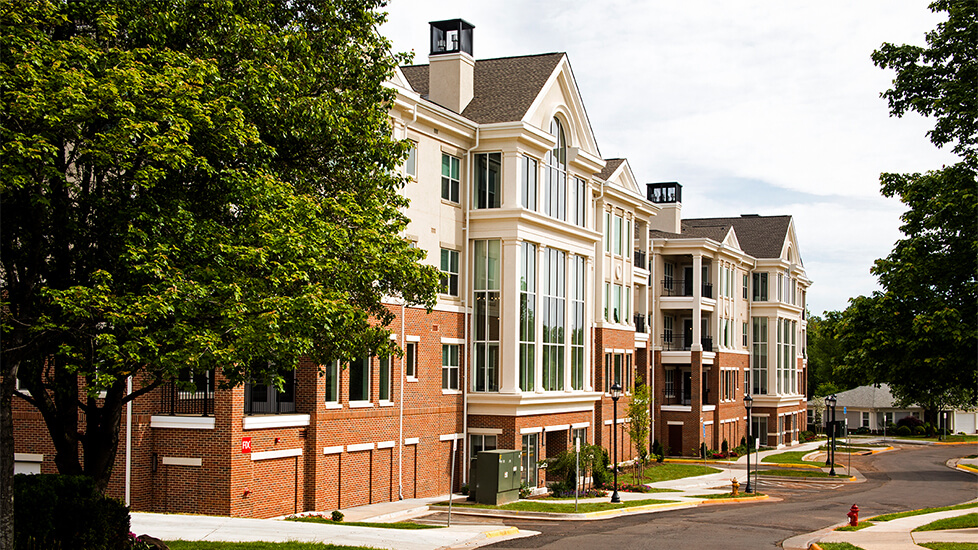
Birmingham Green, an award-winning senior living community located in serene Manassas, VA., has been providing superb senior care for over 90 years, Recognized by Newsweek as one of Virginia’s Top 5 Nursing Homes for 2024, Birmingham Green offers a wide variety of living options including assisted living, skilled care, memory care, and long-term care.

Well-known for its ability to cater to a wide range of senior care needs, at Birmingham Green each resident is cared for based on a personalized care plan, ensuring tailored attention and individual support. The community takes pride in its in-house physical therapy and rehabilitation services which provide residents with convenient access to comprehensive healthcare right within their living environment.

Birmingham Green features two distinct assisted living communities, Willow Oaks and District Home, designed to offer a holistic approach to care. Residents benefit from a compassionate team dedicated to their well-being, ensuring that comfort, dignity, and quality of life are always prioritized.

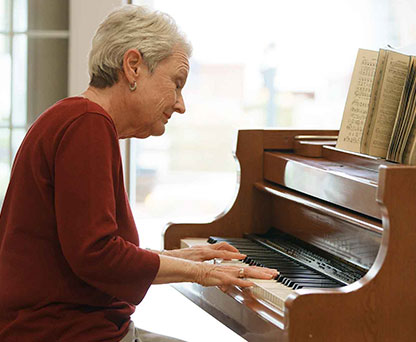
The community boasts a vibrant atmosphere complete with an extensive list of engaging activities curated to promote physical, mental, and emotional well-being. From friendly contests and social gatherings to guest speakers, holiday celebrations, and community outings, Birmingham Green ensures there is always something enjoyable and stimulating for every resident.

Whether seeking assistance with daily activities, specialized memory care, or rehabilitation services, Birmingham Green remains committed to delivering exceptional care and creating a fulfilling senior living experience. Families trust Birmingham Green for its longstanding dedication to senior care excellence and its nurturing environment that promotes independence and happiness among residents.

(703) 257-0935

Managed by Ishmael Koroma

The District Home Administrator

Ishmael Koroma serves as The District Home Administrator at Birmingham Green, overseeing the community's operations and ensuring quality care. His leadership role is central to maintaining the facility's standards and supporting residents and staff alike.

Quality ratings

Measured by Centers for Medicare & Medicaid Services (CMS)

Overall rating Info Official CMS rating based on health inspections, staffing and quality measures.
4/5
Virginia average: 3.0/5
Health Inspection Info Official CMS rating based on deficiencies found during state health inspections.
5/5
Virginia average: 2.8/5
Staffing Info Official CMS rating based on nurse staffing hours per resident per day.
1/5
Virginia average: 2.5/5
Quality Measures Info Official CMS rating based on clinical outcomes for residents.
4/5
Virginia average: 3.8/5

Capacity and availability

Smaller home

May offer a more intimate, personalized care environment.

Total beds 64

This home usually has availability

Lower occupancy suggests more openings may be available.

Lower demand than the Virginia average
Occupancy rate 78.6%
Residents per day (avg) 164
Occupancy rate
78.6%
Residents per day (avg)
164

Who this home usually serves

TYPE OF STAY

Mostly long-term care residents

Most residents stay for extended periods and receive ongoing daily care.

Might be optimal for
Long-term daily care Ongoing support needs

Breakdown by payment type

Medicare

17% of new residents, usually for short-term rehab.

Typical stay 1 - 2 months

Private pay

15% of new residents, often for short stays.

Typical stay 17 - 18 years

Medicaid

69% of new residents, often for long-term daily care.

Typical stay 4 - 5 years

Finances and operations

Governmental home
Other
Home revenue
$35.6M
Surplus of revenue
$3.2M
Governmental home Other
Home revenue
$35,604,388.00
Surplus of revenue
$3,153,261.00
Payroll costs Info The portion of the home's budget spent on staff, including nurses, caregivers, and other employees who support care and operations.
$20.0M
56.2% of revenue
Other operating costs Info All remaining costs needed to run the home, such as food, utilities, building maintenance, supplies and administrative expenses.
$12.5M
Total costs $32.5M
Bed community size
64-bed community
A moderately sized community that may balance personal attention with shared amenities and social activities.
Walk Score
Walk Score: 50 / 100
Moderately walkable. Some errands can be accomplished on foot, with a mix of nearby amenities.

About this community

License Status
Active
Facility Type
Assisted Living Facility
License Expiration
October 20, 2025

Additional licensing details

CMS Certification Number: 495390
Qualification: Three Year | Ambulatory Only | Residential and Assisted Living Care

Ownership & operating entity

Birmingham Green is administrated by Carmen Louise.

Safety & Compliance

Care Services

Accepts Medicaid
Accepts Medicare
Nursing Services
Rehabilitation Services
Memory Care
Skilled Nursing
24-Hour Staffing

Additional Policies & Features

Pets Allowed
Housekeeping: Yes
Linen Service: Yes

Amenities & Lifestyle

Non-smoking in all buildings
On-site daily housekeeping
On-site laundry services
Pets-friendly
Regularly scheduled religious services
Use of manicured grounds
Access to resident fund accounts
Engagement with therapy animals
Access to a wheelchair van
Wellness-centered outings
Therapeutic recreation services

Programs & Activities

Activities
Birmingham Green offers a full calendar of structured activities, engaging outings, and entertainment.
Specific Programs
Health Care, Assisted Living, Rehabilitation, Memory Care, Amenities, Dining, Activities, Volunteer, Admissions
Religious Services
Yes

Dining & Nutrition

Food Description
Birmingham Green offers nutritious meals as part of their services.
Meals Included
Yes

Access & Eligibility

Ways to qualify for care at this community, including accepted programs and payment options.

Medicaid Accepted

This facility is certified for eligible Medicaid services.

Medicare Accepted

This facility is certified for eligible Medicare services.

Payment & Funding Options

Medicaid Medicare

Inspection History

In Virginia, the Department of Social Services (for assisted living facilities) and the Department of Health (for nursing homes) perform the inspections required to maintain state and federal licensing.

5 inspections

1 inspection with violations (20%)

Inspection oversight

Inspector name:Sarah Pearson

5 total citations

Citations indicate regulatory violations. A higher number implies the facility had several areas requiring improvement.

1 violation

Violations indicate regulatory issues. A higher number implies the facility had several areas requiring improvement.

Compare Senior Communities around Virginia

The information below is reported by the Virginia Department of Social Services and Department of Health.
Birmingham Green
SNF

Nursing Homes 24/7 care needed

Manassas
351
No
-
50
MASON, PERRY
78.6%
$27,382,960.00
$19,996,519.00
73%
164.00
4/5
-
5/5
1/5
4/5
15
1
-
-
-8%
Falcons Landing
AL

Assisted Living For seniors needing help with daily tasks but not full-time nursing.

IL

Independent Living For self-sufficient seniors seeking community and minimal assistance.

MC

Memory Care Specialized care for those with Memory Loss, Alzheimer's, or dementia, ensuring safety and support.

SNF

Nursing Homes 24/7 care needed

Potomac Falls
149
No
A+
33
AIR FORCE RETIRED OFFICERS COMMUNITY-WASHINGTON D.C.
71.8%
$37,198,918.00
$17,367,222.00
46.7%
40.10
5/5
6.1584
4/5
5/5
5/5
11
-
-58%
+64%
-16%

Places of interest near Birmingham Green

Address 1.8 miles from city center — 9.14 miles to nearest hospital (Inova Fair Oaks Hospital Emergency Room)

Address 8605 Centreville Rd, Manassas, VA 20110

Calculate Travel Distance to Birmingham Green

Add your location

Address

Health Inspection History

Inspections
Total health inspections 2

State average 4.2


Last Health inspection on Jan 2020

Total health citations 15
Citations per inspection
7.5

Health citations are formal notices following inspections when they fail to comply with safety and care standards.

All 15 citations resulted from standard inspections.

Breakdown of citation severity (last 3 years)
Critical Health citations More info 0
100% better than State average

State average: 0.4


Serious Health citations More info 1
In line with State average

State average: 1

0 critical citations More info State average: 0.4

1 serious citation More info State average: 1

14 moderate citations More info State average: 36.3

0 minor citations More info State average: 0.8
Citations history (last 3 years)
Abuse/Neglect serious citation Jan 31, 2020
Corrected

Pharmacy moderate citation Jan 31, 2020
Corrected

Pharmacy moderate citation Jan 31, 2020
Corrected

Quality of Care moderate citation Jan 31, 2020
Corrected

Facility Characteristics

Source: CMS Long-Term Care Facility Characteristics (Data as of Jan 2026)

Ownership: City/County Government
Resident Census by Payment Source
156 Total Residents
Medicare 1 (0.6%)
Medicaid 155 (99.4%)
Specialized Care Beds
68 Total Specialty Beds
19.4% of Bed Capacity
1
AIDS Care Beds
0.3%
60
Alzheimer's / Dementia Beds
17.1%
1
Dialysis Beds
0.3%
1
Disabled Children / Young Adult Beds
0.3%
1
Head Trauma Beds
0.3%
1
Hospice Beds
0.3%
1
Huntington's Disease Beds
0.3%
1
Ventilator Beds
0.3%
1
Other Specialized Rehab Beds
0.3%
Programs & Services
Residents' Group
Nurse Aide Training
Family Engagement

Active councils help families stay involved in care decisions and facility operations.

Quality of care over time

These measures show how residents usually do over time at this home, based on health outcomes and preventive care.

High-risk clinical events score Info A composite score based on pressure ulcers, falls with injury, weight loss, walking ability decline, and activities of daily living decline. 13.6
34% worse than Virginia average

Virginia average: 10.1

Functional decline score Info A composite score based on activities of daily living decline, walking ability decline, and incontinence. 28.2
43% worse than Virginia average

Virginia average: 19.7

Long-stay resident measures
Need for Help with Daily Activities Increased Info Percent of long-stay residents whose need for help with daily activities has increased 33.2%
97% worse than Virginia average

Virginia average: 16.8%

Walking Ability Worsened Info Percent of long-stay residents whose ability to move independently worsened 29.4%
49% worse than Virginia average

Virginia average: 19.7%

Low Risk Residents with Bowel/Bladder Incontinence Info Percent of low risk long-stay residents who lose control of their bowels or bladder 22.0%
In line with Virginia average

Virginia average: 22.6%

Falls with Major Injury Info Percent of long-stay residents experiencing one or more falls with major injury 1.7%
53% better than Virginia average

Virginia average: 3.6%

High Risk Residents with Pressure Ulcers Info Percent of long-stay high risk residents with pressure ulcers 1.5%
71% better than Virginia average

Virginia average: 5.4%

Urinary Tract Infection Info Percent of long-stay residents with a urinary tract infection 0.9%
40% better than Virginia average

Virginia average: 1.5%

Lost Too Much Weight Info Percent of long-stay residents who lose too much weight 2.4%
59% better than Virginia average

Virginia average: 5.9%

Depressive Symptoms Info Percent of long-stay residents who have depressive symptoms 0.0%
100% better than Virginia average

Virginia average: 14.9%

Antipsychotic Use Info Percent of long-stay residents who received an antipsychotic medication 21.9%
70% worse than Virginia average

Virginia average: 12.9%

Pneumococcal Vaccine Info Percent of long-stay residents assessed and appropriately given the pneumococcal vaccine 92.6%
In line with Virginia average

Virginia average: 91.3%

Influenza Vaccine Info Percent of long-stay residents assessed and appropriately given the seasonal influenza vaccine 96.4%
In line with Virginia average

Virginia average: 94.0%

Short-stay resident measures
Pneumococcal Vaccine Info Percent of short-stay residents assessed and appropriately given the pneumococcal vaccine 64.6%
14% worse than Virginia average

Virginia average: 74.9%

Antipsychotic medication increase Info Percent of short-stay residents who newly received an antipsychotic medication 2.4%
101% worse than Virginia average

Virginia average: 1.2%

Influenza Vaccine Info Percent of short-stay residents assessed and appropriately given the seasonal influenza vaccine 74.3%
In line with Virginia average

Virginia average: 73.6%

Guides for Better Senior Living

Care Cost Calculator: See Prices in Your Area

Nursing Home Data Explorer

Don’t Wait Too Long: 7 Red Flag Signs Your Parent Needs Assisted Living Now

The True Cost of Assisted Living in 2025 – And How Families Are Paying For It

Understanding Senior Living Costs: Pricing Models, Discounts & Financial Assistance

Financial Aid for Virginia Seniors

Get financial aid guidance

Commonwealth Coordinated Care Plus (CCC Plus)

VA Medicaid CCC Plus

Age 65+ or disabled, Virginia resident, Medicaid-eligible, nursing home-level care need.

~$2,829/month (300% FBR, individual).

$2,000 (individual), $3,000 (couple).

Managed care model; high demand in urban areas.

Virginia Respite Care Grant Program

VA Respite Grant

Caregiver of someone 60+, Virginia resident.

~$2,500/month (individual, varies).

$40,000 (individual).

Limited grants; rural/urban balance.

Adult Services Program

Virginia Adult Services (AS)

Age 60+ (or disabled 18+), VA resident, need significant care (2+ ADLs), not Medicaid-eligible.

Varies by locality; typically < ~$2,510/month (200% FPL).

Limited assets (excludes home, car); varies by DSS.

Serves ~5,000 annually; focuses on low-income independence.

Auxiliary Grant Program

Virginia Auxiliary Grant (AG)

Age 65+ (or disabled 18+), VA resident, living in approved ALF/foster care, SSI-eligible or low-income.

~$1,041/month (individual, SSI level + $20 disregard); higher with medical deductions.

$2,000 (individual).

Serves 4,000; personal needs allowance ($90/month).

Medicare Savings Program (MSP)

Virginia Medicare Savings Program

Age 65+ or disabled, VA resident, Medicare Part A/B.

~$2,510/month (QMB), ~$3,380/month (SLMB), ~$3,598/month (QI)—individual.

$9,430 (individual), $14,130 (couple).

Includes Extra Help for Part D; no waitlist.

Energy Assistance Program (EAP)

Virginia Energy Assistance Program

Age 60+ prioritized, VA resident, low-income household.

~$3,970/month (185% FPL).

Not assessed.

Fuel, Crisis, Cooling components; serves ~100,000 households.

Senior Community Service Employment Program (SCSEP)

Virginia SCSEP

Age 55+, unemployed, low-income, VA resident.

~$1,983/month (125% FPL).

Not specified.

Priority for veterans, rural residents; AARP/Goodwill partnership.

VA Aid and Attendance (A&A) and Housebound Benefits

Virginia VA Aid and Attendance/Housebound

Age 65+ or disabled veteran/spouse, VA resident, wartime service, ADL help (A&A) or homebound.

Net income < ~$1,984/month (veteran with dependent, A&A); pension offsets income.

~$155,356 (net worth).

High veteran population; supports rural/urban needs.

Property Tax Relief for the Elderly and Disabled

Virginia Property Tax Relief

Age 65+ or disabled, VA resident, homeowner, income/asset limits vary by locality.

~$50,000-$75,000/year (household, e.g., Fairfax: $72,000; Richmond: $50,000).

Varies (e.g., Fairfax: $400,000 net worth; Richmond: $100,000).

Offered in 90% of localities; saves ~$500-$2,000/year.

Senior Farmers’ Market Nutrition Program (SFMNP)

Virginia SFMNP

Age 60+, VA resident, low-income.

~$2,322/month (185% FPL).

Not assessed.

Vouchers (~$50-$75/season); serves ~15,000 via AAAs.

Who we are

Your Senior Care Partner, Every Step of the Way

We help families find affordable senior communities and unlock same day discounts, Medicaid, and Medicare options tailored to your needs.

Contact us Today
Tour Icon
Planning a tour? Check our touring checklist.
Chat Icon
Thinking of living here? We can help you speak to a current resident