Falcons Landing
Nursing Home, Assisted Living, Independent Living & Memory Care · Potomac Falls, VA
CMS overall rating Info CMS (the Centers for Medicare & Medicaid Services) is the federal agency that rates nursing home quality. Its Overall Rating runs from 1 to 5 stars, combining health inspections, staffing, and quality measures, with inspections weighted most heavily.

Falcons Landing

Nursing Home, Assisted Living, Independent Living & Memory Care · Potomac Falls, VA
CMS overall rating Info CMS (the Centers for Medicare & Medicaid Services) is the federal agency that rates nursing home quality. Its Overall Rating runs from 1 to 5 stars, combining health inspections, staffing, and quality measures, with inspections weighted most heavily.
Calculator: See prices in your area
Falcons Landing accepts Medicare and private pay.

Overview of Falcons Landing

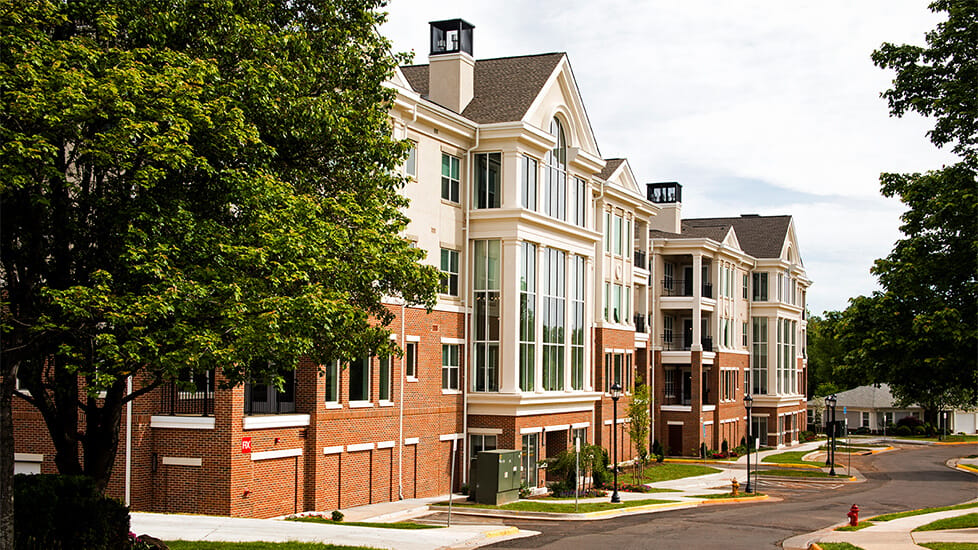
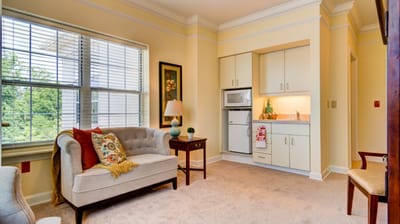
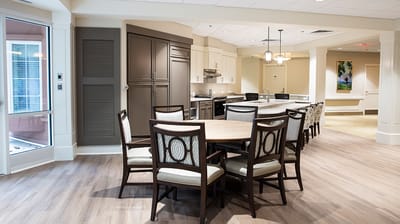
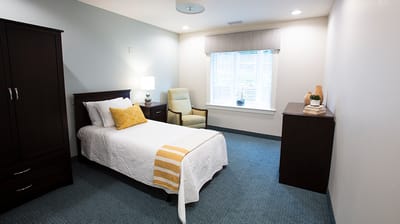
With more than two decades of exceptional service to the senior community and those that have served the nation, Falcon Landing provides premiere independent living, long-term care nursing, short-term rehab, assisted living and memory care in the Potomac Falls area. Committed to the utmost care for veterans and qualified former government employees through the Falcons Landing Life Plan Community, and the general public, Falcons Landing is a place to rest your wings.

A testament to the promise of quality care that Falcons Landing takes pride in, as a not-for-profit senior living community, all funds are invested back into the continuous upgrading and maintenance of the community. This ensures that amenities and services such as living quarters, wellness programs, and dining experiences, are always at their very best.

Quality ratings

Measured by Centers for Medicare & Medicaid Services (CMS)

Overall rating Info The Overall CMS Rating combines results from health inspections, staffing levels and quality measures. Health inspections carry the most weight. Staffing and quality scores can increase or decrease the final rating based on performance compared to state and national standards.
Health Inspection Info Based on the results of the facility's three most recent standard inspections and any complaint investigations. CMS reviews the number, scope, and severity of deficiencies, with more recent findings weighted more heavily.
Staffing Info Measures average nursing staff hours per resident per day, including Registered Nurses (RNs) and total nursing staff. Ratings are adjusted based on the level of care residents require and are compared to state and national benchmarks.
Quality Measures Info Based on clinical and physical health indicators reported to CMS, such as hospital readmissions, falls, pressure ulcers, and improvements in mobility. These measures reflect how well residents' health needs are being managed.

Staffing hours breakdown

Info Daily nursing hours per resident by staff type, reported to CMS. Higher is generally better — compare this facility to state and national averages to see where staffing stands.

Hours per resident per day — compared to state averages

Total nursing care / resident Info Total adjusted nursing hours per resident per day, combining RN, LPN, and aide time. CMS adjusts this for case-mix so facilities can be fairly compared.
6h 10m per day
Rank #6 / 89Nurse hours — State benchmarkedThis home is ranked 6th out of 89 homes in Virginia. Shows adjusted nurse hours per resident per day benchmarked to the Virginia average, with a ranking across 89 Virginia facilities. More hours mean more direct care. The national average is about 3.5 hrs; below 3.0 is a red flag.Rankings are based only on facilities in Virginia that report data for that category. Facilities without available data are excluded from the ranking.Click the rank badge to see the full State ranking.Click here to see the full State ranking.
vs avg
Staff type Hours / Day / Resident vs state avg
Registered Nurse (RN) Info RNs hold the highest nursing license and can assess residents, interpret test results, and direct care plans. More RN hours per day often signals stronger clinical oversight and faster response to health changes. 33m per day
LPN / LVN Info Licensed Practical Nurses (LPNs) or Licensed Vocational Nurses (LVNs) deliver routine hands-on care — medication administration, wound dressing, and monitoring vital signs. They work under RN supervision and make up a large share of daily bedside care. 1h 6m per day
Nurse Aide Info Certified Nurse Aides (CNAs) provide the most direct day-to-day assistance: bathing, dressing, feeding, and mobility. Nurse aide hours are typically the largest staffing category and directly affect residents' quality of life. 3h 8m per day
Weekend Total Nursing Info Combined nursing hours (RN + LPN + Nurse Aide) per resident per day on weekends. Staffing often drops on weekends — this figure reveals whether the facility maintains adequate coverage outside of weekday hours. 5h 10m per day
Physical Therapist Info Hours per resident per day provided by licensed Physical Therapists (PTs) or PT Assistants. PT services help residents recover mobility after injury or illness and are especially important for post-acute (short-stay) rehabilitation. 3m per day
Weekend RN Info Registered nurse hours specifically on weekends. Facilities sometimes reduce RN presence on Saturdays and Sundays — a low weekend RN figure compared to weekday hours can indicate reduced clinical oversight when most administrative staff are absent. 26m per day

Capacity and availability

This home usually has availability

Lower occupancy than the state average
Occupancy rate
71.8% Rank #164 / 314Occupancy rate — State benchmarkedThis home is ranked 164th out of 314 homes in Virginia. Shows this facility's occupancy rate versus the Virginia average, with its Statewide rank out of 314. Higher occupancy signals strong local demand and financial stability.Rankings are based only on facilities in Virginia that report data for that category. Facilities without available data are excluded from the ranking.Click the rank badge to see the full State ranking.Click here to see the full State ranking.
Avg. Length of Stay
66 days
Bed community size
60-bed community Rank #273 / 371Bed count — State benchmarkedThis home is ranked 273rd out of 371 homes in Virginia. Shows this facility's certified or reported bed count compared to other Virginia facilities. Larger communities may offer more amenities, programs, and on-site services for residents and families.Rankings are based only on facilities in Virginia that report data for that category. Facilities without available data are excluded from the ranking.Click the rank badge to see the full State ranking.Click here to see the full State ranking.
A moderately sized community that may balance personal attention with shared amenities and social activities.
Years in operation
41 years in operation
A longer operating history, which may indicate experience navigating regulations and delivering ongoing care.
Walk Score
Walk Score: 33 / 100 Rank #282 / 449Walk Score — State benchmarkedThis home is ranked 282nd out of 449 homes in Virginia. Shows how walkable this facility's neighborhood is compared to the average Walk Score across Virginia facilities. Higher scores benefit residents, families, and staff.Rankings are based only on facilities in Virginia that report data for that category. Facilities without available data are excluded from the ranking.Click the rank badge to see the full State ranking.Click here to see the full State ranking.
Somewhat walkable. A few nearby services may be reachable on foot, but most trips require transportation.
BBB Rating
BBB Rating: A+ (Not Accredited)
An independent rating from the Better Business Bureau based on factors such as complaint history, transparency, and business practices.
How BBB ratings work

Staffing

Key information about the people who lead and staff this community.

Leadership

ContactMs. Leah Daily, Sales and Marketing Manager

Contact Falcons Landing

Health Inspection History

Inspections since 2018
Total health inspections 3

State average N/A


Last Health inspection on May 2023

Total health citations
11 Rank #7 / 90Health citations — State benchmarkedThis home is ranked 7th out of 90 homes in Virginia. Shows this facility's total health deficiency citations benchmarked to the Virginia State average, with a ranking across all 90 VA facilities. Lower citation counts earn a better rank.Rankings are based only on facilities in Virginia that report data for that category. Facilities without available data are excluded from the ranking.Click the rank badge to see the full State ranking.Click here to see the full State ranking.

State average N/A

Citations per inspection
3.67 Rank #9 / 90Citations per inspection — State benchmarkedThis home is ranked 9th out of 90 homes in Virginia. Shows average deficiency citations per CMS inspection for this facility versus the Virginia mean across 90 facilities with citation data. Lower is better.Rankings are based only on facilities in Virginia that report data for that category. Facilities without available data are excluded from the ranking.Click the rank badge to see the full State ranking.Click here to see the full State ranking.

State average N/A


Health citations are formal notices following inspections when they fail to comply with safety and care standards.

All 11 citations resulted from standard inspections.

Breakdown of citation severity (last 8 years)
Critical health citations
0
In line with State average

State average: N/A


Serious health citations
0
In line with State average

State average: N/A

0 critical citations State average: N/A

0 serious citations State average: N/A

9 moderate citations State average: N/A

2 minor citations State average: N/A
Citations history (last 8 years)
Infection Control moderate citation May 04, 2023
Corrected

Infection Control moderate citation May 04, 2023
Corrected

Nursing Services minor citation May 04, 2023
Corrected

Pharmacy moderate citation May 04, 2023
Corrected

Staffing Data

Reporting period: October 1 – December 31, 2025 (Q4 2025). Source: CMS Payroll-Based Journal report.

Total staff 68
Employees 55
Contractors 13
Staff to resident ratio 1.51 : 1
0% compared with State average

State average ratio: 0 : 0

Avg staff/day 26
Average shift 10.7 hours
0% compared with State average

State average: 0 hours

Total staff hours (quarter) 25,627

Nursing staff breakdown

Q4 2025 · Oct 1 – Dec 31 More info This data comes from the CMS Payroll-Based Journal report covering October 1 – December 31, 2025.
Registered Nurse

Manages medical care and health needs.

RN Staff Info All 2 RN Staff are full-time employees. No contractors work on this role. 2
Average shift length Info Average shift length. Calculated as total hours divided by days worked and average staff per day. 12.4 hours
Licensed Practical Nurse

Assists with medical care and medications.

LPN Staff Info 12 total: 10 full-time employees and 2 contractors. 12
Average shift length Info Average shift length. Calculated as total hours divided by days worked and average staff per day. 12 hours
Certified Nursing Assistant

Helps with daily care and mobility.

CNA Staff Info 34 total: 26 full-time employees and 8 contractors. 34
Average shift length Info Average shift length. Calculated as total hours divided by days worked and average staff per day. 11.8 hours

Contractor staffing

Q4 2025 · Oct 1 – Dec 31 More info This data comes from the CMS Payroll-Based Journal report covering October 1 – December 31, 2025.

Total hours from contractors

11.1%

2,848 contractor hours this quarter

Certified Nursing Assistant: 8 Licensed Practical Nurse: 2 Other Physician: 1 Respiratory Therapy Technician: 1 Occupational Therapy Assistant: 1

Staff by category

Q4 2025 · Oct 1 – Dec 31 More info This data comes from the CMS Payroll-Based Journal report covering October 1 – December 31, 2025.
Certified Nursing Assistant 26 8 34 13,991 92 100% 11.8
Licensed Practical Nurse 10 2 12 4,180 92 100% 12
Other Dietary Services Staff 2 0 2 1,024 83 90% 8
Registered Nurse 2 0 2 992 63 68% 12.4
Clinical Nurse Specialist 2 0 2 950 88 96% 9.8
RN Director of Nursing 2 0 2 736 64 70% 8.3
Physical Therapy Assistant 2 0 2 704 71 77% 8.3
Nurse Practitioner 1 0 1 488 61 66% 8
Feeding Assistant 1 0 1 488 61 66% 8
Occupational Therapy Aide 1 0 1 488 61 66% 8
Administrator 1 0 1 448 56 61% 8
Dietitian 1 0 1 424 53 58% 8
Respiratory Therapy Technician 1 1 2 233 30 33% 7.8
Medical Director 1 0 1 232 58 63% 4
Qualified Social Worker 1 0 1 121 17 18% 7.1
Other Physician 0 1 1 49 14 15% 3.5
Speech Language Pathologist 1 0 1 48 6 7% 8
Occupational Therapy Assistant 0 1 1 32 6 7% 5.3
34 Certified Nursing Assistant
% of Days 100%
12 Licensed Practical Nurse
% of Days 100%
2 Other Dietary Services Staff
% of Days 90%
2 Registered Nurse
% of Days 68%
2 Clinical Nurse Specialist
% of Days 96%
2 RN Director of Nursing
% of Days 70%
2 Physical Therapy Assistant
% of Days 77%
1 Nurse Practitioner
% of Days 66%
1 Feeding Assistant
% of Days 66%
1 Occupational Therapy Aide
% of Days 66%
1 Administrator
% of Days 61%
1 Dietitian
% of Days 58%
2 Respiratory Therapy Technician
% of Days 33%
1 Medical Director
% of Days 63%
1 Qualified Social Worker
% of Days 18%
1 Other Physician
% of Days 15%
1 Speech Language Pathologist
% of Days 7%
1 Occupational Therapy Assistant
% of Days 7%

Penalties and fines

Federal penalties imposed by CMS for regulatory violations, including civil money penalties (fines) and denials of payment for new Medicare/Medicaid admissions.

Source: CMS Penalties Database

No penalties in the past 3 years

No civil money penalties or payment denials were reported in the last 3 years.

Quality of care over time

These measures show how residents usually do over time at this home, based on health outcomes and preventive care.

High-risk clinical events score Info A composite score based on pressure ulcers, falls with injury, weight loss, walking ability decline, and activities of daily living decline. 10.2
In line with State average

State average: 10.1

Functional decline score Info A composite score based on activities of daily living decline, walking ability decline, and incontinence. 16.7
16% better than State average

State average: 19.7

Long-stay resident measures
Need for Help with Daily Activities Increased Info Percent of long-stay residents whose need for help with daily activities has increased 16.2%
In line with State average

State average: 16.8%

Walking Ability Worsened Info Percent of long-stay residents whose ability to move independently worsened 20.5%
In line with State average

State average: 19.7%

Low Risk Residents with Bowel/Bladder Incontinence Info Percent of low risk long-stay residents who lose control of their bowels or bladder 13.3%
41% better than State average

State average: 22.6%

Falls with Major Injury Info Percent of long-stay residents experiencing one or more falls with major injury 1.5%
59% better than State average

State average: 3.6%

High Risk Residents with Pressure Ulcers Info Percent of long-stay high risk residents with pressure ulcers 4.5%
17% better than State average

State average: 5.4%

Urinary Tract Infection Info Percent of long-stay residents with a urinary tract infection 0.0%
100% better than State average

State average: 1.5%

Lost Too Much Weight Info Percent of long-stay residents who lose too much weight 8.5%
45% worse than State average

State average: 5.9%

Depressive Symptoms Info Percent of long-stay residents who have depressive symptoms 0.0%
100% better than State average

State average: 14.9%

Antipsychotic Use Info Percent of long-stay residents who received an antipsychotic medication 6.6%
48% better than State average

State average: 12.9%

Pneumococcal Vaccine Info Percent of long-stay residents assessed and appropriately given the pneumococcal vaccine 100.0%
10% better than State average

State average: 91.3%

Influenza Vaccine Info Percent of long-stay residents assessed and appropriately given the seasonal influenza vaccine 100.0%
6% better than State average

State average: 94.0%

Short-stay resident measures
Pneumococcal Vaccine Info Percent of short-stay residents assessed and appropriately given the pneumococcal vaccine 99.5%
33% better than State average

State average: 74.9%

Antipsychotic medication increase Info Percent of short-stay residents who newly received an antipsychotic medication 0.0%
100% better than State average

State average: 1.2%

Influenza Vaccine Info Percent of short-stay residents assessed and appropriately given the seasonal influenza vaccine 100.0%
36% better than State average

State average: 73.6%

Breakdown by payment type

Medicare

56% of new residents, usually for short-term rehab.

Typical stay 24 days

Private pay

44% of new residents, often for short stays.

Typical stay 9 - 10 months

Facility Characteristics

Source: CMS Long-Term Care Facility Characteristics (Data as of Jan 2026)

Total residents 45
Medicare
9
20% of residents
Private pay or other
36
80% of residents
Programs & Services
Residents Group

Residents meet regularly to discuss policies, care quality, and activities

Nurse Aide Training

State-approved Nurse Aide Training and Competency Evaluation Program on-site

CCRC

Part of a Continuing Care Retirement Community offering multiple care levels

Active Resident Council

Organized group of residents that meets regularly to discuss facility policies, quality of life, and activities.

Finances and operations

Based on CMS SNF Cost Report for fiscal year ending in 12/2023.

Nonprofit
Nonprofit Corporation
Net patient revenue Info Net patient revenue — what the home actually collects for resident care, after contractual allowances, bad debt and discounts are subtracted from its gross charges (CMS cost report, Worksheet G-3). It covers resident care only; money the home earns from other sources is shown separately as "Other income."
$37.2M
Net patient income Info Net patient income: net patient revenue minus the home's total operating expenses. A positive figure means it earns more from resident care than it spends to deliver it; a negative figure means the opposite. It excludes non-operating "other income."
-$1.6M
Nonprofit Nonprofit Corporation
Net patient revenue Info Net patient revenue — what the home actually collects for resident care, after contractual allowances, bad debt and discounts are subtracted from its gross charges (CMS cost report, Worksheet G-3). It covers resident care only; money the home earns from other sources is shown separately as "Other income."
$37.2M Rank #14 / 89Revenue — State benchmarkedThis home is ranked 14th out of 89 homes in Virginia. Shows this facility's annual revenue compared to the Virginia average. Higher revenue generally means more resources for staffing and capital — read alongside Payroll %.Rankings are based only on facilities in Virginia that report data for that category. Facilities without available data are excluded from the ranking.Click the rank badge to see the full State ranking.Click here to see the full State ranking.
Net patient income Info Net patient income: net patient revenue minus the home's total operating expenses. A positive figure means it earns more from resident care than it spends to deliver it; a negative figure means the opposite. It excludes non-operating "other income."
-$1.6M
Other income Info Money the home earns outside of resident care — such as investments, grants, rentals and other non-operating sources (CMS cost report, Worksheet G-3). It is tracked separately from net patient revenue: it is not part of that figure, and it is not included in net patient income.
$2.8M
Payroll costs Info Staff salaries plus wage-related costs — benefits such as payroll taxes, health insurance and retirement — from the home's own accounting records (CMS cost report, Worksheet A). Contract or agency labor is counted separately, under other operating costs. Rank #7 / 89Payroll — State benchmarkedThis home is ranked 7th out of 89 homes in Virginia. Shows total annual staff payroll benchmarked to the Virginia average. Higher payroll investment relative to peers often signals better staffing and less reliance on cheaper contract labor.Rankings are based only on facilities in Virginia that report data for that category. Facilities without available data are excluded from the ranking.Click the rank badge to see the full State ranking.Click here to see the full State ranking.
$21.0M 56.5% of net patient revenue Info Payroll as a share of revenue: staff salaries and wage-related benefits divided by net patient revenue. A higher figure means more of each revenue dollar goes to staff pay. Rank #21 / 89Payroll % — State benchmarkedThis home is ranked 21st out of 89 homes in Virginia. Shows payroll as a percentage of revenue versus the Virginia average. Well-run Virginia facilities typically land around 51–60% — the top third Statewide. Below 25% may signal understaffing or heavy agency use — read with Staffing ratings.Rankings are based only on facilities in Virginia that report data for that category. Facilities without available data are excluded from the ranking.Click the rank badge to see the full State ranking.Click here to see the full State ranking.
Other operating costs Info Everything it costs to run the home apart from payroll — food, utilities, supplies, maintenance, contract labor and administration. Calculated as total operating expense minus payroll (staff salaries and wage-related benefits).
$17.8M
Total costs Info The home's total operating expense for the year — all the costs of running it, salaries included (CMS cost report, Worksheet G-3).
$38.8M

Who this home usually serves

TYPE OF STAY

Mostly short-term rehab stays

Most residents typically stay for a few weeks or months before returning home or moving on.

Most new residents arrive under Medicare (56% of admissions), and a typical Medicare stay runs around 24 days.

Admissions
253 total

Coverage residents most often arrive under.

Medicare 56%
Private pay 44%
Discharges
298 total

Coverage residents most often leave under.

Medicare 58%
Private pay 42%

Places of interest near Falcons Landing

Address 1.6 miles from city center Info Estimated distance in miles from Potomac Falls's city center to Falcons Landing's address, calculated via Google Maps. — 6.01 miles to nearest hospital (Reston Hospital Center)

Calculate Travel Distance to Falcons Landing

Add your location

Address

Compare Nursing Homes around the area

The information below is reported by the Virginia Department of Social Services and Department of Health.

Falcons Landing
NH
AL
IL
MC
Potomac Falls - 60 A+ 33 -
The Summit
NH
AL
HC
IL
MC
Lynchburg (Enterprise Drive) - 50 A+ 56 1 Bed / 2 Bed
Brandermill Woods Healthcare Communities
NH
AL
IL
MC
Midlothian (Brandermill) - 91 - 4 Apartment / Cottage / 1 Bed / 2 Bed / 3 Bed
The Blake at Charlottesville
NH
AL
MC
RC
Charlottesville - 130 - 28 Studio / 1 Bed / 2 Bed
The Devonshire Senior Living
NH
AL
IL
MC
RC
Hampton (Coliseum Central) - 61 - 63 Studio / 1 Bed / 2 Bed

Frequently Asked Questions about Falcons Landing

Is Falcons Landing in a walkable area?

Falcons Landing has a walk score of 33. Somewhat walkable. A few nearby services may be reachable on foot, but most trips require transportation.

What is the occupancy rate at Falcons Landing?

Falcons Landing's occupancy is 71.8%.

Does Falcons Landing operate as a for-profit or non-profit?

Falcons Landing is registered as a non-profit in VA.

Are there photos of Falcons Landing?

Yes — there are 7 photos of Falcons Landing in the photo gallery on this page.

What is the address of Falcons Landing?

Falcons Landing is located at 20522 Falcons Landing Cir, Potomac Falls, VA 20165.

What is the phone number of Falcons Landing?

(703) 404-5100 will put you in contact with the team at Falcons Landing.

Is Falcons Landing Medicare or Medicaid certified?

Yes — Falcons Landing is a CMS-certified provider of Medicare and Medicaid.

Guides for Better Senior Living

Care Cost Calculator: See Prices in Your Area

Nursing Home Data Explorer

Don’t Wait Too Long: 7 Red Flag Signs Your Parent Needs Assisted Living Now

The True Cost of Assisted Living in 2025 – And How Families Are Paying For It

Understanding Senior Living Costs: Pricing Models, Discounts & Financial Assistance