


Total health inspections
5
Ohio average 6.7
Last Health inspection on Sep 2024
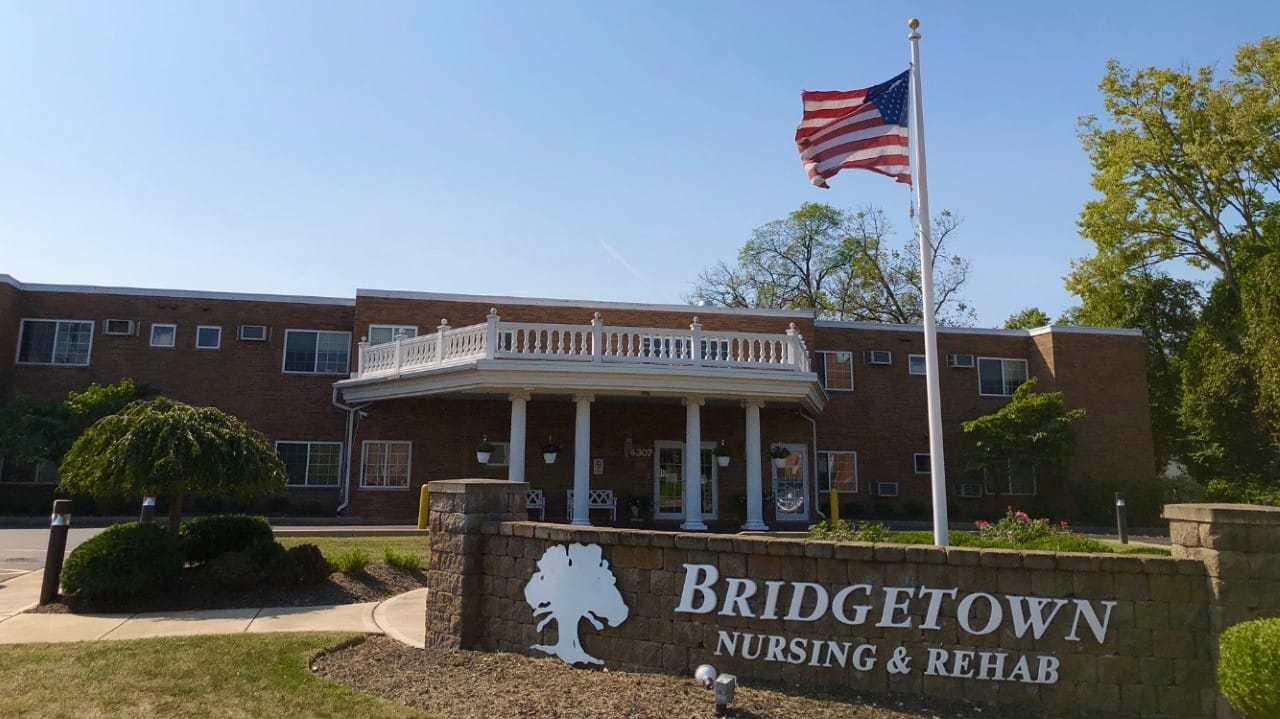


Experience a wonderful retirement at the exceptional senior living community of Bridgetown Nursing and Rehabilitation in Cincinnati, OH. Focusing on memory care, this community provides exemplary nursing-level dementia care, guided by compassion, respect, and a commitment to enhancing the quality of life for each resident.
At Bridgetown Nursing & Rehabilitation, the dedicated and compassionate team fosters a nurturing environment where residents find comfort, joy, and a profound sense of belonging throughout their dementia journey. The community is committed to offering services such as individualized care, compassionate communication, safety and security, and holistic well-being. With a home-like atmosphere and family partnerships, residents engage in meaningful activities that enrich their lives. This community strives to be a beacon of support and understanding, enhancing the lives of those entrusted to its care.
Staffing hours
![]() Daily nursing hours per resident by staff type, reported to CMS. Higher is generally better — compare this facility to state and national averages to see where staffing stands.
Daily nursing hours per resident by staff type, reported to CMS. Higher is generally better — compare this facility to state and national averages to see where staffing stands.
Hours per resident per day vs Ohio averages
Total nursing care
![]() This home is ranked 86th out of 182 homes in Ohio for nurse hours. Total adjusted nursing hours per resident per day, combining RN, LPN, and aide time. CMS adjusts this for case-mix so facilities can be fairly compared.
This home is ranked 86th out of 182 homes in Ohio for nurse hours. Total adjusted nursing hours per resident per day, combining RN, LPN, and aide time. CMS adjusts this for case-mix so facilities can be fairly compared.
3h 28m
At state avg1 of 6 metrics below state avg
In Ohio, the Department of Health, Bureau of Survey and Certification conducts unannounced onsite inspections to evaluate the quality of care and environment in all licensed facilities.
Citations
| This Facility | OH Average | vs. OH Avg |
|---|---|---|---|
|
Total citations
| 30 | 2 | This facility has 1400% more total citations than a typical Ohio nursing home (30 vs. OH avg 2).↑ 1400% worse |
|
Citations per inspection
| 6.0 | 0.3 | This facility has 1900% more citations per inspection than a typical Ohio nursing home (6 vs. OH avg 0.3).↑ 1900% worse |
Inspections
| This Facility | OH Average | vs. OH Avg |
|---|---|---|---|
|
Total inspections
| 5 | 6 | This facility has had 17% fewer total inspections than the Ohio average (5 vs. OH avg 6). More inspections can mean more regulatory scrutiny rather than worse care.↓ 17% fewer |
Ohio average 6.7
Last Health inspection on Sep 2024
Ohio average 30.9
Ohio average 4.59
Health citations are formal notices following inspections when they fail to comply with safety and care standards.
18 of 21 citations resulted from standard inspections; and 3 of 21 resulted from complaint investigations.
Ohio average: 0.3
Ohio average: 0.9
Reporting period: October 1 – December 31, 2025 (Q4 2025). Source: CMS Payroll-Based Journal report.
Manages medical care and health needs.
Assists with medical care and medications.
Helps with daily care and mobility.
Total hours from contractors
1,483 contractor hours this quarter
| Certified Nursing Assistant | 25 | 37 | 62 | 8,933 | 92 | 100% | 9 |
| Licensed Practical Nurse | 7 | 8 | 15 | 3,103 | 91 | 99% | 9.5 |
| Registered Nurse | 7 | 4 | 11 | 2,214 | 92 | 100% | 8.2 |
| Other Dietary Services Staff | 2 | 0 | 2 | 623 | 69 | 75% | 7.4 |
| Administrator | 1 | 0 | 1 | 528 | 66 | 72% | 8 |
| Nurse Practitioner | 1 | 0 | 1 | 528 | 66 | 72% | 8 |
| Respiratory Therapy Technician | 1 | 0 | 1 | 304 | 63 | 68% | 4.8 |
| Physical Therapy Aide | 1 | 0 | 1 | 32 | 26 | 28% | 1.2 |
| Qualified Social Worker | 1 | 0 | 1 | 23 | 15 | 16% | 1.5 |
| Physical Therapy Assistant | 1 | 0 | 1 | 12 | 13 | 14% | 0.9 |
Federal penalties imposed by CMS for regulatory violations, including civil money penalties (fines) and denials of payment for new Medicare/Medicaid admissions.
Source: CMS Penalties Database
No penalties in the past 3 years
No civil money penalties or payment denials were reported in the last 3 years.
These measures show how residents usually do over time at this home, based on health outcomes and preventive care.
Ohio average: 5.8
Ohio average: 12.7
Ohio average: 6.8%
Ohio average: 8.9%
Ohio average: 22.0%
Ohio average: 3.4%
Ohio average: 3.9%
Ohio average: 0.5%
Ohio average: 6.2%
Ohio average: 24.0%
Ohio average: 8.4%
Ohio average: 92.4%
Ohio average: 94.5%
Ohio average: 78.0%
Ohio average: 1.3%
Quality measures are calculated from Minimum Data Set (MDS) assessments. For most measures, lower percentages indicate better care quality.
17% of new residents, usually for short-term rehab.
38% of new residents, often for short stays.
45% of new residents, often for long-term daily care.
Source: CMS Long-Term Care Facility Characteristics (Data as of Jan 2026)
Residents meet regularly to discuss policies, care quality, and activities
Organized group of residents that meets regularly to discuss facility policies, quality of life, and activities.
Data sourced from CMS Long-Term Care Facility Characteristics quarterly report. Payer mix reflects the current resident census by primary payment source.
Historical financial and operational data for Bridgetown Nursing and Rehabilitation from 2012–2023, based on CMS SNF Cost Reports.
Key figures below are for fiscal year ending in 12/2023.
Based on CMS SNF Cost Report for fiscal year ending in 12/2023.
No pets allowed
Building Type: Two-story
Most residents stay for extended periods and receive ongoing daily care.
New residents most often arrive under Medicaid (45% of admissions), and a typical Medicaid stay runs around 1 years.
Coverage residents most often arrive under.
Coverage residents most often leave under.
![]() 7.0 miles from city center
7.0 miles from city center
![]() Estimated distance in miles from Cincinnati's city center to Bridgetown Nursing and Rehabilitation's address, calculated via Google Maps.
— 2.11 miles to nearest hospital (Mercy Health - West Hospital)
Estimated distance in miles from Cincinnati's city center to Bridgetown Nursing and Rehabilitation's address, calculated via Google Maps.
— 2.11 miles to nearest hospital (Mercy Health - West Hospital)
Add your location
Info below is compiled from CMS reports & the OH Dept. of Health, senior community websites & trusted data sources such as Walk Score & BBB.
Communities are listed from highest to lowest based on our ranking methodology.
| Alois Alzheimer Center | NH HOS MC PC RC SNF | Cincinnati (Greenhills) | 93
Facility
93
OH AVG
75
Rank
#92 / 309 |
82.8%
Facility
82.8%
OH AVG
81.7
Rank
#86 / 138 | +1% | 4.12
Facility
4.12
OH AVG
3.54
Rank
#36 / 182 | -31% | +16% | $0
Facility
$0
OH AVG
$74.0k
Rank
#1 / 183 | 7
Facility
7
OH AVG
30.9
Rank
#14 / 183 | 3.5
Facility
3.5
OH AVG
4.6
Rank
#58 / 183 | - | 77 | - |
49
Facility
49
OH AVG
40
Rank
#263 / 704 | Boymel Operations Holdings Co LLC | $7.5MFiscal year ending 12/2023
Facility
$7.5MFiscal year ending 12/2023
OH AVG
$10.1M
Rank
#136 / 183 | $4.6MFiscal year ending 12/2023
Facility
$4.6MFiscal year ending 12/2023
OH AVG
$3.9M
Rank
#111 / 183 | 61.4%Fiscal year ending 12/2023
Facility
61.4%Fiscal year ending 12/2023
OH AVG
40.2%
Rank
#21 / 183 | 366489 | ||||
| Twin Towers | NH AL IL MC SNF | Cincinnati (College Hill) | 231
Facility
231
OH AVG
75
Rank
#1 / 309 |
31.2%
Facility
31.2%
OH AVG
81.7
Rank
#138 / 138 | -62% | 5.44
Facility
5.44
OH AVG
3.54
Rank
#8 / 182 | -14% | +54% | $0
Facility
$0
OH AVG
$74.0k
Rank
#1 / 183 | 13
Facility
13
OH AVG
30.9
Rank
#35 / 183 | 4.3
Facility
4.3
OH AVG
4.6
Rank
#99 / 183 | - | 72 | - |
31
Facility
31
OH AVG
40
Rank
#432 / 704 | Douglas Burgess | $10.7MFiscal year ending 12/2023
Facility
$10.7MFiscal year ending 12/2023
OH AVG
$10.1M
Rank
#38 / 183 | $5.8MFiscal year ending 12/2023
Facility
$5.8MFiscal year ending 12/2023
OH AVG
$3.9M
Rank
#63 / 183 | 54.5%Fiscal year ending 12/2023
Facility
54.5%Fiscal year ending 12/2023
OH AVG
40.2%
Rank
#163 / 183 | 366023 | ||||
| Beechwood Home | NH HOS SNF | Cincinnati (Evanston) | 80
Facility
80
OH AVG
75
Rank
#134 / 309 |
90.3%
Facility
90.3%
OH AVG
81.7
Rank
#41 / 138 | +10% | 4.61
Facility
4.61
OH AVG
3.54
Rank
#14 / 182 | -18% | +30% | $0
Facility
$0
OH AVG
$74.0k
Rank
#1 / 183 | 13
Facility
13
OH AVG
30.9
Rank
#35 / 183 | 3.3
Facility
3.3
OH AVG
4.6
Rank
#51 / 183 | - | 72 | - |
56
Facility
56
OH AVG
40
Rank
#186 / 704 | William Baechtold | $8.1MFiscal year ending 12/2023
Facility
$8.1MFiscal year ending 12/2023
OH AVG
$10.1M
Rank
#32 / 183 | $6.6MFiscal year ending 12/2023
Facility
$6.6MFiscal year ending 12/2023
OH AVG
$3.9M
Rank
#38 / 183 | 81.2%Fiscal year ending 12/2023
Facility
81.2%Fiscal year ending 12/2023
OH AVG
40.2%
Rank
#116 / 183 | 365445 | ||||
| Deupree House | NH AL IL MC | Cincinnati (Hyde Park) | 24
Facility
24
OH AVG
75
Rank
#285 / 309 |
82.9%
Facility
82.9%
OH AVG
81.7
Rank
#85 / 138 | +1% | 7.25
Facility
7.25
OH AVG
3.54
Rank
#1 / 182 | -4% | +105% | $0
Facility
$0
OH AVG
$74.0k
Rank
#1 / 183 | 12
Facility
12
OH AVG
30.9
Rank
#29 / 183 | 4.0
Facility
4.0
OH AVG
4.6
Rank
#81 / 183 | - | 20 | - |
44
Facility
44
OH AVG
40
Rank
#322 / 704 | Emerson Stambaugh | $3.8MFiscal year ending 12/2023
Facility
$3.8MFiscal year ending 12/2023
OH AVG
$10.1M
Rank
#163 / 183 | $2.7MFiscal year ending 12/2023
Facility
$2.7MFiscal year ending 12/2023
OH AVG
$3.9M
Rank
#158 / 183 | 70.7%Fiscal year ending 12/2023
Facility
70.7%Fiscal year ending 12/2023
OH AVG
40.2%
Rank
#40 / 183 | 366386 | ||||
| Bridgetown Nursing and Rehabilitation | NH SNF | Cincinnati | 55
Facility
55
OH AVG
75
Rank
#196 / 309 |
74.5%
Facility
74.5%
OH AVG
81.7
Rank
#110 / 138 | -9% | 3.46
Facility
3.46
OH AVG
3.54
Rank
#86 / 182 | +25% | -2% | $0
Facility
$0
OH AVG
$74.0k
Rank
#1 / 183 | 21
Facility
21
OH AVG
30.9
Rank
#63 / 183 | 4.2
Facility
4.2
OH AVG
4.6
Rank
#95 / 183 | - | 41 | - |
61
Facility
61
OH AVG
40
Rank
#140 / 704 | Cameron Bommer | $3.6MFiscal year ending 12/2023
Facility
$3.6MFiscal year ending 12/2023
OH AVG
$10.1M
Rank
#167 / 183 | $2.1MFiscal year ending 12/2023
Facility
$2.1MFiscal year ending 12/2023
OH AVG
$3.9M
Rank
#159 / 183 | 58.3%Fiscal year ending 12/2023
Facility
58.3%Fiscal year ending 12/2023
OH AVG
40.2%
Rank
#39 / 183 | 365462 |
Bridgetown Nursing and Rehabilitation is located in Cincinnati, Ohio.
Here are the financial assistance programs available to residents in Ohio.
Bridgetown Nursing and Rehabilitation has a walk score of 61. Moderately walkable. Some errands can be accomplished on foot, with a mix of nearby amenities.
Bridgetown Nursing and Rehabilitation's occupancy is 56.3%.
No, Bridgetown Nursing and Rehabilitation has a no-pet policy.
Bridgetown Nursing and Rehabilitation is registered as a for-profit in OH.
Bridgetown Nursing and Rehabilitation has had 30 reported citations since 2019 according to records from Ohio Department of Aging (ODA).
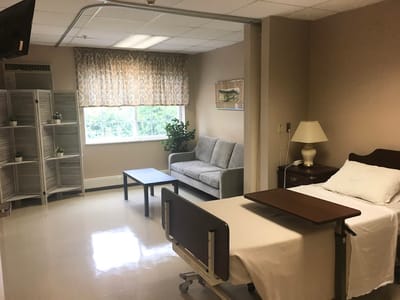
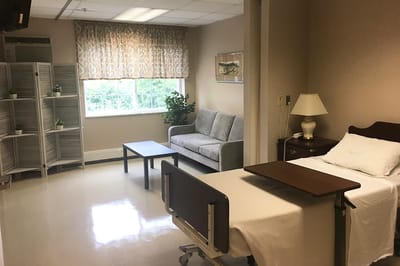
Yes — there are 5 photos of Bridgetown Nursing and Rehabilitation in the photo gallery on this page.
Bridgetown Nursing and Rehabilitation is located at 4307 Bridgetown Rd, Cincinnati, OH 45211.
Care Cost Calculator: See Prices in Your Area
Nursing Home Data Explorer
Don’t Wait Too Long: 7 Red Flag Signs Your Parent Needs Assisted Living Now
The True Cost of Assisted Living in 2025 – And How Families Are Paying For It
Understanding Senior Living Costs: Pricing Models, Discounts & Financial Assistance


