Sanctuary Pointe Nursing & Rehab Center
Nursing Home, Assisted Living, Hospice Care, Memory Care, Palliative Care & Respite Care · Cincinnati, OH
CMS overall rating Info CMS (the Centers for Medicare & Medicaid Services) is the federal agency that rates nursing home quality. Its Overall Rating runs from 1 to 5 stars, combining health inspections, staffing, and quality measures, with inspections weighted most heavily.

Sanctuary Pointe Nursing & Rehab Center

Nursing Home, Assisted Living, Hospice Care, Memory Care, Palliative Care & Respite Care · Cincinnati, OH
CMS overall rating Info CMS (the Centers for Medicare & Medicaid Services) is the federal agency that rates nursing home quality. Its Overall Rating runs from 1 to 5 stars, combining health inspections, staffing, and quality measures, with inspections weighted most heavily.
Calculator: See prices in your area
Sanctuary Pointe Nursing & Rehab Center accepts Medicare, Medicaid, and private pay.

Overview of Sanctuary Pointe Nursing & Rehab Center

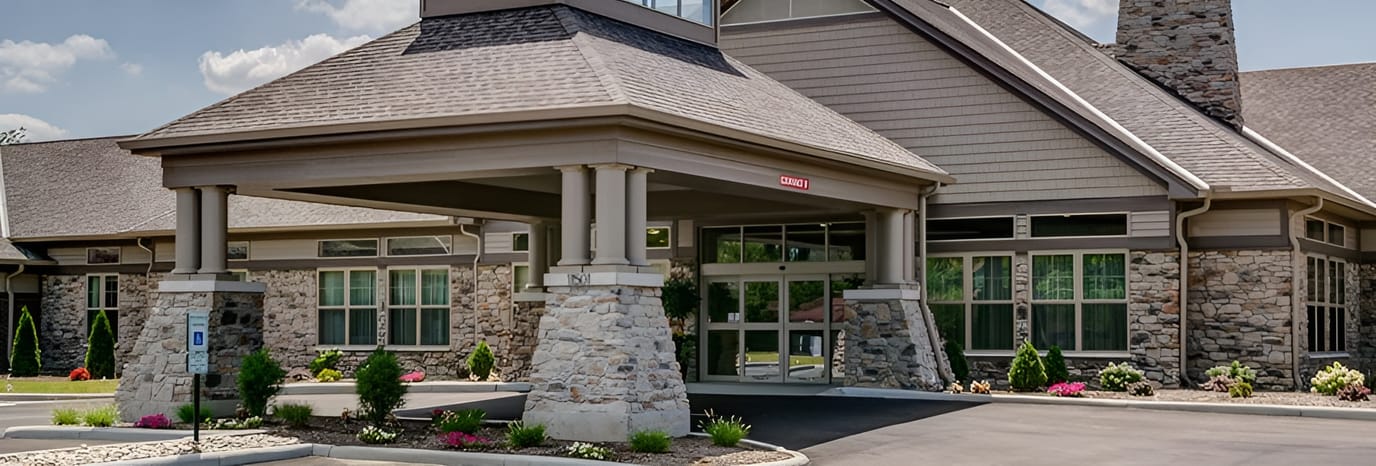
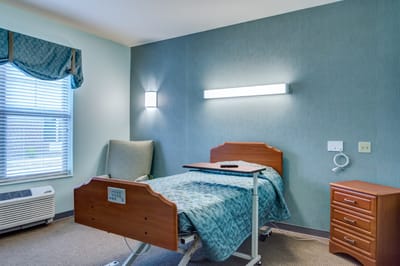
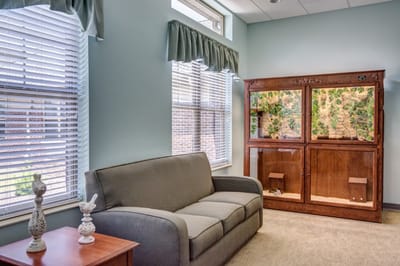
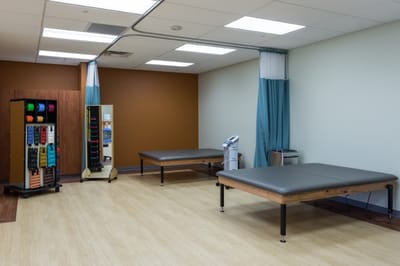
Enjoy a high quality of life with Sanctuary Pointe Nursing & Rehab Center, an excellent community in Cincinnati, OH, offering rehabilitation, memory care, and long-term care. Their team of kind and compassionate nurses, physicians, and therapists work together to create individualized care plans that best align with their needs. Those looking to recover their mobility, abilities, and strength, have access to a dedicated therapy team with a proven track record of delivering excellent outcomes.

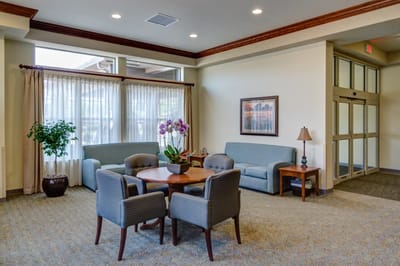
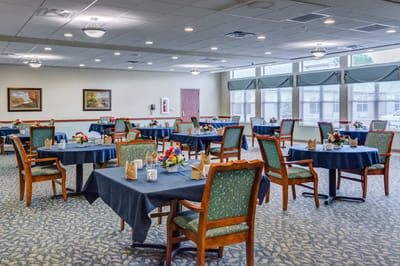
Residents living with memory loss are given loving care and support in their safe and structured units to ensure they are thriving and well. Their dietary technicians also ensure residents enjoy well-balanced meals tailored to their unique dietary needs and preferences. Here, you’re guaranteed to achieve your maximum potential while enjoying countless opportunities to connect with new people and have new experiences.

(513) 648-7000

Quality ratings

Measured by Centers for Medicare & Medicaid Services (CMS)

Overall rating Info The Overall CMS Rating combines results from health inspections, staffing levels and quality measures. Health inspections carry the most weight. Staffing and quality scores can increase or decrease the final rating based on performance compared to state and national standards.
▲ 57.1% Above OH avg. ▲ 57.1% Above OH avg.OH average: 3.2Click the badge to see the full State ranking.Click here to see the full State ranking.
Health Inspection Info Based on the results of the facility's three most recent standard inspections and any complaint investigations. CMS reviews the number, scope, and severity of deficiencies, with more recent findings weighted more heavily.
▲ 42.8% Above OH avg. ▲ 42.8% Above OH avg.OH average: 2.8Click the badge to see the full State ranking.Click here to see the full State ranking.
Staffing Info Measures average nursing staff hours per resident per day, including Registered Nurses (RNs) and total nursing staff. Ratings are adjusted based on the level of care residents require and are compared to state and national benchmarks.
▼ 18.1% Below OH avg. ▼ 18.1% Below OH avg.OH average: 2.4Click the badge to see the full State ranking.Click here to see the full State ranking.
Quality Measures Info Based on clinical and physical health indicators reported to CMS, such as hospital readmissions, falls, pressure ulcers, and improvements in mobility. These measures reflect how well residents' health needs are being managed.
▲ 14.7% Above OH avg. ▲ 14.7% Above OH avg.OH average: 4.4Click the badge to see the full State ranking.Click here to see the full State ranking.

Staffing hours breakdown

Info Daily nursing hours per resident by staff type, reported to CMS. Higher is generally better — compare this facility to state and national averages to see where staffing stands.

Hours per resident per day — compared to Ohio state averages

Total nursing care / resident Info This home is ranked 115th out of 210 homes in Ohio for nurse hours. Total adjusted nursing hours per resident per day, combining RN, LPN, and aide time. CMS adjusts this for case-mix so facilities can be fairly compared.
3h 24m per day
Rank #115 / 210Nurse hours — State benchmarkedThis home is ranked 115th out of 210 homes in Ohio. Shows adjusted nurse hours per resident per day benchmarked to the Ohio average, with a ranking across 210 Ohio facilities. More hours mean more direct care. The national average is about 3.5 hrs; below 3.0 is a red flag.Rankings are based only on facilities in Ohio that report data for that category. Facilities without available data are excluded from the ranking.Click the rank badge to see the full State ranking.Click here to see the full State ranking.
This facility Ohio avg (3h 32m per day)
vs Ohio avg
-4%

3 of 6 metrics below state avg

Standout metric LPN / LVN is +13% above state avg
Staff typeHours / Day / Residentvs state avg
Registered Nurse (RN) Info RNs hold the highest nursing license and can assess residents, interpret test results, and direct care plans. More RN hours per day often signals stronger clinical oversight and faster response to health changes. 23m per day ▼ 41% State avg: 38m per day · National avg: 41m per day
LPN / LVN Info Licensed Practical Nurses (LPNs) or Licensed Vocational Nurses (LVNs) deliver routine hands-on care — medication administration, wound dressing, and monitoring vital signs. They work under RN supervision and make up a large share of daily bedside care. 1h 6m per day ▲ 13% State avg: 58m per day · National avg: 52m per day
Nurse Aide Info Certified Nurse Aides (CNAs) provide the most direct day-to-day assistance: bathing, dressing, feeding, and mobility. Nurse aide hours are typically the largest staffing category and directly affect residents' quality of life. 2h 9m per day ■ Avg State avg: 2h 8m per day · National avg: 2h 21m per day
Weekend Total Nursing Info Combined nursing hours (RN + LPN + Nurse Aide) per resident per day on weekends. Staffing often drops on weekends — this figure reveals whether the facility maintains adequate coverage outside of weekday hours. 3h 17m per day ■ Avg State avg: 3h 17m per day · National avg: 3h 26m per day
Physical Therapist Info Hours per resident per day provided by licensed Physical Therapists (PTs) or PT Assistants. PT services help residents recover mobility after injury or illness and are especially important for post-acute (short-stay) rehabilitation. 3m per day ▼ 14% State avg: 3m per day · National avg: 4m per day
Weekend RN Info Registered nurse hours specifically on weekends. Facilities sometimes reduce RN presence on Saturdays and Sundays — a low weekend RN figure compared to weekday hours can indicate reduced clinical oversight when most administrative staff are absent. 12m per day ▼ 50% State avg: 25m per day · National avg: 29m per day

Capacity and availability

This home usually has limited availability

Higher occupancy than the Ohio average: 78.7%
Occupancy rate
87% Rank #89 / 211Occupancy rate — State benchmarkedThis home is ranked 89th out of 211 homes in Ohio. Shows this facility's occupancy rate versus the Ohio average, with its Statewide rank out of 211. Higher occupancy signals strong local demand and financial stability.Rankings are based only on facilities in Ohio that report data for that category. Facilities without available data are excluded from the ranking.Click the rank badge to see the full State ranking.Click here to see the full State ranking.
Avg. Length of Stay
116 days
Bed community size
124-bed community Rank #43 / 323Bed count — State benchmarkedThis home is ranked 43rd out of 323 homes in Ohio. Shows this facility's certified or reported bed count compared to other Ohio facilities. Larger communities may offer more amenities, programs, and on-site services for residents and families.Rankings are based only on facilities in Ohio that report data for that category. Facilities without available data are excluded from the ranking.Click the rank badge to see the full State ranking.Click here to see the full State ranking.
A larger shared setting that may offer more common spaces and organized community services.
Walk Score
Walk Score: 22 / 100 Rank #526 / 705Walk Score — State benchmarkedThis home is ranked 526th out of 705 homes in Ohio. Shows how walkable this facility's neighborhood is compared to the average Walk Score across Ohio facilities. Higher scores benefit residents, families, and staff.Rankings are based only on facilities in Ohio that report data for that category. Facilities without available data are excluded from the ranking.Click the rank badge to see the full State ranking.Click here to see the full State ranking.
Car-dependent. Most errands require a car, with limited nearby walkable options.

Contact Sanctuary Pointe Nursing & Rehab Center

Staffing Data

Reporting period: October 1 – December 31, 2025 (Q4 2025). Source: CMS Payroll-Based Journal report.

Total staff 172
Employees 124
Contractors 48
Staff to resident ratio 1.51 : 1
26% fewer staff per resident than Ohio average
Ohio average ratio: 2.04 : 1 Ohio average ratio: 2.04 : 1See full Ohio ranking
Avg staff/day 57
Average shift 8.4 hours
0% compared with Ohio average
Ohio average: 8.1 hours Ohio average shift: 8.1 hoursSee full Ohio ranking
Total staff hours (quarter) 43,928

Nursing staff breakdown

Q4 2025 · Oct 1 – Dec 31 More info This data comes from the CMS Payroll-Based Journal report covering October 1 – December 31, 2025.
Registered Nurse

Manages medical care and health needs.

RN Staff Info All 8 RN Staff are full-time employees. No contractors work on this role. 8
Average shift length Info Average shift length. Calculated as total hours divided by days worked and average staff per day. 10.8 hours
Licensed Practical Nurse

Assists with medical care and medications.

LPN Staff Info 41 total: 26 full-time employees and 15 contractors. 41
Average shift length Info Average shift length. Calculated as total hours divided by days worked and average staff per day. 9.2 hours
Certified Nursing Assistant

Helps with daily care and mobility.

CNA Staff Info All 71 CNA Staff are full-time employees. No contractors work on this role. 71
Average shift length Info Average shift length. Calculated as total hours divided by days worked and average staff per day. 8.7 hours

Contractor staffing

Q4 2025 · Oct 1 – Dec 31 More info This data comes from the CMS Payroll-Based Journal report covering October 1 – December 31, 2025.

Total hours from contractors

6.4%

2,798 contractor hours this quarter

Licensed Practical Nurse: 15 Physical Therapy Aide: 9 Physical Therapy Assistant: 6 Respiratory Therapy Technician: 6 Speech Language Pathologist: 4 Qualified Social Worker: 4 Clinical Nurse Specialist: 1 Occupational Therapy Assistant: 1 Occupational Therapy Aide: 1 Medical Director: 1

Staff by category

Q4 2025 · Oct 1 – Dec 31 More info This data comes from the CMS Payroll-Based Journal report covering October 1 – December 31, 2025.
Certified Nursing Assistant7107121,54292100%8.7
Licensed Practical Nurse26154110,54892100%9.2
Clinical Nurse Specialist5161,8027885%7
Registered Nurse8081,7397986%10.8
Other Dietary Services Staff5051,5158896%6.9
Medication Aide/Technician3031,2728390%9.5
RN Director of Nursing2021,0477379%8.3
Speech Language Pathologist0449097885%7
Physical Therapy Aide0995307278%5.1
Administrator1015286672%8
Mental Health Service Worker1014966267%8
Dietitian1014765863%8.2
Respiratory Therapy Technician0664547784%5.9
Nurse Practitioner1014405661%7.9
Physical Therapy Assistant0663007683%3.5
Qualified Social Worker0441935863%3.3
Occupational Therapy Aide01162910%6.9
Occupational Therapy Assistant011471213%3.9
Medical Director011291213%2.4
71 Certified Nursing Assistant
% of Days 100%
41 Licensed Practical Nurse
% of Days 100%
6 Clinical Nurse Specialist
% of Days 85%
8 Registered Nurse
% of Days 86%
5 Other Dietary Services Staff
% of Days 96%
3 Medication Aide/Technician
% of Days 90%
2 RN Director of Nursing
% of Days 79%
4 Speech Language Pathologist
% of Days 85%
9 Physical Therapy Aide
% of Days 78%
1 Administrator
% of Days 72%
1 Mental Health Service Worker
% of Days 67%
1 Dietitian
% of Days 63%
6 Respiratory Therapy Technician
% of Days 84%
1 Nurse Practitioner
% of Days 61%
6 Physical Therapy Assistant
% of Days 83%
4 Qualified Social Worker
% of Days 63%
1 Occupational Therapy Aide
% of Days 10%
1 Occupational Therapy Assistant
% of Days 13%
1 Medical Director
% of Days 13%

Penalties and fines

Federal penalties imposed by CMS for regulatory violations, including civil money penalties (fines) and denials of payment for new Medicare/Medicaid admissions.

Source: CMS Penalties Database

No penalties in the past 3 years

No civil money penalties or payment denials were reported in the last 3 years.

Quality of care over time

These measures show how residents usually do over time at this home, based on health outcomes and preventive care.

High-risk clinical events score Info A composite score based on pressure ulcers, falls with injury, weight loss, walking ability decline, and activities of daily living decline. 3.1
46% better than Ohio average

Ohio average: 5.8

Functional decline score Info A composite score based on activities of daily living decline, walking ability decline, and incontinence. 9.7
24% better than Ohio average

Ohio average: 12.7

Long-stay resident measures
Significantly above average Ohio avg: 4.7 Info CMS star rating based on long-stay quality measure performance. 5 stars = significantly above average, 1 star = significantly below average.
Need for Help with Daily Activities Increased Info Percent of long-stay residents whose need for help with daily activities has increased 2.8%
59% better than Ohio average

Ohio average: 6.8%

Walking Ability Worsened Info Percent of long-stay residents whose ability to move independently worsened 4.4%
51% better than Ohio average

Ohio average: 8.9%

Low Risk Residents with Bowel/Bladder Incontinence Info Percent of low risk long-stay residents who lose control of their bowels or bladder 21.7%
In line with Ohio average

Ohio average: 22.0%

Falls with Major Injury Info Percent of long-stay residents experiencing one or more falls with major injury 1.3%
61% better than Ohio average

Ohio average: 3.4%

High Risk Residents with Pressure Ulcers Info Percent of long-stay high risk residents with pressure ulcers 1.1%
73% better than Ohio average

Ohio average: 3.9%

Urinary Tract Infection Info Percent of long-stay residents with a urinary tract infection 0.0%
100% better than Ohio average

Ohio average: 0.5%

Lost Too Much Weight Info Percent of long-stay residents who lose too much weight 6.0%
In line with Ohio average

Ohio average: 6.2%

Depressive Symptoms Info Percent of long-stay residents who have depressive symptoms 41.6%
73% worse than Ohio average

Ohio average: 24.0%

Antipsychotic Use Info Percent of long-stay residents who received an antipsychotic medication 7.1%
15% better than Ohio average

Ohio average: 8.4%

Pneumococcal Vaccine Info Percent of long-stay residents assessed and appropriately given the pneumococcal vaccine 99.2%
7% better than Ohio average

Ohio average: 92.4%

Influenza Vaccine Info Percent of long-stay residents assessed and appropriately given the seasonal influenza vaccine 98.0%
In line with Ohio average

Ohio average: 94.5%

Short-stay resident measures
Significantly above average Ohio avg: 2.4 Info CMS star rating based on short-stay quality measure performance. 5 stars = much above average, 1 star = much below average.
Pneumococcal Vaccine Info Percent of short-stay residents assessed and appropriately given the pneumococcal vaccine 85.4%
9% better than Ohio average

Ohio average: 78.0%

Antipsychotic medication increase Info Percent of short-stay residents who newly received an antipsychotic medication 1.3%
In line with Ohio average

Ohio average: 1.3%

Influenza Vaccine Info Percent of short-stay residents assessed and appropriately given the seasonal influenza vaccine 79.6%
5% better than Ohio average

Ohio average: 75.6%

Re-hospitalized after SNF stay Info Percentage of short-stay residents who were re-hospitalized after their nursing home admission. 21.0%
16% better than Ohio average

Ohio average: 25.1%

Emergency department visits Info Percentage of short-stay residents who had an outpatient emergency department visit. 5.2%
58% better than Ohio average

Ohio average: 12.5%

Falls with major injury Info Percentage of SNF residents who experience falls with major injury during their stay. 0.0%
100% better than Ohio average

Ohio average: 0.8%

Ability to care for self at discharge Info Percentage of residents at or above expected ability to care for themselves at discharge. 50.0%
7% worse than Ohio average

Ohio average: 53.7%

Successful return to home or community Info Rate of successful return to home or community from a skilled nursing facility. 61.4%
21% better than Ohio average

Ohio average: 50.6%

Breakdown by payment type

Medicare

21% of new residents, usually for short-term rehab.

Typical stay 27 days

Private pay

71% of new residents, often for short stays.

Typical stay 1 - 2 months

Medicaid

8% of new residents, often for long-term daily care.

Typical stay 2 - 3 years

Facility Characteristics

Source: CMS Long-Term Care Facility Characteristics (Data as of Jan 2026)

Total residents 114
Medicare
16
14% of residents
Medicaid
81
71.1% of residents
Private pay or other
17
14.9% of residents
Programs & Services
Residents Group

Residents meet regularly to discuss policies, care quality, and activities

Family Member Group

Family members meet regularly to discuss policies, care quality, and activities

Active Family Council

Organized group of family members that meets regularly to discuss facility policies, resident care, and activities.

Active Resident Council

Organized group of residents that meets regularly to discuss facility policies, quality of life, and activities.

Finances and operations

Based on CMS SNF Cost Report for fiscal year ending in 12/2023.

Privately-owned community
Operated by a single business entity.
Net patient revenue Info Net patient revenue — what the home actually collects for resident care, after contractual allowances, bad debt and discounts are subtracted from its gross charges (CMS cost report, Worksheet G-3). It covers resident care only; money the home earns from other sources is shown separately as "Other income."
$12.5M
Net patient income Info Net patient income: net patient revenue minus the home's total operating expenses. A positive figure means it earns more from resident care than it spends to deliver it; a negative figure means the opposite. It excludes non-operating "other income."
-$132.2K
Privately-owned community Operated by a single business entity.
Net patient revenue Info Net patient revenue — what the home actually collects for resident care, after contractual allowances, bad debt and discounts are subtracted from its gross charges (CMS cost report, Worksheet G-3). It covers resident care only; money the home earns from other sources is shown separately as "Other income."
$12.5M Rank #40 / 210Revenue — State benchmarkedThis home is ranked 40th out of 210 homes in Ohio. Shows this facility's annual revenue compared to the Ohio average. Higher revenue generally means more resources for staffing and capital — read alongside Payroll %.Rankings are based only on facilities in Ohio that report data for that category. Facilities without available data are excluded from the ranking.Click the rank badge to see the full State ranking.Click here to see the full State ranking.
Net patient income Info Net patient income: net patient revenue minus the home's total operating expenses. A positive figure means it earns more from resident care than it spends to deliver it; a negative figure means the opposite. It excludes non-operating "other income."
-$132.2K
Other income Info Money the home earns outside of resident care — such as investments, grants, rentals and other non-operating sources (CMS cost report, Worksheet G-3). It is tracked separately from net patient revenue: it is not part of that figure, and it is not included in net patient income.
$480.6K
Payroll costs Info Staff salaries plus wage-related costs — benefits such as payroll taxes, health insurance and retirement — from the home's own accounting records (CMS cost report, Worksheet A). Contract or agency labor is counted separately, under other operating costs. Rank #44 / 210Payroll — State benchmarkedThis home is ranked 44th out of 210 homes in Ohio. Shows total annual staff payroll benchmarked to the Ohio average. Higher payroll investment relative to peers often signals better staffing and less reliance on cheaper contract labor.Rankings are based only on facilities in Ohio that report data for that category. Facilities without available data are excluded from the ranking.Click the rank badge to see the full State ranking.Click here to see the full State ranking.
$6.6M 52.5% of net patient revenue Info Payroll as a share of revenue: staff salaries and wage-related benefits divided by net patient revenue. A higher figure means more of each revenue dollar goes to staff pay. Rank #120 / 210Payroll % — State benchmarkedThis home is ranked 120th out of 210 homes in Ohio. Shows payroll as a percentage of revenue versus the Ohio average. Well-run Ohio facilities typically land around 54–64% — the top third Statewide. Below 25% may signal understaffing or heavy agency use — read with Staffing ratings.Rankings are based only on facilities in Ohio that report data for that category. Facilities without available data are excluded from the ranking.Click the rank badge to see the full State ranking.Click here to see the full State ranking.
Other operating costs Info Everything it costs to run the home apart from payroll — food, utilities, supplies, maintenance, contract labor and administration. Calculated as total operating expense minus payroll (staff salaries and wage-related benefits).
$6.1M
Total costs Info The home's total operating expense for the year — all the costs of running it, salaries included (CMS cost report, Worksheet G-3).
$12.7M

What does this home offer?

Housing options icon

Housing Options: Private / Semi-Private Rooms

Building type icon
Building type icon

Building Type: Single-story

Housekeeping icon
Housekeeping icon

Housekeeping Services

Recreational activities icon

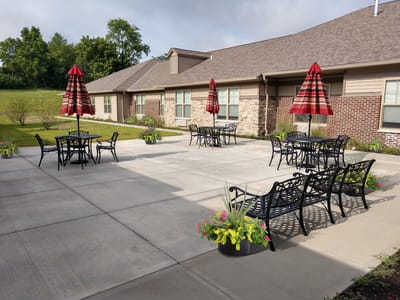
Recreational Activities

Exercise program icon

Exercise Programs

Health Programs icon

Health Programs

Who this home usually serves

TYPE OF STAY

Primarily short stays

Residents typically stay for brief periods, with frequent admissions and discharges throughout the year.

Most new residents arrive under private pay (71% of admissions), and a typical private pay stay runs around 1 - 2 months.

Admissions
335 total

Coverage residents most often arrive under.

Medicare 21%
Private pay 71%
Medicaid 8%
Discharges
339 total

Coverage residents most often leave under.

Medicare 20%
Private pay 65%
Medicaid 15%

Places of interest near Sanctuary Pointe Nursing & Rehab Center

Address 23.0 miles from city center Info Estimated distance in miles from Cincinnati's city center to Sanctuary Pointe Nursing & Rehab Center's address, calculated via Google Maps.

Calculate Travel Distance to Sanctuary Pointe Nursing & Rehab Center

Add your location

Address

Compare Nursing Homes around Cincinnati

The information below is reported by the Ohio Department of Health, Bureau of Survey and Certification.

5 facilities compared · CMS & OH Dept. of Health data

Sanctuary Pointe Nursing & Rehab Center
NH
AL
HC
MC
PC
RC
Cincinnati
124
Facility 124
OH AVG 78
Rank #43 / 323
87.0%
Facility 87.0%
OH AVG 78.7%
Rank #89 / 211
+11%
3.40
Facility 3.40
OH AVG 3.54
Rank #115 / 210
-49%-4%
$0
Facility $0
OH AVG $74.0k
Rank #1 / 211
33
Facility 33
OH AVG 30.9
Rank #124 / 210
5.5
Facility 5.5
OH AVG 4.6
Rank #167 / 210
-115-
22
Facility 22
OH AVG 40
Rank #526 / 705
Chase M. Kohn Irrevocable Trust
$12.5M
Facility $12.5M
OH AVG $10.1M
Rank #40 / 210
$6.6M
Facility $6.6M
OH AVG $3.9M
Rank #44 / 210
52.5%
Facility 52.5%
OH AVG 40.2%
Rank #120 / 210
366432
Mallard Cove Senior Living
NH
AL
MC
Sharonville
46
Facility 46
OH AVG 78
Rank #245 / 323
21.3%
Facility 21.3%
OH AVG 78.7%
Rank #211 / 211
-73%
5.90
Facility 5.90
OH AVG 3.54
Rank #6 / 210
+15%+67%
$0
Facility $0
OH AVG $74.0k
Rank #1 / 211
16
Facility 16
OH AVG 30.9
Rank #50 / 210
4.0
Facility 4.0
OH AVG 4.6
Rank #95 / 210
-34A+
48
Facility 48
OH AVG 40
Rank #277 / 705
Asad Ali
$1.5M
Facility $1.5M
OH AVG $10.1M
Rank #210 / 210
$2.6M
Facility $2.6M
OH AVG $3.9M
Rank #199 / 210
173.3%
Facility 173.3%
OH AVG 40.2%
Rank #1 / 210
366467
Mount Washington Care Center
NH
Cincinnati (Fruit Hill)
129
Facility 129
OH AVG 78
Rank #33 / 323
54.3%
Facility 54.3%
OH AVG 78.7%
Rank #197 / 211
-31%
3.25
Facility 3.25
OH AVG 3.54
Rank #150 / 210
+75%-8%
$0
Facility $0
OH AVG $74.0k
Rank #1 / 211
39
Facility 39
OH AVG 30.9
Rank #156 / 210
4.9
Facility 4.9
OH AVG 4.6
Rank #147 / 210
169A+
32
Facility 32
OH AVG 40
Rank #427 / 705
Edith Olanoff 2011 Trust Dated 10/21/2011
$8.9M
Facility $8.9M
OH AVG $10.1M
Rank #94 / 210
$5.8M
Facility $5.8M
OH AVG $3.9M
Rank #61 / 210
65.2%
Facility 65.2%
OH AVG 40.2%
Rank #35 / 210
365423
Cottingham Retirement Community
NH
AL
HC
IL
MC
PC
RC
Cincinnati (Sharonville)
128
Facility 128
OH AVG 78
Rank #36 / 323
45.3%
Facility 45.3%
OH AVG 78.7%
Rank #203 / 211
-42%
2.78
Facility 2.78
OH AVG 3.54
Rank #198 / 210
-48%-21%
$0
Facility $0
OH AVG $74.0k
Rank #1 / 211
22
Facility 22
OH AVG 30.9
Rank #80 / 210
3.7
Facility 3.7
OH AVG 4.6
Rank #82 / 210
258A+
53
Facility 53
OH AVG 40
Rank #223 / 705
-
$7.5M
Facility $7.5M
OH AVG $10.1M
Rank #140 / 210
$3.7M
Facility $3.7M
OH AVG $3.9M
Rank #157 / 210
49.3%
Facility 49.3%
OH AVG 40.2%
Rank #148 / 210
365652
Clovernook Health Care LLC
NH
RC
Cincinnati (College Hill)
126
Facility 126
OH AVG 78
Rank #39 / 323
86.1%
Facility 86.1%
OH AVG 78.7%
Rank #98 / 211
+9%
3.55
Facility 3.55
OH AVG 3.54
Rank #99 / 210
-34%0%
$0
Facility $0
OH AVG $74.0k
Rank #1 / 211
38
Facility 38
OH AVG 30.9
Rank #150 / 210
2.5
Facility 2.5
OH AVG 4.6
Rank #27 / 210
1106A+
18
Facility 18
OH AVG 40
Rank #561 / 705
Clovernook Healthcare Holdings LLC
$12.9M
Facility $12.9M
OH AVG $10.1M
Rank #53 / 210
$5.9M
Facility $5.9M
OH AVG $3.9M
Rank #48 / 210
45.8%
Facility 45.8%
OH AVG 40.2%
Rank #105 / 210
365551

Financial Assistance for
Nursing Home in Ohio

Sanctuary Pointe Nursing & Rehab Center is located in Cincinnati, Ohio.
Here are the financial assistance programs available to residents in Ohio.

Get Financial aid guidance

PASSPORT Waiver

Ohio Medicaid PASSPORT

Age 60+
General Ohio resident, Medicaid-eligible, nursing home-level care need.
Income Limits (2025) ~$2,829/month 300% FBR, individual
Asset Limits $2,000 (individual), $3,000 (couple).
OH

Administered through regional agencies; waitlists possible.

Benefits
Personal care (5-7 hours/day) Respite (240 hours/year) Adult day care ($65/day) Home modifications ($1,500 avg.)

Ohio Home Care Program (non-Medicaid)

OH HCP

Age 60+
General Ohio resident, at risk of decline.
Income Limits ~$2,000/month individual, varies
Asset Limits $5,000 individual
OH

Limited funding; regional variation.

Benefits
In-home care (3-5 hours/week) Respite (up to 10 days/year) Transportation (~5 trips/month)

Assisted Living Waiver (ALW)

Ohio Assisted Living Waiver

Age 21+ (65+ prioritized)
General OH resident, Medicaid-eligible, NFLOC.
Income Limits (2025) ~$2,829/month (individual); QIT required.
Asset Limits $2,000 (individual), $3,000 (couple).
OH

Covers ~300 facilities; room/board not included (separate cost).

Benefits
Personal care Meals Medication management Transportation (~$3,000-$4,000/month value)

Program of All-Inclusive Care for the Elderly (PACE)

Ohio PACE (e.g., McGregor PACE)

Age 55+
General OH resident (specific counties), NFLOC, safe with PACE support.
Income Limits (2025) ~$2,829/month (Medicaid-eligible); private pay option available.
Asset Limits $2,000 (individual), $3,000 (couple) for Medicaid enrollees.
OH

Available in 9 counties (e.g., Cuyahoga, Franklin); expanding via Healthy Aging Grants.

Benefits
Personal care (5-7 hours/day) Medical care Meals Transportation Respite Therapies

Medicare Savings Program (MSP)

Ohio Medicare Savings Program

Age 65+ or disabled
General OH resident, Medicare Part A/B.
Income Limits (2025) ~$2,510/month (QMB), ~$3,380/month (SLMB), ~$3,598/month (QI)—individual.
Asset Limits $9,430 (individual), $14,130 (couple).
OH

Three tiers; includes Extra Help for Part D; no waitlist.

Benefits
Covers Part B premiums ($174.70/month) Deductibles ($240/year) Copays (~20%)

Home Energy Assistance Program (HEAP)

Ohio HEAP

Age 60+ prioritized
General OH resident, low-income household.
Income Limits (2025) ~$3,970/month individual, 185% FPL
Asset Limits Not assessed; income-focused.
OH

Covers gas, electric, oil; emergency aid via Winter/Summer Crisis Programs.

Benefits
Heating/cooling aid ($300-$1,000/season) Emergency aid ($500 max)

Family Caregiver Support Program (FCSP)

Ohio Family Caregiver Support Program

Age
General Caregivers of 60+ needing care or 55+ caregivers of others; OH resident; functional needs (2+ ADLs).
Income Limits (2025) Prioritizes ~$24,980/year (individual); no strict cap.
Asset Limits Not assessed; need-based.
OH

12 AAAs; rural/low-income priority; volunteer respite option.

Benefits
Respite (4-6 hours/week or 5 days/year) Adult day care ($60/day) Training Supplies (~$500/year)

VA Aid and Attendance (A&A) and Housebound Benefits

Ohio VA Aid and Attendance/Housebound

Age 65+ or disabled veteran/spouse
General OH resident, wartime service, need for ADL help (A&A) or homebound.
Income Limits (2025) Net income < ~$1,984/month (veteran with dependent, A&A); pension offsets income.
Asset Limits ~$155,356 net worth limit
OH

High veteran demand; supports care in multiple settings.

Benefits
Cash (~$1,433-$2,642/month veteran, ~$951-$1,318 spouse) for care costs (e.g., in-home, assisted living)

Homestead Exemption

Ohio Homestead Exemption

Age 65+ (or disabled)
General OH resident, homeowner, low-income.
Income Limits (2025) ~$38,500/year individual, adjusted annually
Asset Limits Not assessed; home ownership required.
OH

Reduces taxable value by $25,000; applies to primary residence.

Benefits
Tax reduction (~$400-$800/year avg., varies by county)

Save the Dream Ohio (Homeowner Assistance Fund)

Ohio Save the Dream

Age 60+ prioritized
General OH resident, homeowner, hardship post-Jan 21, 2020.
Income Limits (2025) ~$147,600/year family of 4, 150% AMI; varies by county
Asset Limits Not assessed; hardship-focused.
OH

Covers delinquent mortgages, utilities, taxes; max $25,000 mortgage aid.

Benefits
Mortgage aid ($25,000 max) Utility/property tax aid ($5,000 avg.)

Frequently Asked Questions about Sanctuary Pointe Nursing & Rehab Center

Is Sanctuary Pointe Nursing & Rehab Center in a walkable area?

Sanctuary Pointe Nursing & Rehab Center has a walk score of 22. Car-dependent. Most errands require a car, with limited nearby walkable options.

What is the occupancy rate at Sanctuary Pointe Nursing & Rehab Center?

Sanctuary Pointe Nursing & Rehab Center's occupancy is 87.0%.

Are there photos of Sanctuary Pointe Nursing & Rehab Center?

Yes — there are 7 photos of Sanctuary Pointe Nursing & Rehab Center in the photo gallery on this page.

What is the address of Sanctuary Pointe Nursing & Rehab Center?

Sanctuary Pointe Nursing & Rehab Center is located at 11501 Hamilton Ave, Cincinnati, OH 45231.

What is the phone number of Sanctuary Pointe Nursing & Rehab Center?

(513) 648-7000 will put you in contact with the team at Sanctuary Pointe Nursing & Rehab Center.

Is Sanctuary Pointe Nursing & Rehab Center Medicare or Medicaid certified?

Yes — Sanctuary Pointe Nursing & Rehab Center is a CMS-certified provider of Medicare and Medicaid.

Guides for Better Senior Living

Care Cost Calculator: See Prices in Your Area

Nursing Home Data Explorer

Don’t Wait Too Long: 7 Red Flag Signs Your Parent Needs Assisted Living Now

The True Cost of Assisted Living in 2025 – And How Families Are Paying For It

Understanding Senior Living Costs: Pricing Models, Discounts & Financial Assistance