Brinton Manor Nursing and Rehabilitation Center
Nursing Home · Glen Mills, PA
CMS overall rating Info The Overall CMS Rating is scored from 1 to 5 stars and combines results from health inspections, staffing levels, and quality measures. Health inspections carry the most weight. Staffing and quality scores can increase or decrease the final rating based on performance compared to state and national standards.

Brinton Manor Nursing and Rehabilitation Center

Nursing Home · Glen Mills, PA
CMS overall rating Info The Overall CMS Rating is scored from 1 to 5 stars and combines results from health inspections, staffing levels, and quality measures. Health inspections carry the most weight. Staffing and quality scores can increase or decrease the final rating based on performance compared to state and national standards.
Calculator: See prices in your area
Brinton Manor Nursing and Rehabilitation Center accepts Medicare, Medicaid, and private pay.

Overview of Brinton Manor Nursing and Rehabilitation Center

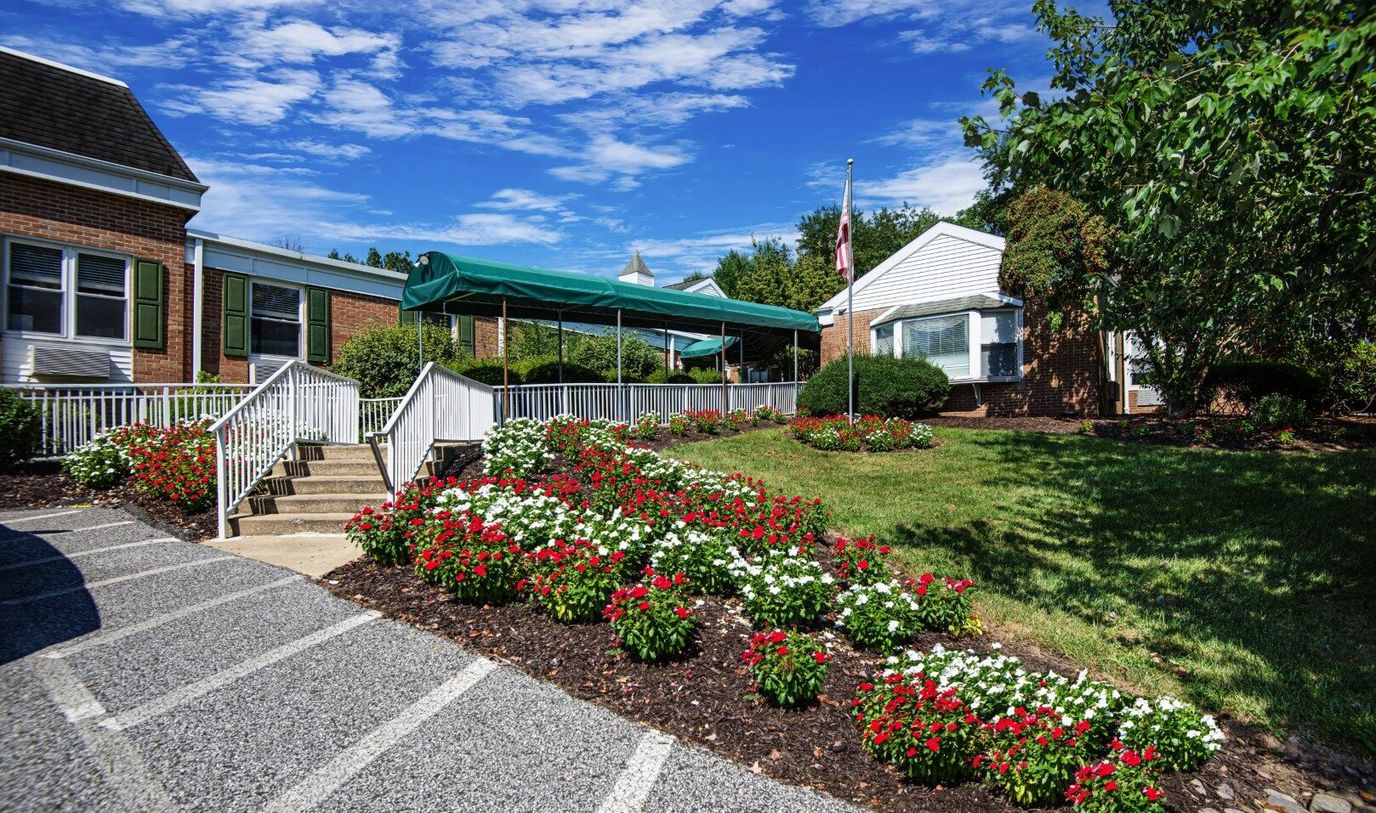
Brinton Manor Nursing and Rehabilitation Center is a nursing home in Glen Mills, PA, offering long-term care, rehabilitation, skilled nursing, respite care, and hospice care. Fostering comfort and healing, the community has a nurturing and supportive environment. Exceptional services, including 24-hour care, nutrition program, and falls management, are also provided to improve residents’ quality of life. Through a holistic approach to care, the community also ensures residents receive the best possible care for their unique needs and habits.

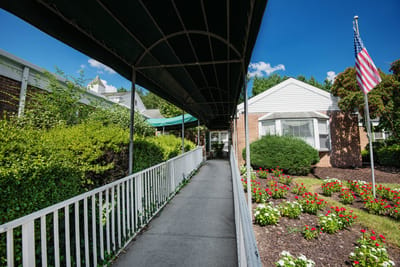
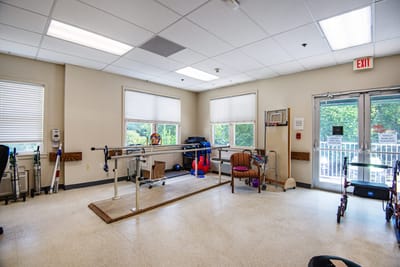
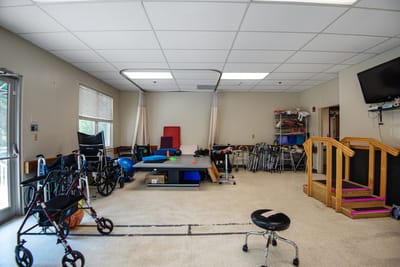
Sensory-stimulating activities and light exercises help maintain residents’ holistic wellness and encourage them to stay active. State-of-the-art rehabilitation equipment, well-lit spaces, and accessible rooms are also available, so residents can focus on their recovery. Nestled in the tree-lined neighborhood of Glen Mills, near bus stops, the community guarantees a stress-free retirement. This nursing home continuously provides top-notch services for older adults’ welfare, making it one of the best options for senior living in Pennsylvania.

Quality ratings

Measured by Centers for Medicare & Medicaid Services (CMS)

Overall rating Info The Overall CMS Rating combines results from health inspections, staffing levels and quality measures. Health inspections carry the most weight. Staffing and quality scores can increase or decrease the final rating based on performance compared to state and national standards.
At PA avg. At PA avg.Click the badge to see the full State ranking.Click here to see the full State ranking.
Health Inspection Info Based on the results of the facility's three most recent standard inspections and any complaint investigations. CMS reviews the number, scope, and severity of deficiencies, with more recent findings weighted more heavily.
▲ 7.2% Above PA avg. ▲ 7.2% Above PA avg.Click the badge to see the full State ranking.Click here to see the full State ranking.
Staffing Info Measures average nursing staff hours per resident per day, including Registered Nurses (RNs) and total nursing staff. Ratings are adjusted based on the level of care residents require and are compared to state and national benchmarks.
▼ 41.0% Below PA avg. ▼ 41.0% Below PA avg.Click the badge to see the full State ranking.Click here to see the full State ranking.
Quality Measures Info Based on clinical and physical health indicators reported to CMS, such as hospital readmissions, falls, pressure ulcers, and improvements in mobility. These measures reflect how well residents' health needs are being managed.
▼ 11.6% Below PA avg. ▼ 11.6% Below PA avg.Click the badge to see the full State ranking.Click here to see the full State ranking.

Staffing hours breakdown

Info Daily nursing hours per resident by staff type, reported to CMS. Higher is generally better — compare this facility to state and national averages to see where staffing stands.

Hours per resident per day — compared to Pennsylvania state averages

Total nursing care / resident Info This home is ranked 195th out of 203 homes in Pennsylvania. Total adjusted nursing hours per resident per day, combining RN, LPN, and aide time. CMS adjusts this for case-mix so facilities can be fairly compared.
3h 12m per day
Rank #195 / 203Nurse hours — State benchmarkedThis home is ranked 195th out of 203 homes in Pennsylvania. Shows adjusted nurse hours per resident per day benchmarked to the Pennsylvania average, with a ranking across 203 Pennsylvania SNFs. More hours mean more direct care. The national average is about 3.5 hrs; below 3.0 is a red flag.Click the rank badge to see the full State ranking.Click here to see the full State ranking.
This facility Pennsylvania avg (4h 9m per day)
vs Pennsylvania avg
-23%

5 of 6 metrics below state avg

Standout metric LPN / LVN is +5% above state avg
Staff typeHours / Day / Residentvs state avg
Registered Nurse (RN) Info RNs hold the highest nursing license and can assess residents, interpret test results, and direct care plans. More RN hours per day often signals stronger clinical oversight and faster response to health changes. 30m per day ▼ 36% State avg: 47m per day · National avg: 41m per day
LPN / LVN Info Licensed Practical Nurses (LPNs) or Licensed Vocational Nurses (LVNs) deliver routine hands-on care — medication administration, wound dressing, and monitoring vital signs. They work under RN supervision and make up a large share of daily bedside care. 58m per day ▲ 5% State avg: 55m per day · National avg: 52m per day
Nurse Aide Info Certified Nurse Aides (CNAs) provide the most direct day-to-day assistance: bathing, dressing, feeding, and mobility. Nurse aide hours are typically the largest staffing category and directly affect residents' quality of life. 1h 47m per day ▼ 19% State avg: 2h 12m per day · National avg: 2h 21m per day
Weekend Total Nursing Info Combined nursing hours (RN + LPN + Nurse Aide) per resident per day on weekends. Staffing often drops on weekends — this figure reveals whether the facility maintains adequate coverage outside of weekday hours. 2h 55m per day ▼ 17% State avg: 3h 31m per day · National avg: 3h 26m per day
Physical Therapist Info Hours per resident per day provided by licensed Physical Therapists (PTs) or PT Assistants. PT services help residents recover mobility after injury or illness and are especially important for post-acute (short-stay) rehabilitation. 5m per day ▼ 17% State avg: 6m per day · National avg: 4m per day
Weekend RN Info Registered nurse hours specifically on weekends. Facilities sometimes reduce RN presence on Saturdays and Sundays — a low weekend RN figure compared to weekday hours can indicate reduced clinical oversight when most administrative staff are absent. 19m per day ▼ 42% State avg: 33m per day · National avg: 29m per day

Types of Care at Brinton Manor Nursing and Rehabilitation Center

Nursing Home

Capacity and availability

This home usually has availability

Occupancy lower than 85% suggests more openings may be available.

Higher occupancy than the Pennsylvania average: 78.7%
Occupancy rate 82.7% Rank #120 / 511Occupancy rate — State benchmarkedThis home is ranked 120th out of 511 homes in Pennsylvania. Shows this facility's occupancy rate versus the Pennsylvania average, with its Statewide rank out of 511. Higher occupancy signals strong local demand and financial stability.Click the rank badge to see the full State ranking.Click here to see the full State ranking.
Avg. Length of Stay 73 days
Occupancy rate
82.7% Rank #120 / 511Occupancy rate — State benchmarkedThis home is ranked 120th out of 511 homes in Pennsylvania. Shows this facility's occupancy rate versus the Pennsylvania average, with its Statewide rank out of 511. Higher occupancy signals strong local demand and financial stability.Click the rank badge to see the full State ranking.Click here to see the full State ranking.
Avg. Length of Stay
73 days
Walk Score
Walk Score: 34 / 100 Rank #426 / 667Walk Score — State benchmarkedThis home is ranked 426th out of 667 homes in Pennsylvania. Shows how walkable this facility's neighborhood is compared to the average Walk Score across Pennsylvania SNFs. Higher scores benefit residents, families, and staff.Click the rank badge to see the full State ranking.Click here to see the full State ranking.
Somewhat walkable. A few nearby services may be reachable on foot, but most trips require transportation.

Contact Brinton Manor Nursing and Rehabilitation Center

Staffing Data

Reporting period: October 1 – December 31, 2025 (Q4 2025). Source: CMS Payroll-Based Journal report.

Total staff 170
Employees 95
Contractors 75
Staff to resident ratio 2.18:1
19% better than Pennsylvania average
Pennsylvania average ratio: 1.83:1 Pennsylvania average ratio: 1.83:1See full Pennsylvania ranking
Avg staff/day 39
Average shift 7.9 hours
0% compared with Pennsylvania average
Pennsylvania average: 7.8 hours Pennsylvania average shift: 7.8 hoursSee full Pennsylvania ranking
Total staff hours (quarter) 28,265

Nursing staff breakdown

Q4 2025 · Oct 1 – Dec 31 More info This data comes from the CMS Payroll-Based Journal report covering October 1 – December 31, 2025.
Registered Nurse

Manages medical care and health needs.

RN Staff 2
Average shift length Info Average shift length. Calculated as total hours divided by days worked and average staff per day. 4.1 hours

This role is partially covered by contractors.

Licensed Practical Nurse

Assists with medical care and medications.

LPN Staff 31
Average shift length Info Average shift length. Calculated as total hours divided by days worked and average staff per day. 8.6 hours

This role is partially covered by contractors.

Certified Nursing Assistant

Helps with daily care and mobility.

CNA Staff 95
Average shift length Info Average shift length. Calculated as total hours divided by days worked and average staff per day. 8.5 hours

This role is partially covered by contractors.

Contractor staffing

Q4 2025 · Oct 1 – Dec 31 More info This data comes from the CMS Payroll-Based Journal report covering October 1 – December 31, 2025.

Total hours from contractors

8.8%

2,482 contractor hours this quarter

Certified Nursing Assistant: 56 Licensed Practical Nurse: 14 Occupational Therapy Assistant: 2 Registered Nurse: 2 Occupational Therapy Aide: 1

Staff by category

Q4 2025 · Oct 1 – Dec 31 More info This data comes from the CMS Payroll-Based Journal report covering October 1 – December 31, 2025.
Certified Nursing Assistant39569512,86492100%8.5
Licensed Practical Nurse1714315,60492100%8.6
Clinical Nurse Specialist100103,12892100%7.4
RN Director of Nursing3031,0897784%8
Speech Language Pathologist4049597076%7.2
Physical Therapy Assistant6069537784%7
Respiratory Therapy Technician4046067177%5.6
Nurse Practitioner1015126470%8
Administrator2024966267%8
Dietitian1014966267%8
Mental Health Service Worker1014966267%8
Occupational Therapy Aide0112483134%8
Other Dietary Services Staff3032293437%6.7
Physical Therapy Aide1012272830%8.1
Qualified Social Worker2022215054%4.3
Registered Nurse022581415%4.1
Occupational Therapy Assistant022403942%1
Respiratory Therapist1013867%6.4
95 Certified Nursing Assistant
% of Days 100%
31 Licensed Practical Nurse
% of Days 100%
10 Clinical Nurse Specialist
% of Days 100%
3 RN Director of Nursing
% of Days 84%
4 Speech Language Pathologist
% of Days 76%
6 Physical Therapy Assistant
% of Days 84%
4 Respiratory Therapy Technician
% of Days 77%
1 Nurse Practitioner
% of Days 70%
2 Administrator
% of Days 67%
1 Dietitian
% of Days 67%
1 Mental Health Service Worker
% of Days 67%
1 Occupational Therapy Aide
% of Days 34%
3 Other Dietary Services Staff
% of Days 37%
1 Physical Therapy Aide
% of Days 30%
2 Qualified Social Worker
% of Days 54%
2 Registered Nurse
% of Days 15%
2 Occupational Therapy Assistant
% of Days 42%
1 Respiratory Therapist
% of Days 7%

Penalties and fines

Federal penalties imposed by CMS for regulatory violations, including civil money penalties (fines) and denials of payment for new Medicare/Medicaid admissions.

Source: CMS Penalties Database

No penalties in the past 3 years

No civil money penalties or payment denials were reported in the last 3 years.

Quality of care over time

These measures show how residents usually do over time at this home, based on health outcomes and preventive care.

High-risk clinical events score Info A composite score based on pressure ulcers, falls with injury, weight loss, walking ability decline, and activities of daily living decline. 8.0
27% better than Pennsylvania average

Pennsylvania average: 11.0

Functional decline score Info A composite score based on activities of daily living decline, walking ability decline, and incontinence. 18.0
19% better than Pennsylvania average

Pennsylvania average: 22.2

Long-stay resident measures
Significantly above average Info CMS star rating based on long-stay quality measure performance. 5 stars = significantly above average, 1 star = significantly below average.
Need for Help with Daily Activities Increased Info Percent of long-stay residents whose need for help with daily activities has increased 13.7%
28% better than Pennsylvania average

Pennsylvania average: 19.0%

Walking Ability Worsened Info Percent of long-stay residents whose ability to move independently worsened 13.9%
34% better than Pennsylvania average

Pennsylvania average: 21.1%

Low Risk Residents with Bowel/Bladder Incontinence Info Percent of low risk long-stay residents who lose control of their bowels or bladder 26.5%
In line with Pennsylvania average

Pennsylvania average: 26.7%

Falls with Major Injury Info Percent of long-stay residents experiencing one or more falls with major injury 5.1%
60% worse than Pennsylvania average

Pennsylvania average: 3.2%

High Risk Residents with Pressure Ulcers Info Percent of long-stay high risk residents with pressure ulcers 3.3%
41% better than Pennsylvania average

Pennsylvania average: 5.5%

Urinary Tract Infection Info Percent of long-stay residents with a urinary tract infection 1.2%
30% better than Pennsylvania average

Pennsylvania average: 1.8%

Lost Too Much Weight Info Percent of long-stay residents who lose too much weight 4.0%
40% better than Pennsylvania average

Pennsylvania average: 6.6%

Depressive Symptoms Info Percent of long-stay residents who have depressive symptoms 15.7%
185% worse than Pennsylvania average

Pennsylvania average: 5.5%

Antipsychotic Use Info Percent of long-stay residents who received an antipsychotic medication 16.4%
In line with Pennsylvania average

Pennsylvania average: 17.1%

Pneumococcal Vaccine Info Percent of long-stay residents assessed and appropriately given the pneumococcal vaccine 92.2%
6% better than Pennsylvania average

Pennsylvania average: 86.9%

Influenza Vaccine Info Percent of long-stay residents assessed and appropriately given the seasonal influenza vaccine 98.5%
5% better than Pennsylvania average

Pennsylvania average: 93.5%

Hospitalizations per 1,000 days Info Number of hospitalizations per 1,000 long-stay resident days. 2.12
26% worse than Pennsylvania average

Pennsylvania average: 1.68

ED visits per 1,000 days Info Number of outpatient emergency department visits per 1,000 long-stay resident days. 1.54
28% worse than Pennsylvania average

Pennsylvania average: 1.20

Short-stay resident measures
Average Info CMS star rating based on short-stay quality measure performance. 5 stars = much above average, 1 star = much below average.
Pneumococcal Vaccine Info Percent of short-stay residents assessed and appropriately given the pneumococcal vaccine 67.2%
In line with Pennsylvania average

Pennsylvania average: 68.8%

Antipsychotic medication increase Info Percent of short-stay residents who newly received an antipsychotic medication 0.8%
47% better than Pennsylvania average

Pennsylvania average: 1.5%

Influenza Vaccine Info Percent of short-stay residents assessed and appropriately given the seasonal influenza vaccine 70.6%
In line with Pennsylvania average

Pennsylvania average: 68.7%

Re-hospitalized after SNF stay Info Percentage of short-stay residents who were re-hospitalized after their nursing home admission. 27.6%
19% worse than Pennsylvania average

Pennsylvania average: 23.1%

Emergency department visits Info Percentage of short-stay residents who had an outpatient emergency department visit. 11.4%
16% worse than Pennsylvania average

Pennsylvania average: 9.8%

Falls with major injury Info Percentage of SNF residents who experience falls with major injury during their stay. 1.0%
32% worse than Pennsylvania average

Pennsylvania average: 0.8%

Ability to care for self at discharge Info Percentage of residents at or above expected ability to care for themselves at discharge. 40.7%
24% worse than Pennsylvania average

Pennsylvania average: 53.7%

Successful return to home or community Info Rate of successful return to home or community from a skilled nursing facility. 49.6%
In line with Pennsylvania average

Pennsylvania average: 50.6%

Breakdown by payment type

Medicare

31% of new residents, usually for short-term rehab.

Typical stay 25 days

Private pay

58% of new residents, often for short stays.

Typical stay 29 days

Medicaid

10% of new residents, often for long-term daily care.

Typical stay 1 - 2 years

Facility Characteristics

Source: CMS Long-Term Care Facility Characteristics (Data as of Jan 2026)

Total residents 78
Medicare
30
38.5% of residents
Medicaid
48
61.5% of residents
Programs & Services
Residents Group

Residents meet regularly to discuss policies, care quality, and activities

Active Resident Council

Organized group of residents that meets regularly to discuss facility policies, quality of life, and activities.

Finances and operations

Privately-owned community
Operated by a partnership between two or more business owners.
Home revenue
$10.9M
Profit
$257.7K
Privately-owned community Operated by a partnership between two or more business owners.
Home revenue
$10.9M Rank #174 / 205Revenue — State benchmarkedThis home is ranked 174th out of 205 homes in Pennsylvania. Shows this facility's annual revenue compared to the Pennsylvania SNF average. Higher revenue generally means more resources for staffing and capital — read alongside Payroll %.Click the rank badge to see the full State ranking.Click here to see the full State ranking.
Profit
$257.7K
Payroll costs Info The portion of the home's budget spent on staff, including nurses, caregivers, and other employees who support care and operations. Rank #184 / 205Payroll — State benchmarkedThis home is ranked 184th out of 205 homes in Pennsylvania. Shows total annual staff payroll benchmarked to the Pennsylvania average. Higher payroll investment relative to peers often signals better staffing and less reliance on cheaper contract labor.Click the rank badge to see the full State ranking.Click here to see the full State ranking.
$5.4M
49.2% of revenue Rank #98 / 205Payroll % — State benchmarkedThis home is ranked 98th out of 205 homes in Pennsylvania. Shows payroll as a percentage of revenue versus the Pennsylvania average. Well-run Pennsylvania SNFs typically land around 53–61% — the top third Statewide. Below 25% may signal understaffing or heavy agency use — read with Staffing ratings.Click the rank badge to see the full State ranking.Click here to see the full State ranking.
Other operating costs Info All remaining costs needed to run the home, such as food, utilities, building maintenance, supplies and administrative expenses.
$5.3M
Total costs $10.6M

What does this home offer?

Housing options icon

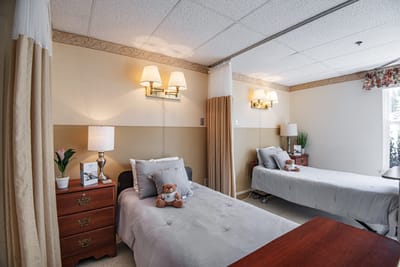
Housing Options: Shared Rooms

Building type icon
Building type icon

Building Type: Single-story

Dining services icon

Dining Services

Housekeeping icon
Housekeeping icon

Housekeeping Services

Social and recreational activities icon

Social and Recreational Activities

On-site medical care and health services icon

On-site Medical Care and Health Services

Rehabilitative support icon

Rehabilitative Support

Who this home usually serves

TYPE OF STAY

Mix of rehab and long-term care

This home supports both short-term rehab and long-term care, with residents staying for a wide range of durations.

Places of interest near Brinton Manor Nursing and Rehabilitation Center

Address 1.1 miles from city center Info Estimated distance in miles from Glen Mills's city center to Brinton Manor Nursing and Rehabilitation Center's address, calculated via Google Maps.

Calculate Travel Distance to Brinton Manor Nursing and Rehabilitation Center

Add your location

Address

Financial Assistance for
Nursing Home in Pennsylvania

Brinton Manor Nursing and Rehabilitation Center is located in Glen Mills, Pennsylvania.
Here are the financial assistance programs available to residents in Pennsylvania.

Get Financial aid guidance

Community HealthChoices (CHC)

PA Medicaid CHC

Age 65+ or disabled
General Pennsylvania resident, Medicaid-eligible, nursing home-level care need.
Income Limits (2025) ~$2,829/month 300% FBR, individual
Asset Limits $2,000 (individual), $3,000 (couple) (excludes home, car).
PA

Managed care model; high urban demand (e.g., Philadelphia, Pittsburgh).

Benefits
Personal care (5-7 hours/day, e.g., bathing, dressing) Respite care (up to 240 hours/year) Adult day care ($70/day) Home modifications ($1,500 avg.)

Pennsylvania OPTIONS Program

PA OPTIONS

Age 60+
General Pennsylvania resident, at risk of nursing home placement.
Income Limits ~$2,000/month individual, varies by region
Asset Limits $8,000 individual
PA

Cost-sharing required above certain income; rural/urban balance.

Benefits
In-home care (3-5 hours/week) Respite (up to 10 days/year) Adult day care (~$70/day) Transportation (~5 trips/month)

Living Independence for the Elderly (LIFE)

Pennsylvania LIFE (PACE)

Age 55+
General PA resident (specific counties), NFLOC, safe with LIFE support.
Income Limits (2025) ~$2,829/month (Medicaid-eligible); private pay option available.
Asset Limits $2,000 (individual), $3,000 (couple) for Medicaid enrollees.
PA

16 providers in 25 counties (e.g., Allegheny, Luzerne); LIFE branding unique to PA.

Benefits
Personal care (5-7 hours/day) Medical care Meals Transportation Respite Therapies

Medicare Savings Program (MSP)

Pennsylvania Medicare Savings Program

Age 65+ or disabled
General PA resident, Medicare Part A/B.
Income Limits (2025) ~$2,510/month (QMB), ~$3,380/month (SLMB), ~$3,598/month (QI)—individual.
Asset Limits $9,430 (individual), $14,130 (couple).
PA

Three tiers; includes Extra Help for Part D; no waitlist.

Benefits
Covers Part B premiums ($174.70/month) Deductibles ($240/year) Copays (~20%)

Family Caregiver Support Program (FCSP)

Pennsylvania Family Caregiver Support Program

Age
General Caregivers of 60+ needing care or 55+ caregivers of others; PA resident; functional needs (2+ ADLs).
Income Limits (2025) No strict cap; reimbursements up to $600/month if care recipient income < ~$2,322/month 185% FPL
Asset Limits Not assessed; need-based.
PA

High demand; includes grandparent caregivers.

Benefits
Respite (4-6 hours/week or 5 days/year) Adult day care ($60/day) Supplies (~$2,000/year) Caregiver training

VA Aid and Attendance (A&A) and Housebound Benefits

Pennsylvania VA Aid and Attendance/Housebound

Age 65+ or disabled veteran/spouse
General PA resident, wartime service, need for ADL help (A&A) or homebound.
Income Limits (2025) Net income < ~$1,984/month (veteran with dependent, A&A); pension offsets income.
Asset Limits ~$155,356 net worth limit
PA

High veteran population; supports rural/urban care needs.

Benefits
Cash (~$1,433-$2,642/month veteran, ~$951-$1,318 spouse) for care costs (e.g., in-home, assisted living)

Property Tax/Rent Rebate Program (PTRR)

Pennsylvania Property Tax/Rent Rebate Program

Age 65+
General PA resident, homeowner/renter (or widow/er 50+, disabled 18+).
Income Limits (2025) ~$45,000/year individual or couple, excludes half of Social Security
Asset Limits Not assessed; income-focused.
PA

Rebates up to $1,000; ~600,000 eligible annually.

Benefits
Rebates ($250-$1,000 based on income; e.g., $1,000 if income < $8,000)

Senior Farmers’ Market Nutrition Program (SFMNP)

Pennsylvania SFMNP

Age 60+
General PA resident, low-income.
Income Limits (2025) ~$2,322/month individual, 185% FPL
Asset Limits Not assessed.
PA

Vouchers (~$50/season) via 52 AAAs; serves ~200,000 annually.

Benefits
Vouchers (~$50/season) for fresh produce at approved markets

Compare Nursing Home around Glen Mills

The information below is reported by the Pennsylvania Department of Human Services and Department of Health.

2 facilities compared · CMS & PA Dept. of Health data

Filter by care type
Naamans Creek Country Manor
NH

Nursing Home Licensed facility providing 24/7 skilled nursing care for residents with complex, ongoing medical needs. Staffed by RNs, LPNs, and CNAs. Inspected and star-rated annually by CMS. Accepts Medicare (short-term rehab) and Medicaid (long-term care).

Garnet Valley (Bethel)90 82.0% +4%4.44 -11%+7%$8.2k172.8173 21 Naamans Creek Care, Inc$15.5M$6.2M39.8%395952
Brinton Manor Nursing and Rehabilitation Center
NH

Nursing Home Licensed facility providing 24/7 skilled nursing care for residents with complex, ongoing medical needs. Staffed by RNs, LPNs, and CNAs. Inspected and star-rated annually by CMS. Accepts Medicare (short-term rehab) and Medicaid (long-term care).

Glen Mills (Concord Township)92 82.7% +5%3.21 -90%-23%$0172.4-80 34 Machere Chiles$10.9M$5.4M49.2%395917

Frequently Asked Questions about Brinton Manor Nursing and Rehabilitation Center

What neighborhood is Brinton Manor Nursing and Rehabilitation Center in?

Brinton Manor Nursing and Rehabilitation Center is in the Concord Township neighborhood.

Is Brinton Manor Nursing and Rehabilitation Center in a walkable area?

Brinton Manor Nursing and Rehabilitation Center has a walk score of 34. Somewhat walkable. A few nearby services may be reachable on foot, but most trips require transportation.

What is the best email address for Brinton Manor Nursing and Rehabilitation Center?

The team at Brinton Manor Nursing and Rehabilitation Center can be reached at [email protected].

What is the address of Brinton Manor Nursing and Rehabilitation Center?

Brinton Manor Nursing and Rehabilitation Center is located at 549 Baltimore Pike, Glen Mills, PA 19342.

What is the phone number of Brinton Manor Nursing and Rehabilitation Center?

(610) 358-6005 will put you in contact with the team at Brinton Manor Nursing and Rehabilitation Center.

Is Brinton Manor Nursing and Rehabilitation Center Medicare or Medicaid certified?

Yes — Brinton Manor Nursing and Rehabilitation Center is a CMS-certified provider of Medicare and Medicaid.

Guides for Better Senior Living

Care Cost Calculator: See Prices in Your Area

Nursing Home Data Explorer

Don’t Wait Too Long: 7 Red Flag Signs Your Parent Needs Assisted Living Now

The True Cost of Assisted Living in 2025 – And How Families Are Paying For It

Understanding Senior Living Costs: Pricing Models, Discounts & Financial Assistance

Explore Open Rooms
1 Contact details
2 What type of senior care service are you looking for?
3 What budget do you have in mind for senior care?
4 How soon do you need to find care?
5 Additional details

Thank you for your interest!

Our team will be in touch shortly to help with next steps.