

Facility type
Nursing
Status
Active

We arrange tours, appointments, and even moving support so you don’t have to

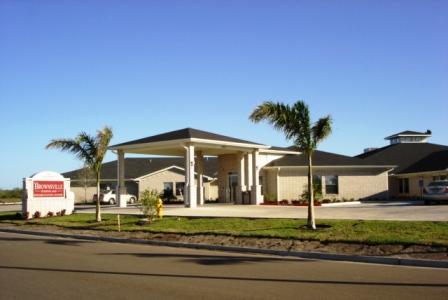
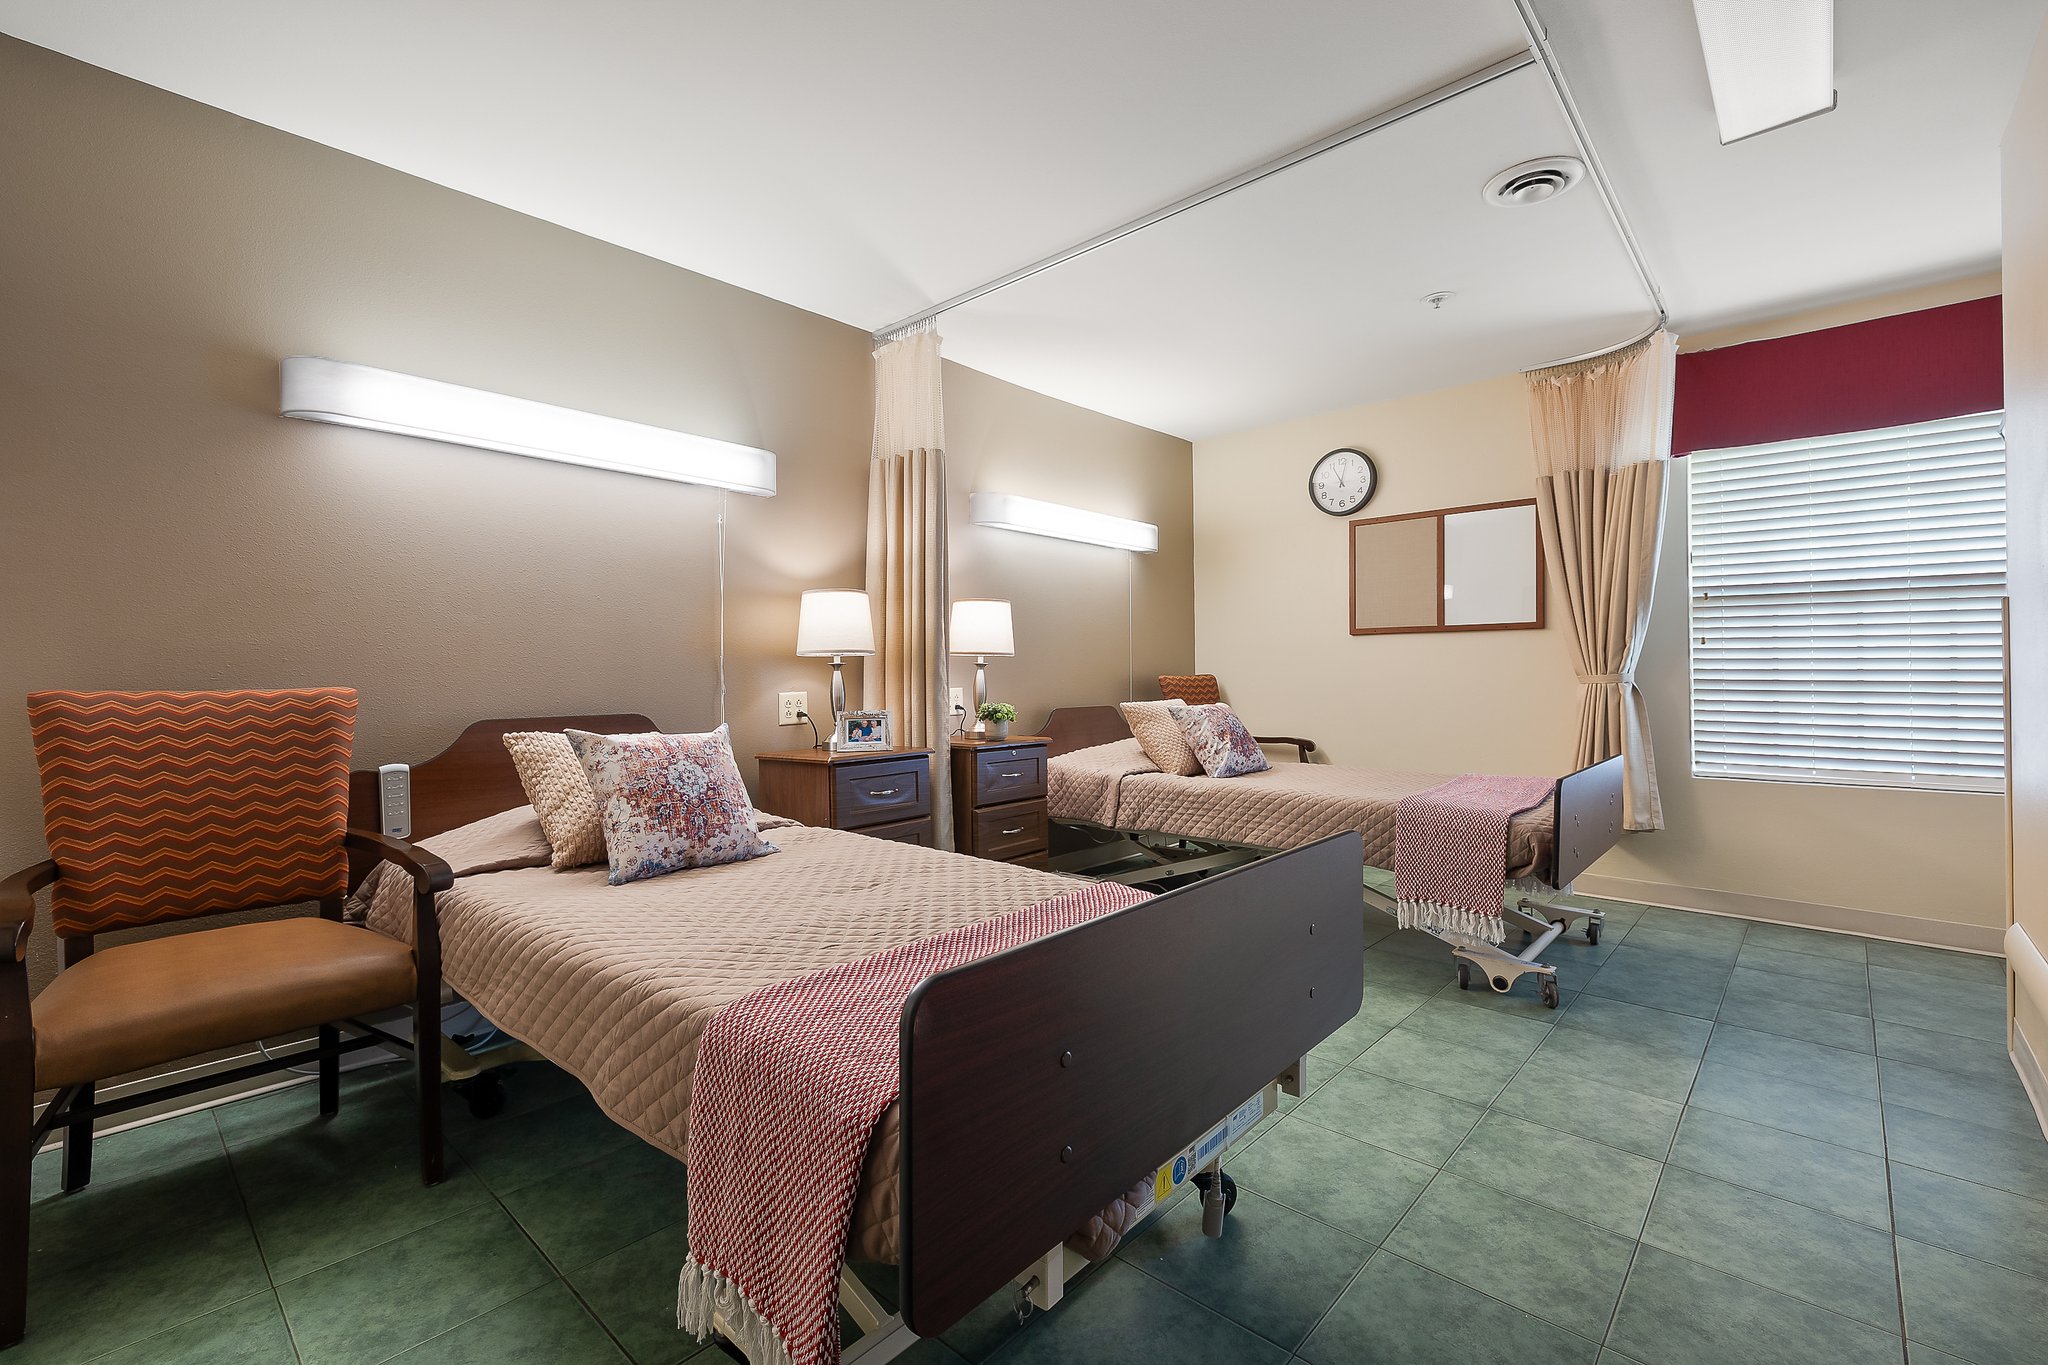
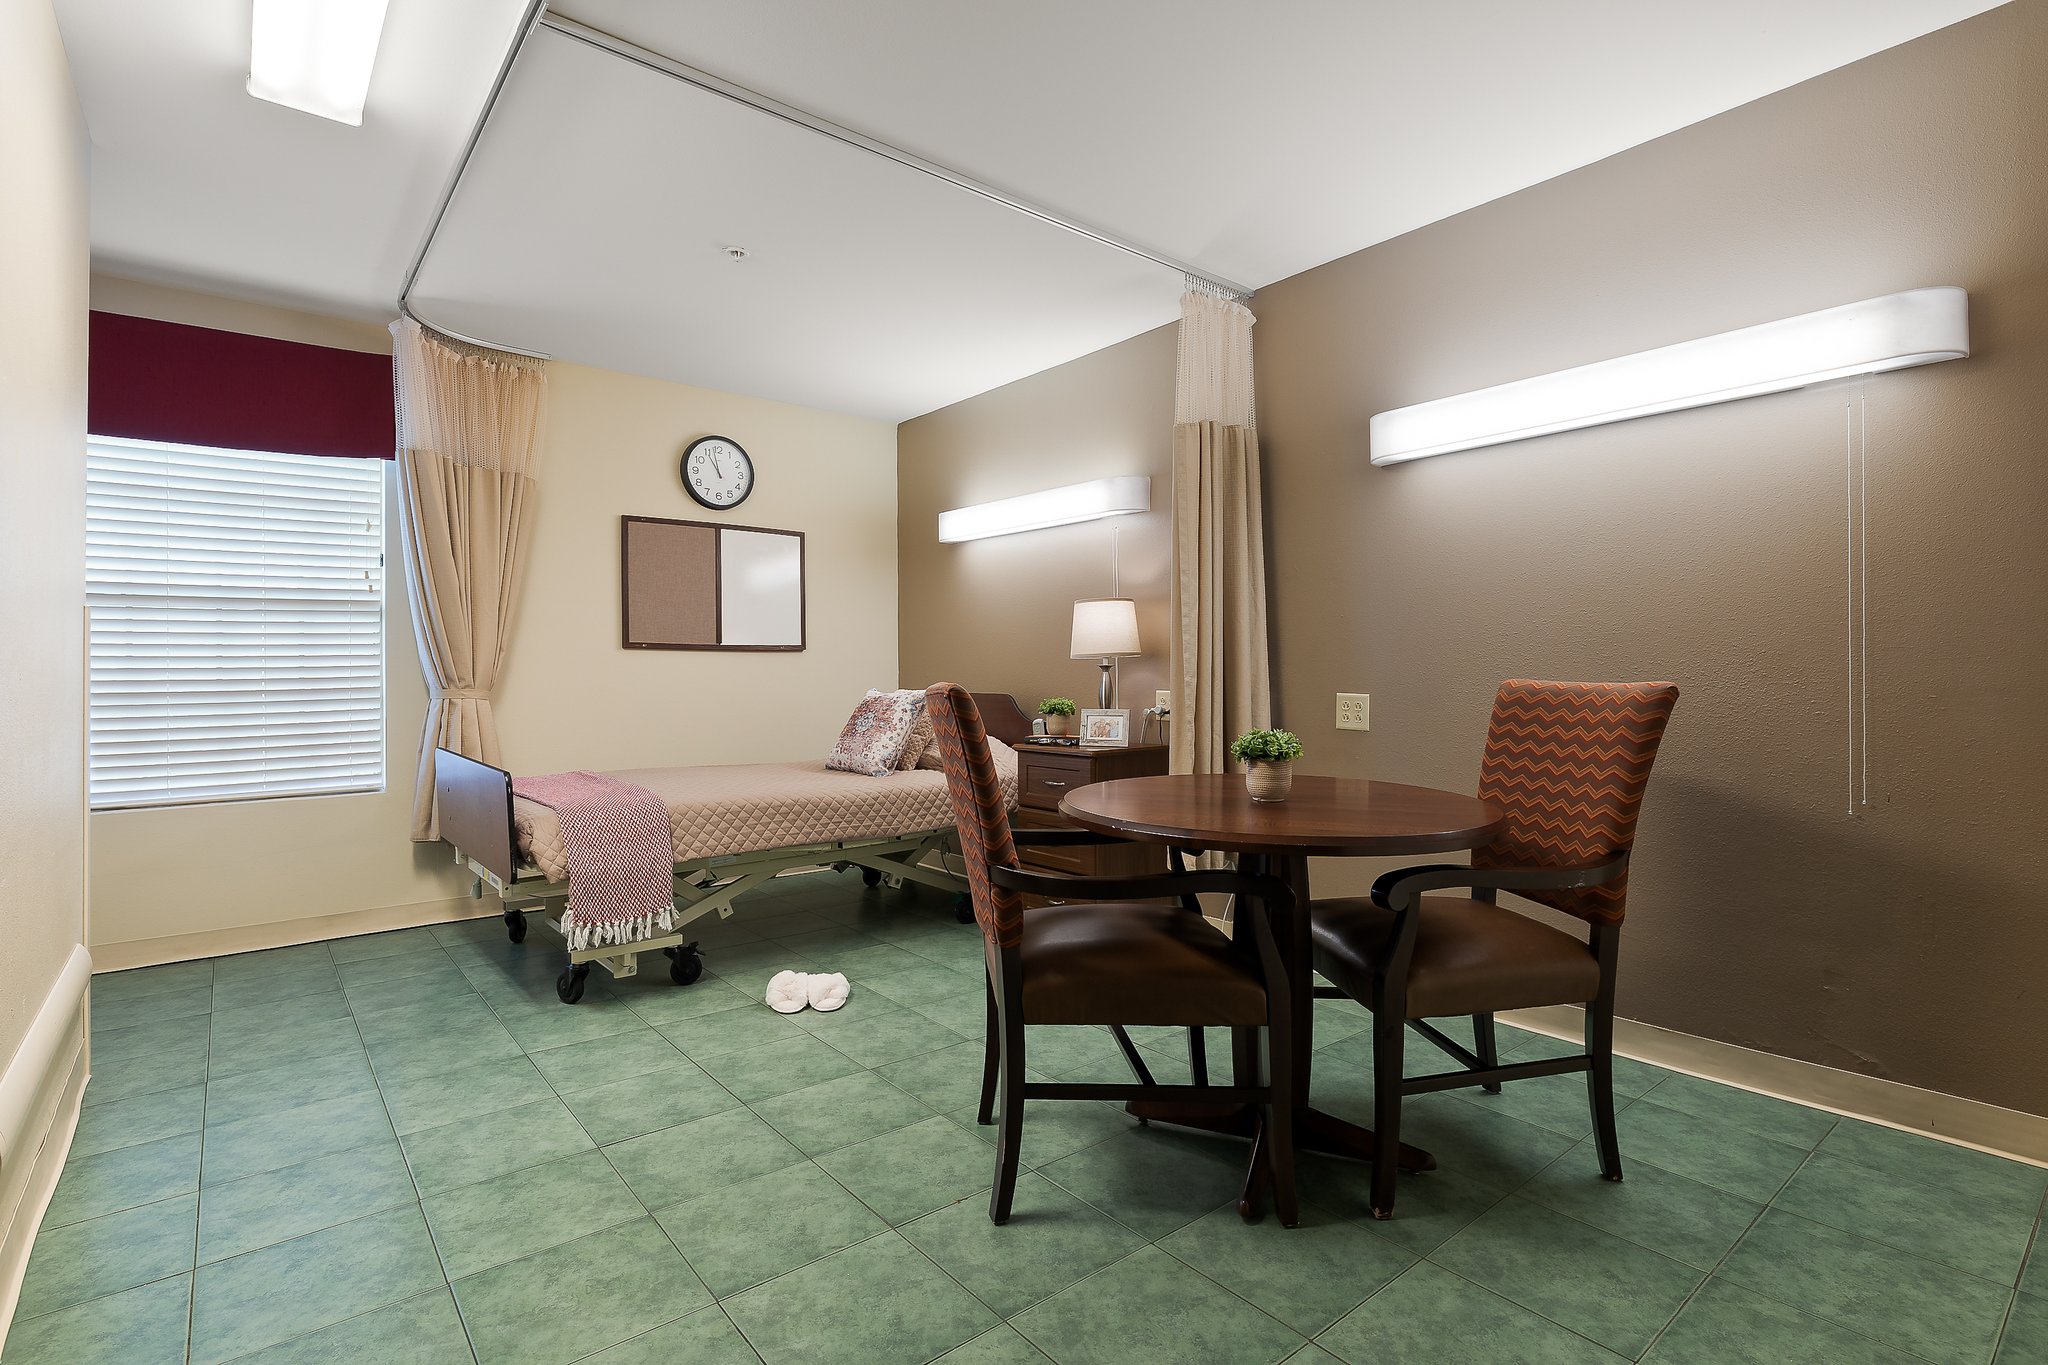
Settled in the peaceful town of Victoria, TX, Brownsville Nursing and Rehabilitation Center is a welcoming senior living community providing skilled nursing, memory care, therapy and rehabilitation, hospice care, and home health services. Here, residents can select from stunning and cozy accommodations tailored to their needs. The community is committed to providing the healthiest life possible for each and every resident through its well-equipped and compassionate team.
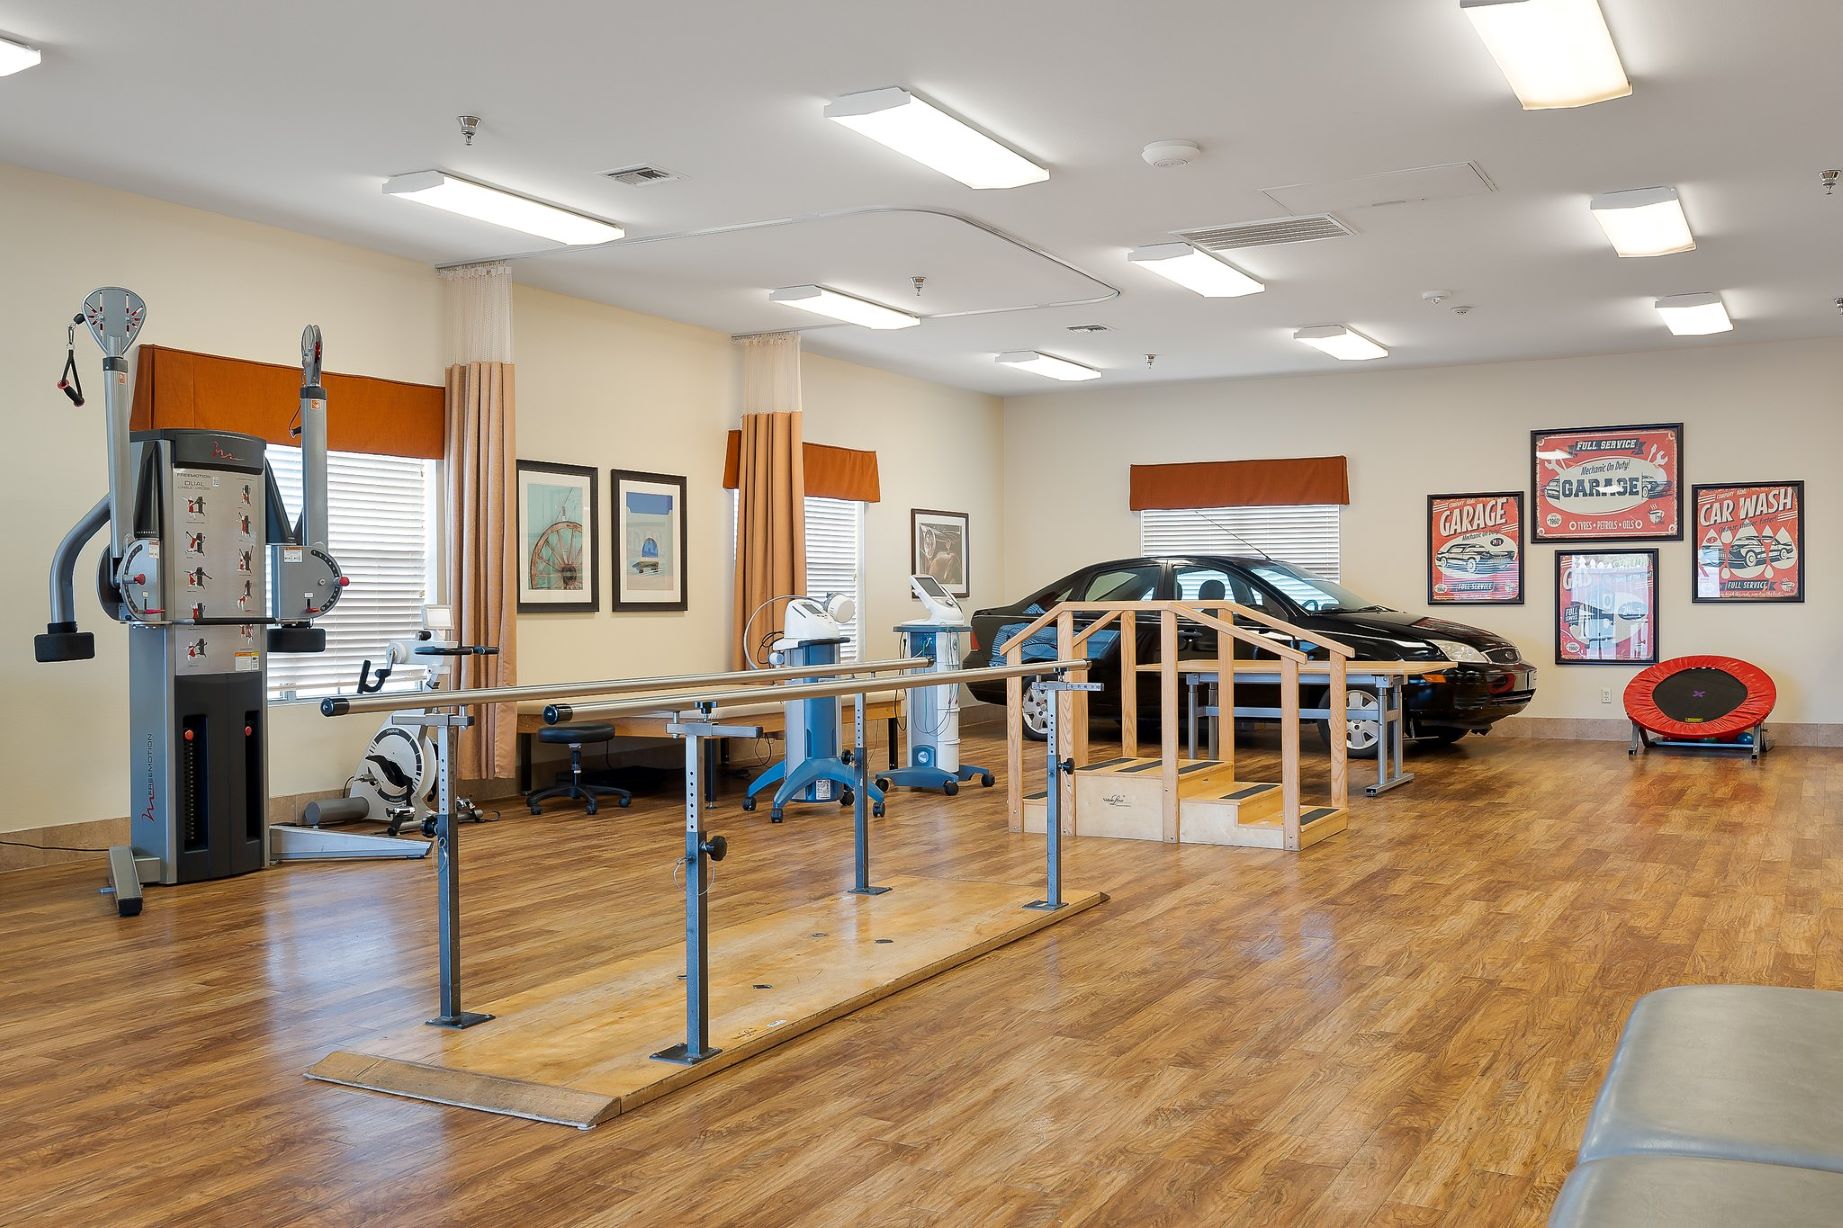
Offering above-and-beyond amenities and services, residents can avail of salon services, transportation assistance, a therapy gym, and a secure memory support unit. Meet new friends and create meaningful memories together either at the bistro or at the outdoor courtyard. With Brownsville Nursing and Rehabilitation Center, seniors are assured of an inclusive and secure living experience.
 Official CMS rating based on health inspections, staffing and quality measures.
Official CMS rating based on deficiencies found during state health inspections.
Official CMS rating based on nurse staffing hours per resident per day.
Official CMS rating based on clinical outcomes for residents.
Average daily nursing hours per resident (adjusted for acuity). Higher values indicate more nursing time per resident.
Hours of care per resident per day, broken down by staff type. Data from CMS Medicare.
Registered nurse hours per resident per day.
Licensed Practical Nurse / Licensed Vocational Nurse hours per resident per day.
Nurse aide hours per resident per day.
Total number of nurse staff hours per resident per day on weekends.
Physical therapist staff hours per resident per day.
Registered nurse hours per resident per day on weekends.
Official CMS rating based on health inspections, staffing and quality measures.
Official CMS rating based on deficiencies found during state health inspections.
Official CMS rating based on nurse staffing hours per resident per day.
Official CMS rating based on clinical outcomes for residents.
Average daily nursing hours per resident (adjusted for acuity). Higher values indicate more nursing time per resident.
Hours of care per resident per day, broken down by staff type. Data from CMS Medicare.
Registered nurse hours per resident per day.
Licensed Practical Nurse / Licensed Vocational Nurse hours per resident per day.
Nurse aide hours per resident per day.
Total number of nurse staff hours per resident per day on weekends.
Physical therapist staff hours per resident per day.
Registered nurse hours per resident per day on weekends.
Offers a balance of services and community atmosphere.
Lower occupancy suggests more openings may be available.
Residents typically stay for brief periods, with frequent admissions and discharges throughout the year.
19% of new residents, usually for short-term rehab.
70% of new residents, often for short stays.
11% of new residents, often for long-term daily care.
The portion of the home's budget spent on staff, including nurses, caregivers, and other employees who support care and operations.
All remaining costs needed to run the home, such as food, utilities, building maintenance, supplies and administrative expenses.
Brownsville Nursing and Rehabilitation Center is administrated by GISELLE GOMEZ.
Key information about the people who lead and staff this community.
Accept Medicaid: Yes
Total Residents: 120
Room Sizes: Private / Semi-Private
Building Type: Single-story
Transportation Services
Texas average 7.4
Last Health inspection on Aug 2025
Health citations are formal notices following inspections when they fail to comply with safety and care standards.
15 of 40 citations resulted from standard inspections; 22 of 40 resulted from complaint investigations; and 3 of 40 came from combined inspections (standard and complaint).
Texas average: 2
Texas average: 0.4
Data sourced from CMS Health Deficiencies reports. Citation severity codes range from A (least serious) to L (most serious). Immediate Jeopardy (J-L) citations indicate situations where the facility's noncompliance has placed residents at risk of death or serious harm.
Nursing Homes 24/7 care needed
Nursing Homes 24/7 care needed
Nursing Homes 24/7 care needed
Nursing Homes 24/7 care needed
Nursing Homes 24/7 care needed
 Veranda Rehabilitation and Healthcare
  Ebony Lake Nursing and Rehabilitation Center
 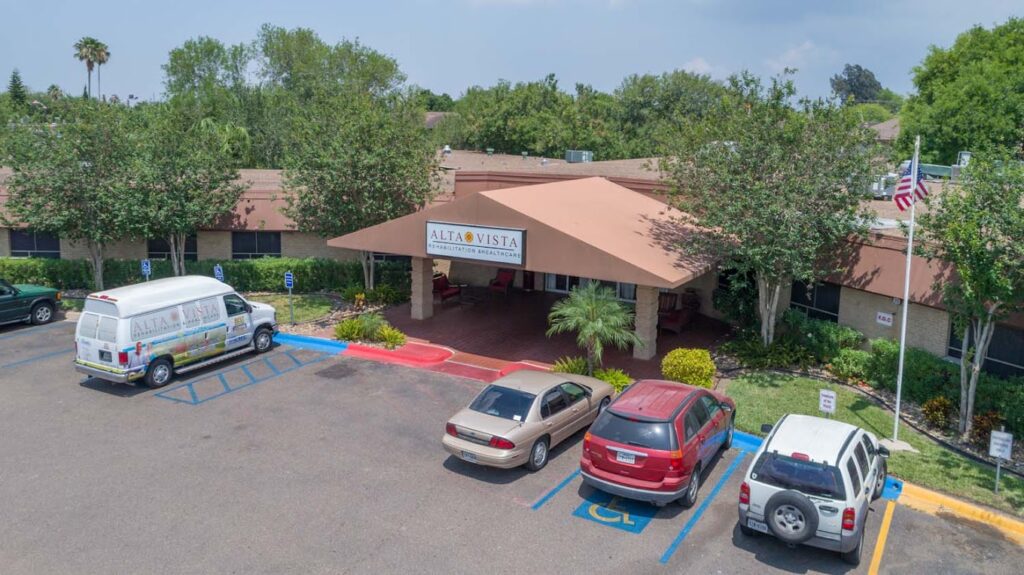 Alta Vista Rehabilitation and Healthcare
 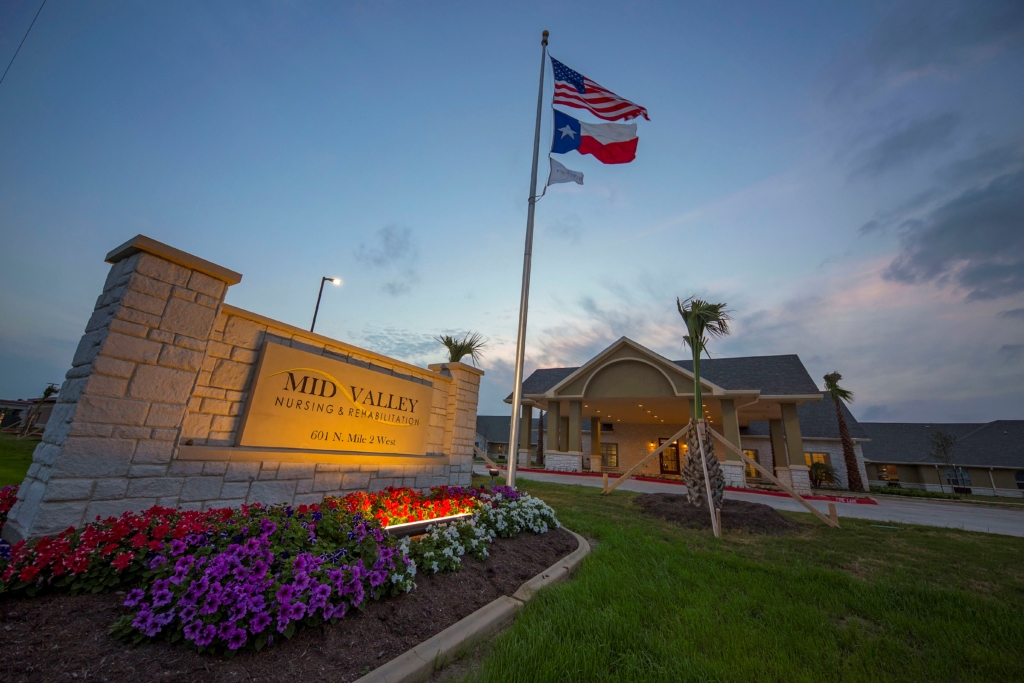 Mid Valley Nursing & Rehabilitation
 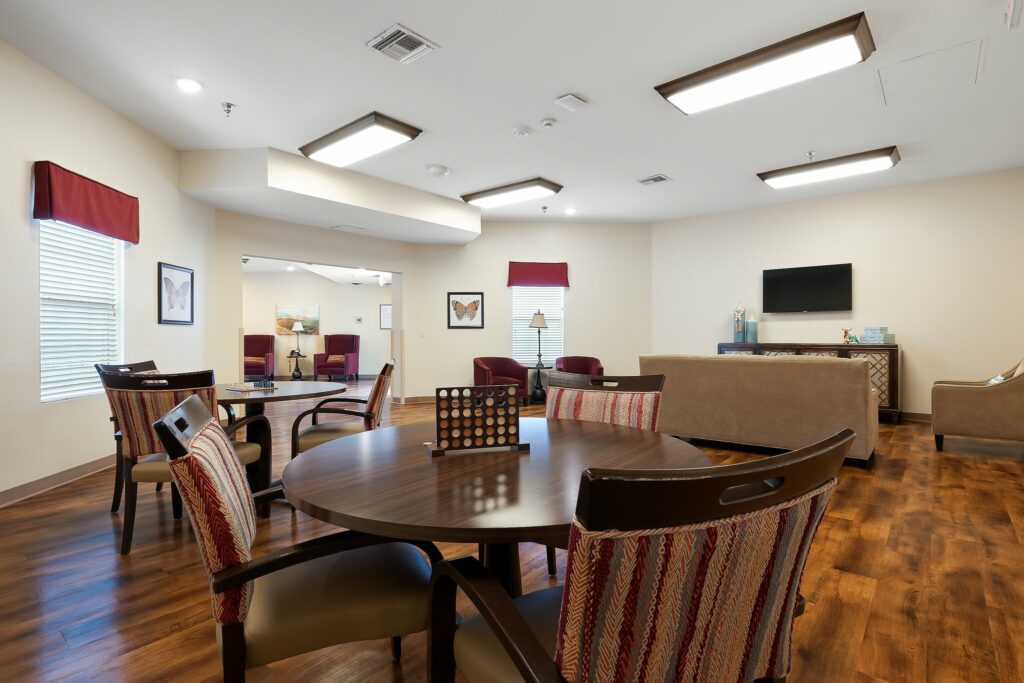 Brownsville Nursing and Rehabilitation Center
![]() 6.8 miles from city center
6.8 miles from city center
![]() 320 Lorenaly Dr, Brownsville, TX 78526
320 Lorenaly Dr, Brownsville, TX 78526
Add your location
Source: CMS Payroll-Based Journal (Q2 2025)
| Role ⓘ | Count ⓘ | Avg Shift (hrs) ⓘ | Uses Contractors? ⓘ |
|---|---|---|---|
| Registered Nurse | 13 | 7.5 | No |
| Licensed Practical Nurse | 25 | 9.4 | No |
| Certified Nursing Assistant | 38 | 8.8 | No |
| Role ⓘ | Employees ⓘ | Contractors ⓘ | Total Staff ⓘ | Total Hours ⓘ | Days Worked ⓘ | % of Days ⓘ | Avg Shift (hrs) ⓘ |
|---|---|---|---|---|---|---|---|
| Certified Nursing Assistant | 38 | 0 | 38 | 10,095 | 91 | 100% | 8.8 |
| Licensed Practical Nurse | 25 | 0 | 25 | 6,364 | 91 | 100% | 9.4 |
| Nurse Aide in Training | 27 | 0 | 27 | 4,735 | 91 | 100% | 8.3 |
| RN Director of Nursing | 9 | 0 | 9 | 2,817 | 80 | 88% | 9.4 |
| Medication Aide/Technician | 6 | 0 | 6 | 2,282 | 91 | 100% | 8 |
| Registered Nurse | 13 | 0 | 13 | 1,319 | 88 | 97% | 7.5 |
| Other Dietary Services Staff | 4 | 0 | 4 | 1,217 | 91 | 100% | 7.1 |
| Nurse Practitioner | 2 | 0 | 2 | 770 | 66 | 73% | 9.5 |
| Administrator | 1 | 0 | 1 | 553 | 65 | 71% | 8.5 |
| Mental Health Service Worker | 1 | 0 | 1 | 520 | 64 | 70% | 8.1 |
| Dietitian | 1 | 0 | 1 | 495 | 62 | 68% | 8 |
| Speech Language Pathologist | 1 | 2 | 3 | 490 | 66 | 73% | 7.2 |
| Respiratory Therapy Technician | 0 | 2 | 2 | 476 | 60 | 66% | 7.4 |
| Qualified Social Worker | 1 | 2 | 3 | 282 | 65 | 71% | 4 |
| Clinical Nurse Specialist | 1 | 0 | 1 | 229 | 22 | 24% | 10.4 |
| Occupational Therapy Aide | 0 | 4 | 4 | 118 | 18 | 20% | 4.5 |
| Medical Director | 0 | 2 | 2 | 44 | 29 | 32% | 1.4 |
| Occupational Therapy Assistant | 0 | 1 | 1 | 41 | 6 | 7% | 6.8 |
| Physical Therapy Aide | 1 | 0 | 1 | 16 | 2 | 2% | 8 |
Source: CMS Long-Term Care Facility Characteristics (Data as of Jan 2026)
Residents meet regularly to discuss policies, care quality, and activities
Organized group of residents that meets regularly to discuss facility policies, quality of life, and activities.
Data sourced from CMS Long-Term Care Facility Characteristics quarterly report. Payer mix reflects the current resident census by primary payment source.
These measures show how residents usually do over time at this home, based on health outcomes and preventive care.
Texas average: 8.6
Texas average: 16.0
Texas average: 16.2%
Texas average: 16.2%
Texas average: 15.7%
Texas average: 3.2%
Texas average: 4.4%
Texas average: 0.8%
Texas average: 3.5%
Texas average: 2.9%
Texas average: 7.9%
Texas average: 97.3%
Texas average: 97.9%
Texas average: 90.4%
Texas average: 1.4%
Texas average: 88.0%
Texas average: 25.9%
Texas average: 12.0%
Texas average: 0.8%
Texas average: 53.7%
Texas average: 50.6%
Quality measures are calculated from Minimum Data Set (MDS) assessments. For most measures, lower percentages indicate better care quality.
Federal penalties imposed by CMS for regulatory violations, including civil money penalties (fines) and denials of payment for new Medicare/Medicaid admissions.
Source: CMS Penalties Database (Data as of Jan 2026)
Texas average: $80K
Texas average: 2.5
Texas average: 0.2
Penalties are imposed by CMS for violations of federal nursing home regulations.
Last updated: Jan 2026
Historical financial and operational data for Brownsville Nursing and Rehabilitation Center based on CMS SNF Cost Reports.
Loading trend charts...
Care Cost Calculator: See Prices in Your Area
Nursing Home Data Explorer
Don’t Wait Too Long: 7 Red Flag Signs Your Parent Needs Assisted Living Now
The True Cost of Assisted Living in 2025 – And How Families Are Paying For It
Understanding Senior Living Costs: Pricing Models, Discounts & Financial Assistance

Touring a community? Use this expert-backed checklist to stay organized, ask the right questions, and find the perfect fit.
We'll send you a PDF version of the touring checklist.


