Explore Open Rooms

1 Contact details
2 What type of senior care service are you looking for?
3 What budget do you have in mind for senior care?
4 How soon do you need to find care?
5 Additional details

Thank you for your interest!

Our team will be in touch shortly to help with next steps.

Nursing Home

Cadia Healthcare Capitol Healthcare

Nursing Home

Cadia Healthcare Capitol Healthcare

1225 Walker Rd, Dover, DE 19904 View map
Overview of Cadia Healthcare Capitol Healthcare

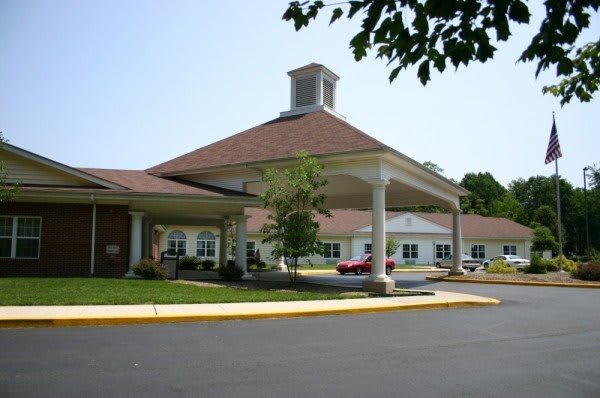
Located minutes from Routes 1 and 13 in Dover, Cadia Healthcare Capitol offers convenient access to Smyrna, Milford, and surrounding Kent County, DE communities. With the goal of getting residents back to their homes and families as soon as possible, this assisted living and nursing home offers the highest level of care. 
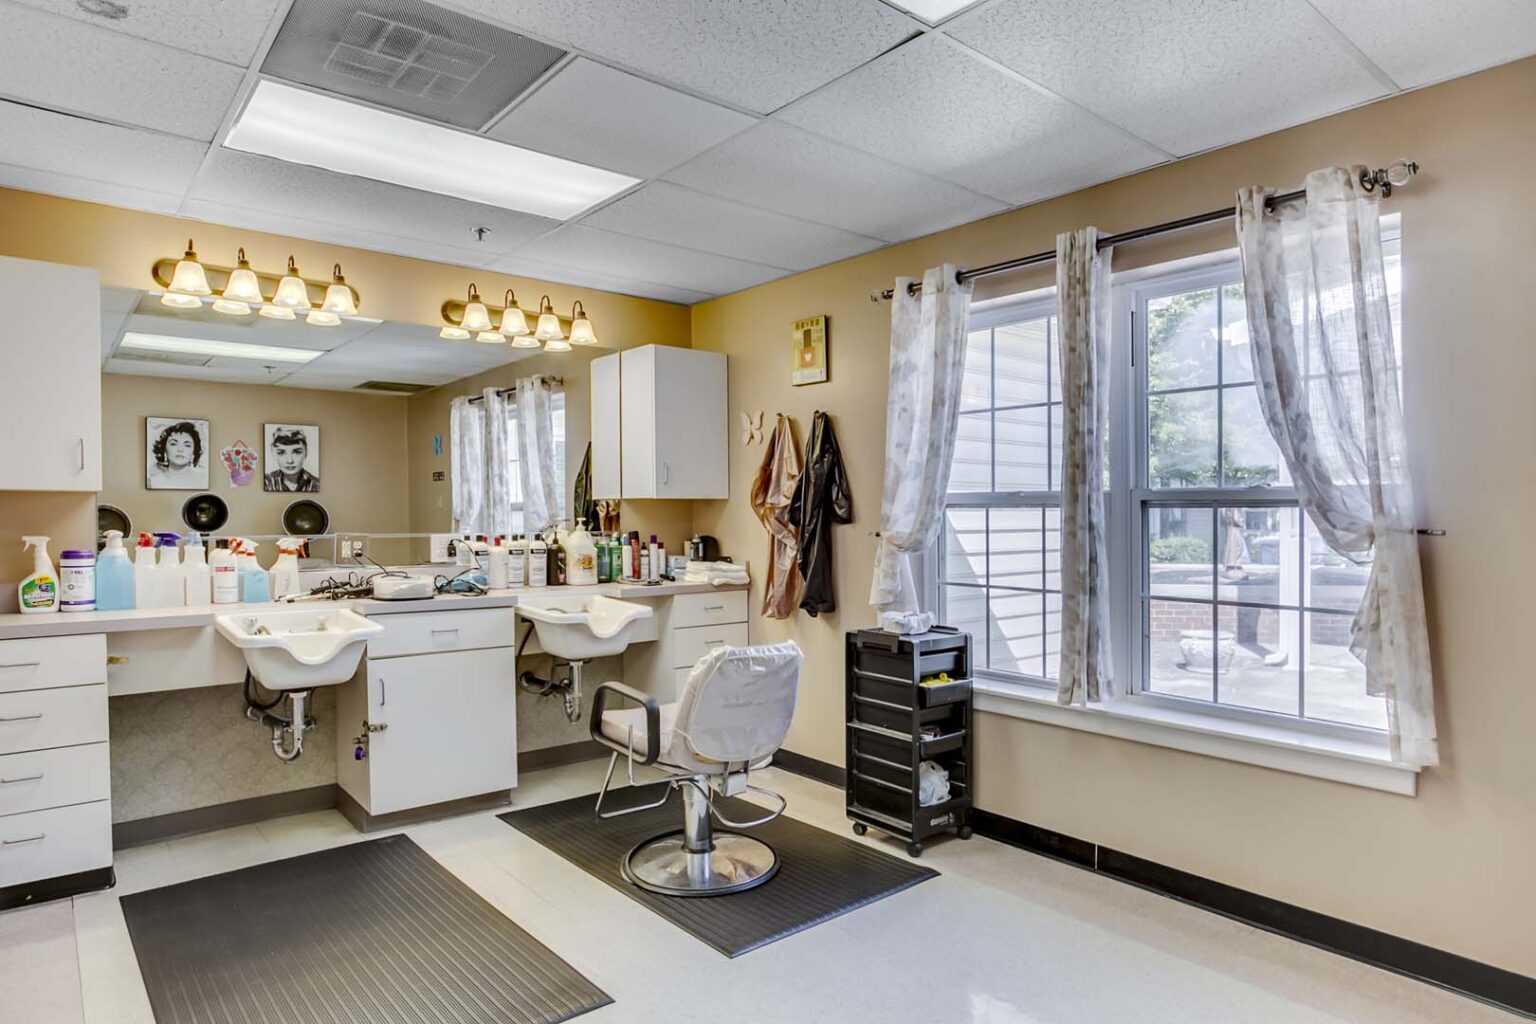
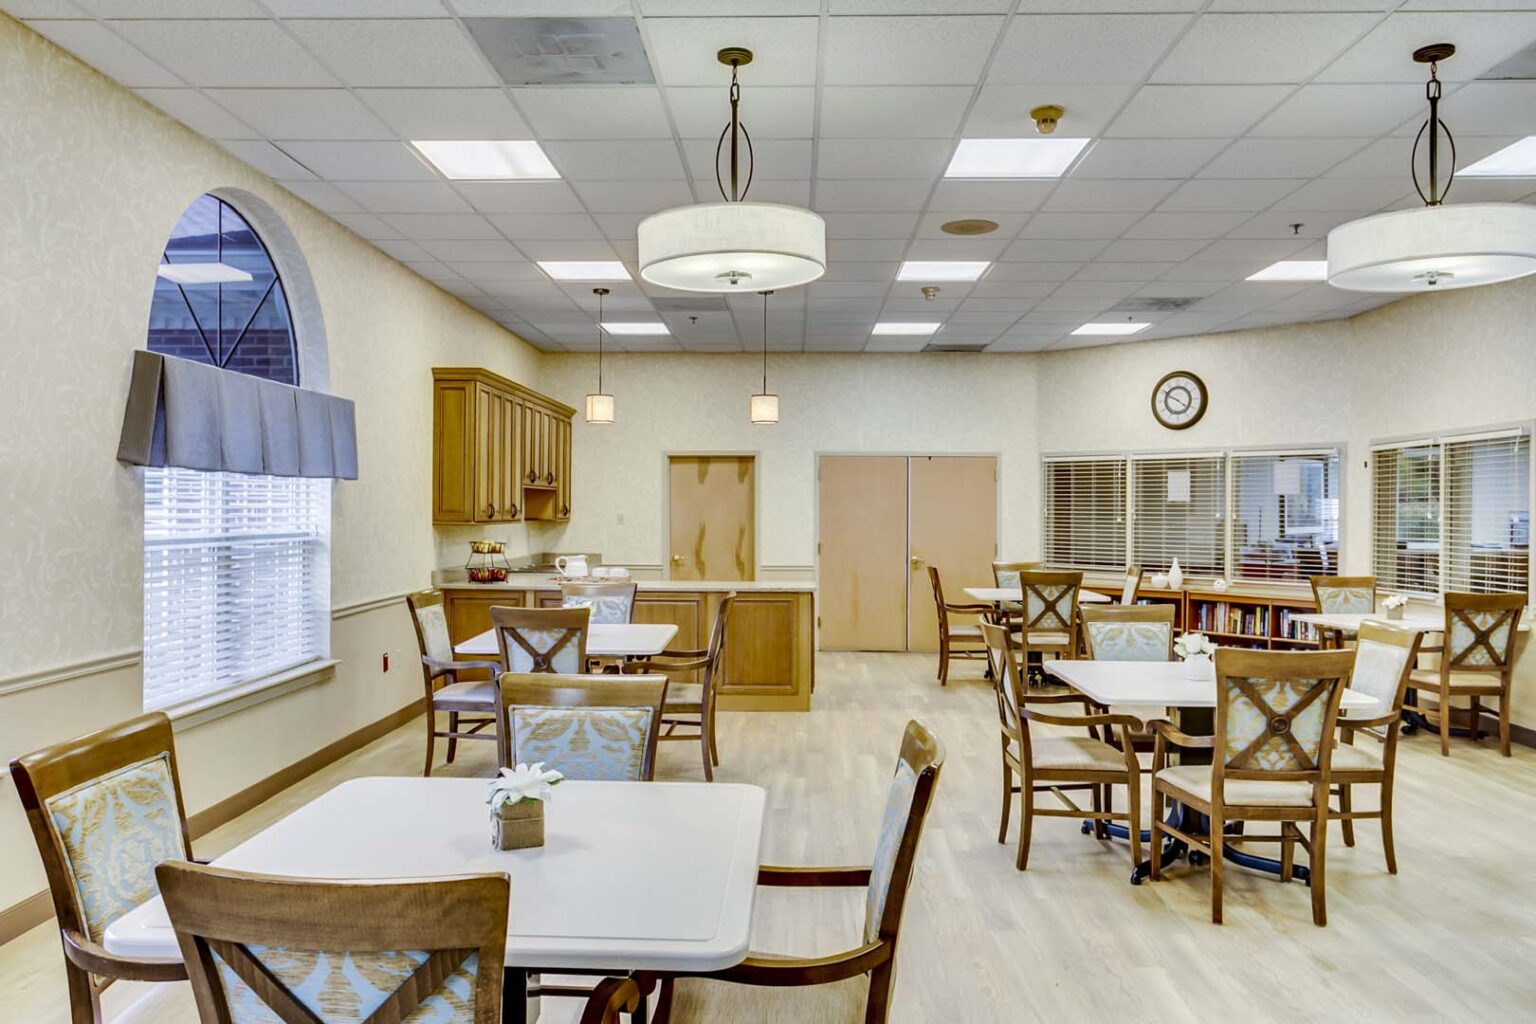
This community offers large, semi-private rooms with TVs and free Wi-Fi. They have a dietary program that focuses on providing proper nutrition to aid in disease prevention, illness recovery, and overall health. Residents can also take advantage of their spacious outdoor seating, their large dining room, and their private dining room, as well as ample and convenient parking for guests and families.

(302) 734-1199

Quality ratings

Measured by Centers for Medicare & Medicaid Services (CMS)

Overall rating Info The Overall CMS Rating combines results from health inspections, staffing levels and quality measures. Health inspections carry the most weight. Staffing and quality scores can increase or decrease the final rating based on performance compared to state and national standards.
3/5
Delaware average: 3.3/5
Health Inspection Info Based on the results of the facility's three most recent standard inspections and any complaint investigations. CMS reviews the number, scope, and severity of deficiencies, with more recent findings weighted more heavily.
3/5
Delaware average: 2.7/5
Staffing Info Measures average nursing staff hours per resident per day, including Registered Nurses (RNs) and total nursing staff. Ratings are adjusted based on the level of care residents require and are compared to state and national benchmarks.
4/5
Delaware average: 4.0/5
Quality Measures Info Based on clinical and physical health indicators reported to CMS, such as hospital readmissions, falls, pressure ulcers, and improvements in mobility. These measures reflect how well residents' health needs are being managed.
4/5
Delaware average: 4.2/5

Nursing care per resident

Info This shows how many total hours of nursing staff time are available per resident each day. Higher numbers usually mean more staff support.
4h 14m per day

This home provides 10% less nursing time per resident than the Delaware average.

Delaware average: 4h 43m per day

Staffing hours breakdown

Info Hours of care per resident per day, broken down by staff type. Data from CMS Medicare.
Staff type Facility State avg National avg
Registered Nurse (RN) Info Registered nurse hours per resident per day. 41m per day 1h 2m per day 41m per day
Nurse Aide Info Nurse aide hours per resident per day. 2h 15m per day 2h 28m per day 2h 21m per day
Total Nursing (Weekend) Info Total number of nurse staff hours per resident per day on weekends. 3h 35m per day 4h 2m per day 3h 26m per day
Physical Therapist Info Physical therapist staff hours per resident per day. 6m per day 9m per day 4m per day
RN (Weekend) Info Registered nurse hours per resident per day on weekends. 25m per day 43m per day 29m per day

Capacity and availability

Medium-capacity home

Offers a balance of services and community atmosphere.

Total beds 120

This home usually has availability

Lower occupancy suggests more openings may be available.

Lower demand than the Delaware average
Occupancy rate 84.2%
Residents per day (avg) 105
Occupancy rate
84.2%
Residents per day (avg)
105

Who this home usually serves

TYPE OF STAY

Mix of rehab and long-term care

This home supports both short-term rehab and long-term care, with residents staying for a wide range of durations.

Breakdown by payment type

Medicare

37% of new residents, usually for short-term rehab.

Typical stay 1 - 2 months

Private pay

48% of new residents, often for short stays.

Typical stay 1 months

Medicaid

15% of new residents, often for long-term daily care.

Typical stay 1 - 2 years

Finances and operations

Privately-owned community
Operated by a business corporation.
Home revenue
$22.3M
Profit
$30.1K
Privately-owned community Operated by a business corporation.
Home revenue
$22,279,501.00
Profit
$30,089.00
Payroll costs Info The portion of the home's budget spent on staff, including nurses, caregivers, and other employees who support care and operations.
$5.8M
26.1% of revenue
Other operating costs Info All remaining costs needed to run the home, such as food, utilities, building maintenance, supplies and administrative expenses.
$16.4M
Total costs $22.2M
Bed community size
120-bed community
A larger shared setting that may offer more common spaces and organized community services.
Years in operation
1 year in operation
A newer community that may feature more recent facilities and programs.
Walk Score
Walk Score: 32 / 100
Somewhat walkable. A few nearby services may be reachable on foot, but most trips require transportation.

About this community

Occupancy

Occupancy rate
84%
In line with Delaware average
Occupied beds
101 / 120
Average residents 86 per day

License details

Facility type
Nursing Home
Issuance January 4, 2025
Expiration March 31, 2026

Additional licensing details

License number: 1022

Ownership & operating entity

Cadia Healthcare Capitol Healthcare is administrated by Sally Miller.

Staffing

Key information about the people who lead and staff this community.

Leadership

Director of Nursing: Sandra Petronis- Interim
Director of Nursing email: [email protected]
Administrator email: [email protected]

Care Services

Nursing Services
Rehabilitation Services
Memory Care
Skilled Nursing
Licensed Nurses/CNAs
24-Hour Staffing

Amenities & Lifestyle

Large semi-private rooms
Televisions and phones in every room
Free Wi-Fi
Large dining room and private family dining room
Spacious outdoor seating
Ample and convenient parking for families and visitors

Programs & Activities

Activities
We offer resident-centered activity programs every day to keep you socially engaged while having fun.
Specific Programs
Rehabilitation Program, Nursing Program, Dietary Program, Activities Program, Care Transitions/Discharge Program

Dining & Nutrition

Food Description
Chef inspired nutritious entrees made from fresh and seasonal ingredients

Types of Care at Cadia Healthcare Capitol Healthcare

Nursing Home
Contact Cadia Healthcare Capitol Healthcare

Inspection History

In Delaware, the Department of Health and Social Services, Division of Health Care Quality is responsible for the oversight, unannounced inspection, and licensing of all long-term care settings.

8 visits/inspections

Latest inspection

Date:November 18, 2025
Type:Complaint Investigation

91 deficiencies

Deficiencies indicate regulatory issues. A higher number implies the facility had several areas requiring improvement.

Inspection Report Summary for Cadia Healthcare Capitol Healthcare

The most recent inspection on November 18, 2025 found no deficiencies during an unannounced complaint investigation. Earlier inspections showed a pattern of deficiencies related to resident safety, abuse prevention, call light accessibility, food safety, and emergency preparedness. Complaint investigations substantiated issues including inadequate supervision leading to resident injury, failure to prevent and report abuse, and staffing shortages, with one immediate jeopardy finding during a COVID-19 outbreak that was later abated. Enforcement actions such as fines or license suspensions were not listed in the available reports. The facility’s record shows some improvement over time, with the latest survey indicating compliance after previous citations.

Health Inspection History

Inspections
Total health inspections 4

Delaware average 4.4


Last Health inspection on Dec 2024

Total health citations 36

Delaware average 38.9

Citations per inspection
9

Delaware average 8.72


Health citations are formal notices following inspections when they fail to comply with safety and care standards.

23 of 36 citations resulted from standard inspections; 2 of 36 resulted from complaint investigations; and 11 of 36 came from combined inspections (standard and complaint).

Breakdown of citation severity (last 3 years)
Critical Health citations More info 0
100% better than Delaware average

Delaware average: 0.9


Serious Health citations More info 1
17% better than Delaware average

Delaware average: 1.2

0 critical citations More info Delaware average: 0.9

1 serious citation More info Delaware average: 1.2

35 moderate citations More info Delaware average: 35.7

0 minor citations More info Delaware average: 1
Citations history (last 3 years)
Abuse/Neglect moderate citation Info Issues related to protecting resident's from harm, including abuse, neglect, or mistreatment. Dec 12, 2024
Corrected

Abuse/Neglect moderate citation Info Issues related to protecting resident's from harm, including abuse, neglect, or mistreatment. Dec 12, 2024
Corrected

Abuse/Neglect moderate citation Info Issues related to protecting resident's from harm, including abuse, neglect, or mistreatment. Dec 12, 2024
Corrected

Environmental moderate citation Info Issues related to building safety, cleanliness, maintenance, and overall living conditions. Dec 12, 2024
Corrected

Compare Nursing Homes around Dover The information below is reported by the Delaware Department of Health and Social Services, Division of Health Care Quality.

2 facilities compared · CMS & DE Dept. of Health data · Updated Mar 2026

The Center at Eden Hill
NH

Nursing Home Licensed facility providing 24/7 skilled nursing care for residents with complex, ongoing medical needs. Staffed by RNs, LPNs, and CNAs. Inspected and star-rated annually by CMS. Accepts Medicare (short-term rehab) and Medicaid (long-term care).

Dover
80
89.3%
+11%
4.54
+4%
-2%
0
21
0
73
48
-
$24,0M
$5,8M
24%
85057
Cadia Healthcare Capitol Healthcare
NH

Nursing Home Licensed facility providing 24/7 skilled nursing care for residents with complex, ongoing medical needs. Staffed by RNs, LPNs, and CNAs. Inspected and star-rated annually by CMS. Accepts Medicare (short-term rehab) and Medicaid (long-term care).

Dover
120
88.9%
+10%
4.24
-28%
-9%
1
36
1
105
32
Schafer, Eric
$22,2M
$5,8M
26.2%
85048

Places of interest near Cadia Healthcare Capitol Healthcare

Address 2.5 miles from city center — 0.57 miles to nearest hospital (PAM Health Rehabilitation Hospital of Dover)

Address 1225 Walker Rd, Dover, DE 19904

Calculate Travel Distance to Cadia Healthcare Capitol Healthcare

Add your location

Address

Staffing Data (Q2 2025)

This data corresponds to Q2 2025 and is based on CMS Payroll-Based Journal.

Total staff 173
Employees 167
Contractors 6
Staff to resident ratio 1.59:1
0% compared with Delaware average

Delaware average ratio: 1.61:1

Avg staff/day 64
Average shift 7.6 hours
0% compared with Delaware average

Delaware average: 7.6 hours

Total staff hours (quarter) 44,107
Nursing staff breakdown
Registered Nurse

Manages medical care and health needs.

Total count 16
Average shift length Info Average shift length. Calculated as total hours divided by days worked and average staff per day. 7.2 hours

This role is partially covered by contractors.

Licensed Practical Nurse

Assists with medical care and medications.

Total count 29
Average shift length Info Average shift length. Calculated as total hours divided by days worked and average staff per day. 7.7 hours

No contractors work on this role.

Certified Nursing Assistant

Helps with daily care and mobility.

Total count 77
Average shift length Info Average shift length. Calculated as total hours divided by days worked and average staff per day. 7.4 hours

No contractors work on this role.

Contractor staffing

Total hours from contractors

1.7%

735 contractor hours this quarter

Registered Nurse: 2 Administrator: 1 Respiratory Therapy Technician: 1 Occupational Therapy Assistant: 1 Medical Director: 1
Staff by category
Certified Nursing Assistant7707720,55691100%7.4
Licensed Practical Nurse290297,37791100%7.7
Clinical Nurse Specialist9093,17691100%8.6
Registered Nurse142162,79891100%7.2
Other Dietary Services Staff4041,82491100%7.6
RN Director of Nursing4041,8197987%9.5
Physical Therapy Aide7071,1377785%7.2
Speech Language Pathologist6061,0647987%7.7
Physical Therapy Assistant5059497380%7.7
Respiratory Therapy Technician6178737481%5.7
Mental Health Service Worker2027326268%8
Administrator0114816066%8
Nurse Practitioner1014725965%8
Qualified Social Worker2024195965%6.2
Occupational Therapy Aide1013043943%7.8
Medical Director011671415%4.8
Occupational Therapy Assistant011611314%4.7
77 Certified Nursing Assistant
% of Days 100%
29 Licensed Practical Nurse
% of Days 100%
9 Clinical Nurse Specialist
% of Days 100%
16 Registered Nurse
% of Days 100%
4 Other Dietary Services Staff
% of Days 100%
4 RN Director of Nursing
% of Days 87%
7 Physical Therapy Aide
% of Days 85%
6 Speech Language Pathologist
% of Days 87%
5 Physical Therapy Assistant
% of Days 80%
7 Respiratory Therapy Technician
% of Days 81%
2 Mental Health Service Worker
% of Days 68%
1 Administrator
% of Days 66%
1 Nurse Practitioner
% of Days 65%
2 Qualified Social Worker
% of Days 65%
1 Occupational Therapy Aide
% of Days 43%
1 Medical Director
% of Days 15%
1 Occupational Therapy Assistant
% of Days 14%

Facility Characteristics

Source: CMS Long-Term Care Facility Characteristics (Data as of Jan 2026)

Total census
109 residents
Residents by payment source
Medicare
11 residents (10.1%)
Medicaid
80 residents (73.4%)
Private pay or other
18 residents (16.5%)
Programs & Services
Residents' Group

Residents meet regularly to discuss policies, care quality, and activities

Active Resident Council

Organized group of residents that meets regularly to discuss facility policies, quality of life, and activities.

Quality of care over time

These measures show how residents usually do over time at this home, based on health outcomes and preventive care.

High-risk clinical events score Info A composite score based on pressure ulcers, falls with injury, weight loss, walking ability decline, and activities of daily living decline. 7.7
19% better than Delaware average

Delaware average: 9.6

Functional decline score Info A composite score based on activities of daily living decline, walking ability decline, and incontinence. 17.9
6% better than Delaware average

Delaware average: 19.0

Long-stay resident measures
Significantly above average Delaware avg: 4.6 Info CMS star rating based on long-stay quality measure performance. 5 stars = significantly above average, 1 star = significantly below average.
Need for Help with Daily Activities Increased Info Percent of long-stay residents whose need for help with daily activities has increased 13.3%
14% better than Delaware average

Delaware average: 15.4%

Walking Ability Worsened Info Percent of long-stay residents whose ability to move independently worsened 14.3%
28% better than Delaware average

Delaware average: 19.8%

Low Risk Residents with Bowel/Bladder Incontinence Info Percent of low risk long-stay residents who lose control of their bowels or bladder 26.1%
18% worse than Delaware average

Delaware average: 22.1%

Falls with Major Injury Info Percent of long-stay residents experiencing one or more falls with major injury 2.3%
22% better than Delaware average

Delaware average: 3.0%

High Risk Residents with Pressure Ulcers Info Percent of long-stay high risk residents with pressure ulcers 3.2%
29% better than Delaware average

Delaware average: 4.4%

Urinary Tract Infection Info Percent of long-stay residents with a urinary tract infection 2.1%
In line with Delaware average

Delaware average: 2.1%

Lost Too Much Weight Info Percent of long-stay residents who lose too much weight 5.6%
In line with Delaware average

Delaware average: 5.8%

Depressive Symptoms Info Percent of long-stay residents who have depressive symptoms 0.3%
95% better than Delaware average

Delaware average: 6.0%

Antipsychotic Use Info Percent of long-stay residents who received an antipsychotic medication 8.6%
22% better than Delaware average

Delaware average: 11.0%

Pneumococcal Vaccine Info Percent of long-stay residents assessed and appropriately given the pneumococcal vaccine 99.8%
5% better than Delaware average

Delaware average: 95.3%

Influenza Vaccine Info Percent of long-stay residents assessed and appropriately given the seasonal influenza vaccine 75.2%
23% worse than Delaware average

Delaware average: 97.4%

Hospitalizations per 1,000 days Info Number of hospitalizations per 1,000 long-stay resident days. 2.13
16% worse than Delaware average

Delaware average: 1.83

ED visits per 1,000 days Info Number of outpatient emergency department visits per 1,000 long-stay resident days. 1.01
26% better than Delaware average

Delaware average: 1.37

Short-stay resident measures
Average Delaware avg: 3.6 Info CMS star rating based on short-stay quality measure performance. 5 stars = much above average, 1 star = much below average.
Pneumococcal Vaccine Info Percent of short-stay residents assessed and appropriately given the pneumococcal vaccine 98.1%
19% better than Delaware average

Delaware average: 82.1%

Antipsychotic medication increase Info Percent of short-stay residents who newly received an antipsychotic medication 0.5%
43% better than Delaware average

Delaware average: 0.9%

Influenza Vaccine Info Percent of short-stay residents assessed and appropriately given the seasonal influenza vaccine 18.7%
78% worse than Delaware average

Delaware average: 83.1%

Re-hospitalized after SNF stay Info Percentage of short-stay residents who were re-hospitalized after their nursing home admission. 22.5%
5% worse than Delaware average

Delaware average: 21.5%

Emergency department visits Info Percentage of short-stay residents who had an outpatient emergency department visit. 11.6%
In line with Delaware average

Delaware average: 11.2%

Falls with major injury Info Percentage of SNF residents who experience falls with major injury during their stay. 2.4%
217% worse than Delaware average

Delaware average: 0.8%

Ability to care for self at discharge Info Percentage of residents at or above expected ability to care for themselves at discharge. 38.5%
28% worse than Delaware average

Delaware average: 53.7%

Successful return to home or community Info Rate of successful return to home or community from a skilled nursing facility. 52.0%
In line with Delaware average

Delaware average: 50.6%

Penalties and fines

Federal penalties imposed by CMS for regulatory violations, including civil money penalties (fines) and denials of payment for new Medicare/Medicaid admissions.

Source: CMS Penalties Database (Data as of Jan 2026)

Total fines amount $8K
92% lower than Delaware average

Delaware average: $98K

Number of fines 1
46% fewer fines than Delaware average

Delaware average: 1.9

Payment Denials Info Serious action where Medicare and/or Medicaid temporarily stops payments for new residents until issues are fixed. 0
100% fewer payment denials than Delaware average

Delaware average: 0.2

Fines amount comparison
This facility $8K
Delaware average $98K
Penalty History

Penalties are imposed by CMS for violations of federal nursing home regulations.

Civil Money Penalty Info Fines imposed for noncompliance, which can be assessed per day or per instance of violation. Jul 16, 2024
$8K

Last updated: Jan 2026

Guides for Better Senior Living

Care Cost Calculator: See Prices in Your Area

Nursing Home Data Explorer

Don’t Wait Too Long: 7 Red Flag Signs Your Parent Needs Assisted Living Now

The True Cost of Assisted Living in 2025 – And How Families Are Paying For It

Understanding Senior Living Costs: Pricing Models, Discounts & Financial Assistance

Financial Aid for Delaware Seniors

Get financial aid guidance

Elderly and Disabled Waiver

Delaware Medicaid E&D Waiver

Age 65+ or disabled, Delaware resident, Medicaid- eligible, nursing home-level care need.

~$2,829/month (300% FBR, individual).

$2,000 (individual), $3,000 (couple).

Small state, faster processing in some areas.

Delaware Caregiver Support Program

DE Caregiver Support (NFCSP)

Caregiver of someone 60+, Delaware resident.

No strict limit; prioritizes low-income.

Not applicable.

Limited slots; rural focus.

Program of All-Inclusive Care for the Elderly (PACE)

Delaware Medicaid PACE

Age 55+, Delaware resident, nursing home-level care need, safe with PACE support.

~$2,829/month (300% FBR).

$2,000 (individual), $3,000 (couple).

Limited to specific areas (e.g., New Castle County); few providers.

Medicare Savings Program (MSP)

Delaware Medicare Savings Program

Age 65+ or disabled, Delaware resident, enrolled in Medicare Part A/B.

~$2,510/month (QMB), ~$3,380/month (SLMB), ~$3,598/month (QI)—individual, adjusted annually.

$9,430 (individual), $14,130 (couple).

Three tiers; broader limits than some states.

Senior Community Service Employment Program (SCSEP)

Delaware SCSEP (federally funded, state-administered)

Age 55+, unemployed, low-income, Delaware resident.

~$1,983/month (125% FPL, individual).

Not specified; income-focused.

Priority for veterans, rural residents; ~400 slots/year.