Camelot Nursing & Rehab Center
Nursing Home & Assisted Living · Farmington, MO
CMS overall rating Info CMS (the Centers for Medicare & Medicaid Services) is the federal agency that rates nursing home quality. Its Overall Rating runs from 1 to 5 stars, combining health inspections, staffing, and quality measures, with inspections weighted most heavily.

Camelot Nursing & Rehab Center

Nursing Home & Assisted Living · Farmington, MO
CMS overall rating Info CMS (the Centers for Medicare & Medicaid Services) is the federal agency that rates nursing home quality. Its Overall Rating runs from 1 to 5 stars, combining health inspections, staffing, and quality measures, with inspections weighted most heavily.
Calculator: See prices in your area
Camelot Nursing & Rehab Center accepts Medicare, Medicaid, and private pay.

Overview of Camelot Nursing & Rehab Center

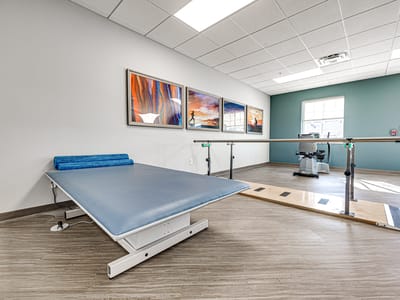
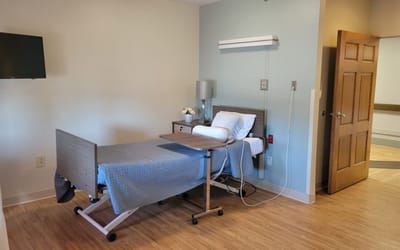
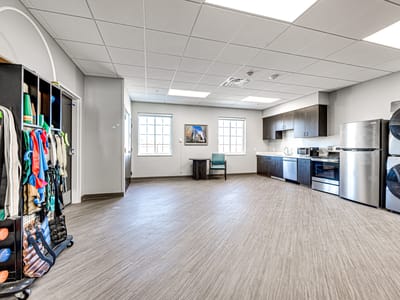
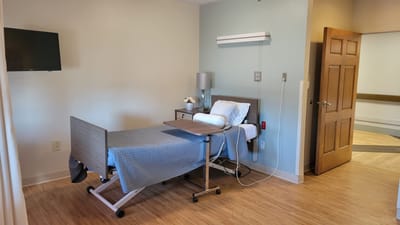
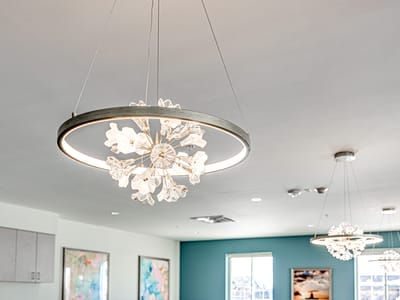
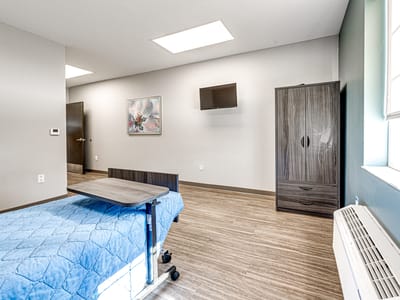
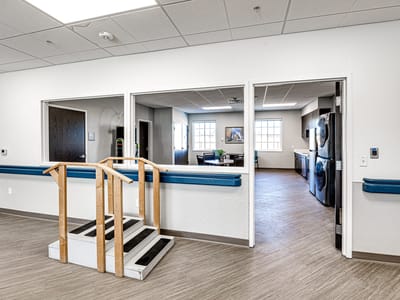
Camelot Nursing & Rehab Center is a highly rated nursing home in Farmington, MO, offering memory care, hospice care, rehabilitation, and skilled nursing. The community continuously promotes a supportive and welcoming environment dedicated to older adults’ comfort and healing. Residents also receive high-quality services, including nutritious meals, therapies, and 24-hour care, to help them focus on recovery and rehabilitation. Focusing on residents’ holistic wellness, personalized care plans are also provided.

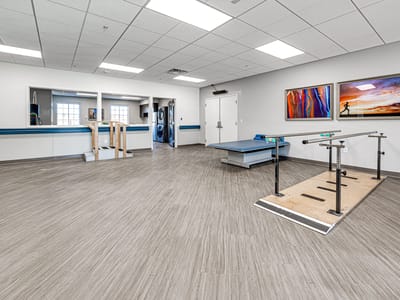
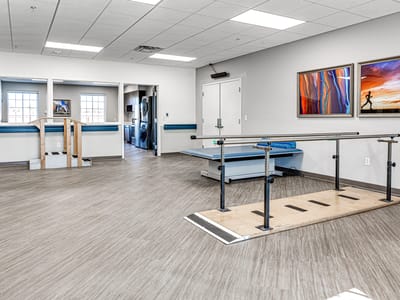
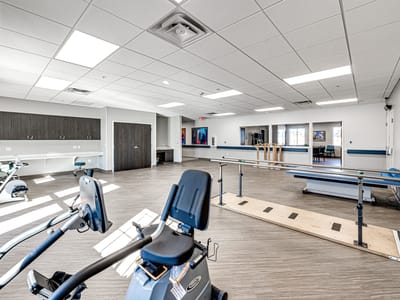
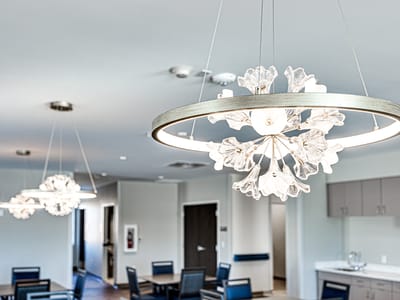
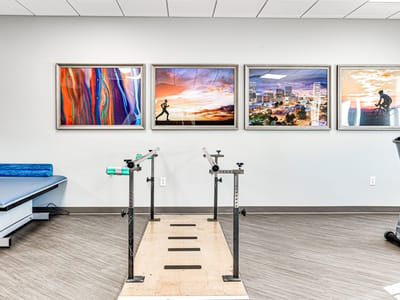
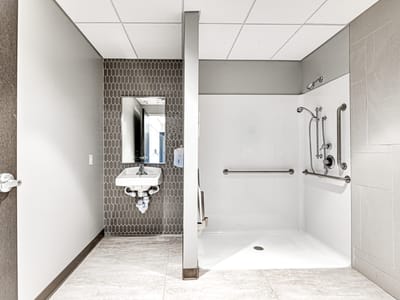
Light exercises, social events, and recreational activities enhance residents’ living experiences and encourage them to stay active. State-of-the-art rehabilitation equipment and accessible rooms also ensure residents can rest without hassles. Residents also have quick access to their necessities and leisure, with restaurants, shops, and a pharmacy nearby. This nursing home strives to help older adults live to their potential, making it one of the trusted options for senior living in Missouri.

Quality ratings

Measured by Centers for Medicare & Medicaid Services (CMS)

Overall rating Info The Overall CMS Rating combines results from health inspections, staffing levels and quality measures. Health inspections carry the most weight. Staffing and quality scores can increase or decrease the final rating based on performance compared to state and national standards.
▲ 101.3% Above MO avg. ▲ 101.3% Above MO avg.MO average: 2.5Click the badge to see the full State ranking.Click here to see the full State ranking.
Health Inspection Info Based on the results of the facility's three most recent standard inspections and any complaint investigations. CMS reviews the number, scope, and severity of deficiencies, with more recent findings weighted more heavily.
▲ 80.2% Above MO avg. ▲ 80.2% Above MO avg.MO average: 2.8Click the badge to see the full State ranking.Click here to see the full State ranking.
Staffing Info Measures average nursing staff hours per resident per day, including Registered Nurses (RNs) and total nursing staff. Ratings are adjusted based on the level of care residents require and are compared to state and national benchmarks.
▼ 8.6% Below MO avg. ▼ 8.6% Below MO avg.MO average: 2.2Click the badge to see the full State ranking.Click here to see the full State ranking.
Quality Measures Info Based on clinical and physical health indicators reported to CMS, such as hospital readmissions, falls, pressure ulcers, and improvements in mobility. These measures reflect how well residents' health needs are being managed.
▲ 50.5% Above MO avg. ▲ 50.5% Above MO avg.MO average: 2.7Click the badge to see the full State ranking.Click here to see the full State ranking.

Staffing hours breakdown

Info Daily nursing hours per resident by staff type, reported to CMS. Higher is generally better — compare this facility to state and national averages to see where staffing stands.

Hours per resident per day — compared to Missouri state averages

Total nursing care / resident Info This home is ranked 206th out of 282 homes in Missouri for nurse hours. Total adjusted nursing hours per resident per day, combining RN, LPN, and aide time. CMS adjusts this for case-mix so facilities can be fairly compared.
3h 18m per day
Rank #206 / 282Nurse hours — State benchmarkedThis home is ranked 206th out of 282 homes in Missouri. Shows adjusted nurse hours per resident per day benchmarked to the Missouri average, with a ranking across 282 Missouri facilities. More hours mean more direct care. The national average is about 3.5 hrs; below 3.0 is a red flag.Rankings are based only on facilities in Missouri that report data for that category. Facilities without available data are excluded from the ranking.Click the rank badge to see the full State ranking.Click here to see the full State ranking.
This facility Missouri avg (3h 44m per day)
vs Missouri avg
-12%

1 of 6 metrics below state avg

Standout metric Registered Nurse (RN) is +61% above state avg
Staff typeHours / Day / Residentvs state avg
Registered Nurse (RN) Info RNs hold the highest nursing license and can assess residents, interpret test results, and direct care plans. More RN hours per day often signals stronger clinical oversight and faster response to health changes. 44m per day ▲ 61% State avg: 28m per day · National avg: 41m per day
LPN / LVN Info Licensed Practical Nurses (LPNs) or Licensed Vocational Nurses (LVNs) deliver routine hands-on care — medication administration, wound dressing, and monitoring vital signs. They work under RN supervision and make up a large share of daily bedside care. 44m per day ▲ 8% State avg: 41m per day · National avg: 52m per day
Nurse Aide Info Certified Nurse Aides (CNAs) provide the most direct day-to-day assistance: bathing, dressing, feeding, and mobility. Nurse aide hours are typically the largest staffing category and directly affect residents' quality of life. 2h 42m per day ▲ 17% State avg: 2h 19m per day · National avg: 2h 20m per day
Weekend Total Nursing Info Combined nursing hours (RN + LPN + Nurse Aide) per resident per day on weekends. Staffing often drops on weekends — this figure reveals whether the facility maintains adequate coverage outside of weekday hours. 3h 18m per day ▲ 8% State avg: 3h 3m per day · National avg: 3h 27m per day
Physical Therapist Info Hours per resident per day provided by licensed Physical Therapists (PTs) or PT Assistants. PT services help residents recover mobility after injury or illness and are especially important for post-acute (short-stay) rehabilitation. 2m per day ▼ 12% State avg: 3m per day · National avg: 4m per day
Weekend RN Info Registered nurse hours specifically on weekends. Facilities sometimes reduce RN presence on Saturdays and Sundays — a low weekend RN figure compared to weekday hours can indicate reduced clinical oversight when most administrative staff are absent. 30m per day ▲ 53% State avg: 20m per day · National avg: 29m per day

Capacity and availability

This home usually has availability

Higher occupancy than the Missouri average: 66.6%
Occupancy rate
73% Rank #167 / 434Occupancy rate — State benchmarkedThis home is ranked 167th out of 434 homes in Missouri. Shows this facility's occupancy rate versus the Missouri average, with its Statewide rank out of 434. Higher occupancy signals strong local demand and financial stability.Rankings are based only on facilities in Missouri that report data for that category. Facilities without available data are excluded from the ranking.Click the rank badge to see the full State ranking.Click here to see the full State ranking.
Avg. Length of Stay
85 days
Bed community size
97-bed community Rank #197 / 454Bed count — State benchmarkedThis home is ranked 197th out of 454 homes in Missouri. Shows this facility's certified or reported bed count compared to other Missouri facilities. Larger communities may offer more amenities, programs, and on-site services for residents and families.Rankings are based only on facilities in Missouri that report data for that category. Facilities without available data are excluded from the ranking.Click the rank badge to see the full State ranking.Click here to see the full State ranking.
A larger shared setting that may offer more common spaces and organized community services.
Walk Score
Walk Score: 55 / 100 Rank #189 / 563Walk Score — State benchmarkedThis home is ranked 189th out of 563 homes in Missouri. Shows how walkable this facility's neighborhood is compared to the average Walk Score across Missouri facilities. Higher scores benefit residents, families, and staff.Rankings are based only on facilities in Missouri that report data for that category. Facilities without available data are excluded from the ranking.Click the rank badge to see the full State ranking.Click here to see the full State ranking.
Moderately walkable. Some errands can be accomplished on foot, with a mix of nearby amenities.

Safety & Compliance

Wheelchair Accessible

Therapy & Rehabilitation

3 services
Rehabilitation Services
Respite Care
Short-Term Rehab

Additional Policies & Features

Pets Allowed

Amenities & Lifestyle

Shuttle
Wellness Program
Specific Programspersonalized therapy programs, exercise classes, art workshops, social events

Contact Camelot Nursing & Rehab Center

Staffing Data

Reporting period: October 1 – December 31, 2025 (Q4 2025). Source: CMS Payroll-Based Journal report.

Total staff 107
Employees 91
Contractors 16
Staff to resident ratio 1.65 : 1
0% compared with Missouri average
Missouri average ratio: 1.69 : 1 Missouri average ratio: 1.69 : 1See full Missouri ranking
Avg staff/day 38
Average shift 8.6 hours
6% better than Missouri average
Missouri average: 8.1 hours Missouri average shift: 8.1 hoursSee full Missouri ranking
Total staff hours (quarter) 30,177

Nursing staff breakdown

Q4 2025 · Oct 1 – Dec 31 More info This data comes from the CMS Payroll-Based Journal report covering October 1 – December 31, 2025.
Registered Nurse

Manages medical care and health needs.

RN Staff Info All 7 RN Staff are full-time employees. No contractors work on this role. 7
Average shift length Info Average shift length. Calculated as total hours divided by days worked and average staff per day. 9.5 hours
Licensed Practical Nurse

Assists with medical care and medications.

LPN Staff Info All 8 LPN Staff are full-time employees. No contractors work on this role. 8
Average shift length Info Average shift length. Calculated as total hours divided by days worked and average staff per day. 10.2 hours
Certified Nursing Assistant

Helps with daily care and mobility.

CNA Staff Info All 42 CNA Staff are full-time employees. No contractors work on this role. 42
Average shift length Info Average shift length. Calculated as total hours divided by days worked and average staff per day. 9 hours

Contractor staffing

Q4 2025 · Oct 1 – Dec 31 More info This data comes from the CMS Payroll-Based Journal report covering October 1 – December 31, 2025.

Total hours from contractors

6.1%

1,827 contractor hours this quarter

Speech Language Pathologist: 4 Physical Therapy Aide: 3 Respiratory Therapy Technician: 3 Physical Therapy Assistant: 2 Qualified Social Worker: 2 Medical Director: 1 Occupational Therapy Assistant: 1

Staff by category

Q4 2025 · Oct 1 – Dec 31 More info This data comes from the CMS Payroll-Based Journal report covering October 1 – December 31, 2025.
Certified Nursing Assistant4204214,02492100%9
Licensed Practical Nurse8083,00692100%10.2
Clinical Nurse Specialist4042,3268795%8.2
Medication Aide/Technician6062,2429098%10.6
Registered Nurse7072,19592100%9.5
RN Director of Nursing5051,7679199%8.6
Nurse Aide in Training130131,3898693%9.3
Administrator1014966267%8
Mental Health Service Worker1014686065%7.8
Physical Therapy Aide0334406874%6
Speech Language Pathologist0444326166%5.8
Physical Therapy Assistant0223706470%5.7
Nurse Practitioner2023023740%8.2
Qualified Social Worker0222706975%3.9
Respiratory Therapy Technician0332645661%4.6
Dietitian101975054%1.9
Occupational Therapy Aide1014055%8
Medical Director011261314%2
Occupational Therapy Assistant0112433%8
42 Certified Nursing Assistant
% of Days 100%
8 Licensed Practical Nurse
% of Days 100%
4 Clinical Nurse Specialist
% of Days 95%
6 Medication Aide/Technician
% of Days 98%
7 Registered Nurse
% of Days 100%
5 RN Director of Nursing
% of Days 99%
13 Nurse Aide in Training
% of Days 93%
1 Administrator
% of Days 67%
1 Mental Health Service Worker
% of Days 65%
3 Physical Therapy Aide
% of Days 74%
4 Speech Language Pathologist
% of Days 66%
2 Physical Therapy Assistant
% of Days 70%
2 Nurse Practitioner
% of Days 40%
2 Qualified Social Worker
% of Days 75%
3 Respiratory Therapy Technician
% of Days 61%
1 Dietitian
% of Days 54%
1 Occupational Therapy Aide
% of Days 5%
1 Medical Director
% of Days 14%
1 Occupational Therapy Assistant
% of Days 3%

Penalties and fines

Federal penalties imposed by CMS for regulatory violations, including civil money penalties (fines) and denials of payment for new Medicare/Medicaid admissions.

Source: CMS Penalties Database

No penalties in the past 3 years

No civil money penalties or payment denials were reported in the last 3 years.

Quality of care over time

These measures show how residents usually do over time at this home, based on health outcomes and preventive care.

High-risk clinical events score Info A composite score based on pressure ulcers, falls with injury, weight loss, walking ability decline, and activities of daily living decline. 5.8
47% better than Missouri average

Missouri average: 10.9

Functional decline score Info A composite score based on activities of daily living decline, walking ability decline, and incontinence. 12.1
38% better than Missouri average

Missouri average: 19.5

Long-stay resident measures
Need for Help with Daily Activities Increased Info Percent of long-stay residents whose need for help with daily activities has increased 7.0%
65% better than Missouri average

Missouri average: 19.8%

Walking Ability Worsened Info Percent of long-stay residents whose ability to move independently worsened 4.7%
77% better than Missouri average

Missouri average: 20.6%

Low Risk Residents with Bowel/Bladder Incontinence Info Percent of low risk long-stay residents who lose control of their bowels or bladder 24.6%
36% worse than Missouri average

Missouri average: 18.1%

Falls with Major Injury Info Percent of long-stay residents experiencing one or more falls with major injury 3.7%
9% better than Missouri average

Missouri average: 4.0%

High Risk Residents with Pressure Ulcers Info Percent of long-stay high risk residents with pressure ulcers 7.9%
57% worse than Missouri average

Missouri average: 5.0%

Urinary Tract Infection Info Percent of long-stay residents with a urinary tract infection 1.7%
37% better than Missouri average

Missouri average: 2.7%

Lost Too Much Weight Info Percent of long-stay residents who lose too much weight 5.8%
In line with Missouri average

Missouri average: 5.6%

Depressive Symptoms Info Percent of long-stay residents who have depressive symptoms 11.1%
14% better than Missouri average

Missouri average: 12.8%

Antipsychotic Use Info Percent of long-stay residents who received an antipsychotic medication 2.2%
90% better than Missouri average

Missouri average: 22.0%

Pneumococcal Vaccine Info Percent of long-stay residents assessed and appropriately given the pneumococcal vaccine 61.5%
28% worse than Missouri average

Missouri average: 85.2%

Influenza Vaccine Info Percent of long-stay residents assessed and appropriately given the seasonal influenza vaccine 65.2%
28% worse than Missouri average

Missouri average: 90.9%

Short-stay resident measures
Pneumococcal Vaccine Info Percent of short-stay residents assessed and appropriately given the pneumococcal vaccine 10.8%
84% worse than Missouri average

Missouri average: 66.6%

Antipsychotic medication increase Info Percent of short-stay residents who newly received an antipsychotic medication 0.0%
100% better than Missouri average

Missouri average: 2.2%

Influenza Vaccine Info Percent of short-stay residents assessed and appropriately given the seasonal influenza vaccine 20.7%
67% worse than Missouri average

Missouri average: 63.5%

Breakdown by payment type

Medicare

30% of new residents, usually for short-term rehab.

Typical stay 27 days

Private pay

33% of new residents, often for short stays.

Typical stay 1 - 2 months

Medicaid

38% of new residents, often for long-term daily care.

Typical stay 3 - 4 months

Facility Characteristics

Source: CMS Long-Term Care Facility Characteristics (Data as of Jan 2026)

Total residents 65
Medicare
5
7.7% of residents
Medicaid
50
76.9% of residents
Private pay or other
10
15.4% of residents
Programs & Services
Residents Group

Residents meet regularly to discuss policies, care quality, and activities

Nurse Aide Training

State-approved Nurse Aide Training and Competency Evaluation Program on-site

Active Resident Council

Organized group of residents that meets regularly to discuss facility policies, quality of life, and activities.

Finances and operations

Based on CMS SNF Cost Report for fiscal year ending in 12/2023.

For-profit
Operated by a single business entity.
Net patient revenue Info Net patient revenue — what the home actually collects for resident care, after contractual allowances, bad debt and discounts are subtracted from its gross charges (CMS cost report, Worksheet G-3). It covers resident care only; money the home earns from other sources is shown separately as "Other income."
$7.4M
Net patient income Info Net patient income: net patient revenue minus the home's total operating expenses. A positive figure means it earns more from resident care than it spends to deliver it; a negative figure means the opposite. It excludes non-operating "other income."
$733.1K
For-profit Operated by a single business entity.
Net patient revenue Info Net patient revenue — what the home actually collects for resident care, after contractual allowances, bad debt and discounts are subtracted from its gross charges (CMS cost report, Worksheet G-3). It covers resident care only; money the home earns from other sources is shown separately as "Other income."
$7.4M Rank #89 / 292Revenue — State benchmarkedThis home is ranked 89th out of 292 homes in Missouri. Shows this facility's annual revenue compared to the Missouri average. Higher revenue generally means more resources for staffing and capital — read alongside Payroll %.Rankings are based only on facilities in Missouri that report data for that category. Facilities without available data are excluded from the ranking.Click the rank badge to see the full State ranking.Click here to see the full State ranking.
Net patient income Info Net patient income: net patient revenue minus the home's total operating expenses. A positive figure means it earns more from resident care than it spends to deliver it; a negative figure means the opposite. It excludes non-operating "other income."
$733.1K
Other income Info Money the home earns outside of resident care — such as investments, grants, rentals and other non-operating sources (CMS cost report, Worksheet G-3). It is tracked separately from net patient revenue: it is not part of that figure, and it is not included in net patient income.
$16.5K
Payroll costs Info Staff salaries plus wage-related costs — benefits such as payroll taxes, health insurance and retirement — from the home's own accounting records (CMS cost report, Worksheet A). Contract or agency labor is counted separately, under other operating costs. Rank #136 / 292Payroll — State benchmarkedThis home is ranked 136th out of 292 homes in Missouri. Shows total annual staff payroll benchmarked to the Missouri average. Higher payroll investment relative to peers often signals better staffing and less reliance on cheaper contract labor.Rankings are based only on facilities in Missouri that report data for that category. Facilities without available data are excluded from the ranking.Click the rank badge to see the full State ranking.Click here to see the full State ranking.
$3.4M 46.4% of net patient revenue Info Payroll as a share of revenue: staff salaries and wage-related benefits divided by net patient revenue. A higher figure means more of each revenue dollar goes to staff pay. Rank #243 / 292Payroll % — State benchmarkedThis home is ranked 243rd out of 292 homes in Missouri. Shows payroll as a percentage of revenue versus the Missouri average. Well-run Missouri facilities typically land around 60–71% — the top third Statewide. Below 25% may signal understaffing or heavy agency use — read with Staffing ratings.Rankings are based only on facilities in Missouri that report data for that category. Facilities without available data are excluded from the ranking.Click the rank badge to see the full State ranking.Click here to see the full State ranking.
Other operating costs Info Everything it costs to run the home apart from payroll — food, utilities, supplies, maintenance, contract labor and administration. Calculated as total operating expense minus payroll (staff salaries and wage-related benefits).
$3.2M
Total costs Info The home's total operating expense for the year — all the costs of running it, salaries included (CMS cost report, Worksheet G-3).
$6.6M

What does this home offer?

Housing options icon

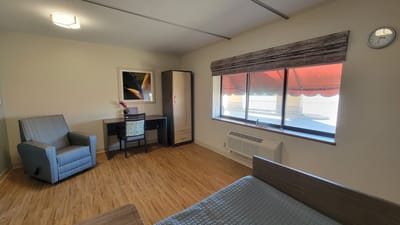
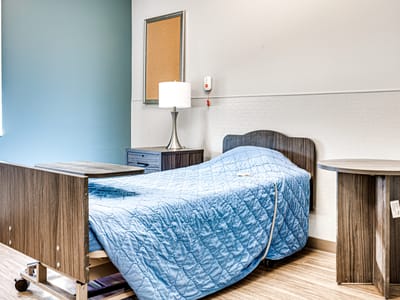
Housing Options: Shared Rooms

Building type icon
Building type icon

Building Type: Single-story

Social and recreational activities icon

Social and Recreational Activities

On-site medical care and health services icon

On-site Medical Care and Health Services

Who this home usually serves

TYPE OF STAY

Mostly long-term care residents

Most residents stay for extended periods and receive ongoing daily care.

New residents most often arrive under Medicaid (38% of admissions), and a typical Medicaid stay runs around 3 - 4 months.

Admissions
422 total

Coverage residents most often arrive under.

Medicare 30%
Private pay 33%
Medicaid 38%
Discharges
304 total

Coverage residents most often leave under.

Medicare 25%
Private pay 37%
Medicaid 38%

Places of interest near Camelot Nursing & Rehab Center

Address 1.5 miles from city center Info Estimated distance in miles from Farmington's city center to Camelot Nursing & Rehab Center's address, calculated via Google Maps.

Calculate Travel Distance to Camelot Nursing & Rehab Center

Add your location

Address

Compare Nursing Homes around Farmington

The information below is reported by the Missouri Department of Health and Senior Services, Division of Regulation and Licensure.

5 facilities compared · CMS & MO Dept. of Health data

Camelot Nursing & Rehab Center
NH
AL
Farmington (Sleepy Hollow Run)
97
Facility 97
MO AVG 97
Rank #197 / 454
73.0%
Facility 73.0%
MO AVG 66.6%
Rank #167 / 434
+10%
3.29
Facility 3.29
MO AVG 3.74
Rank #206 / 282
-16%-12%
$0
Facility $0
MO AVG $76.9k
Rank #1 / 289
12
Facility 12
MO AVG 36.5
Rank #30 / 287
4.0
Facility 4.0
MO AVG 5.7
Rank #77 / 287
-71-
55
Facility 55
MO AVG 45
Rank #189 / 563
Camelot Snf Investments, LLC
$7.4M
Facility $7.4M
MO AVG $8.4M
Rank #89 / 292
$3.4M
Facility $3.4M
MO AVG $3.3M
Rank #136 / 292
46.4%
Facility 46.4%
MO AVG 45.6%
Rank #243 / 292
265348
St Francois Manor
NH
HC
Farmington
158
Facility 158
MO AVG 97
Rank #44 / 454
--
5.97
Facility 5.97
MO AVG 3.74
Rank #6 / 282
-34%+60%
$0
Facility $0
MO AVG $76.9k
Rank #1 / 289
19
Facility 19
MO AVG 36.5
Rank #72 / 287
3.8
Facility 3.8
MO AVG 5.7
Rank #67 / 287
-17A+
77
Facility 77
MO AVG 45
Rank #53 / 563
Jennifer Simpson
$5.2M
Facility $5.2M
MO AVG $8.4M
Rank #190 / 292
$2.6M
Facility $2.6M
MO AVG $3.3M
Rank #144 / 292
50.8%
Facility 50.8%
MO AVG 45.6%
Rank #44 / 292
265674
Farmington Presbyterian Manor
NH
AL
IL
MC
Farmington
90
Facility 90
MO AVG 97
Rank #227 / 454
74.4%
Facility 74.4%
MO AVG 66.6%
Rank #155 / 434
+12%
4.58
Facility 4.58
MO AVG 3.74
Rank #44 / 282
+49%+23%
$12.6k
Facility $12.6k
MO AVG $76.9k
Rank #178 / 289
9
Facility 9
MO AVG 36.5
Rank #11 / 287
2.3
Facility 2.3
MO AVG 5.7
Rank #11 / 287
170A+
66
Facility 66
MO AVG 45
Rank #113 / 563
Jane Hull
$8.7M
Facility $8.7M
MO AVG $8.4M
Rank #75 / 292
$4.7M
Facility $4.7M
MO AVG $3.3M
Rank #53 / 292
53.6%
Facility 53.6%
MO AVG 45.6%
Rank #74 / 292
265583
Southbrook
NH
HC
Farmington
104
Facility 104
MO AVG 97
Rank #166 / 454
83.7%
Facility 83.7%
MO AVG 66.6%
Rank #87 / 434
+26%
4.33
Facility 4.33
MO AVG 3.74
Rank #68 / 282
+22%+16%
$0
Facility $0
MO AVG $76.9k
Rank #1 / 289
14
Facility 14
MO AVG 36.5
Rank #41 / 287
7.0
Facility 7.0
MO AVG 5.7
Rank #222 / 287
-89-
39
Facility 39
MO AVG 45
Rank #329 / 563
-
$8.4M
Facility $8.4M
MO AVG $8.4M
Rank #98 / 292
$5.1M
Facility $5.1M
MO AVG $3.3M
Rank #80 / 292
61.2%
Facility 61.2%
MO AVG 45.6%
Rank #81 / 292
265389
Community Manor
NH
HC
MC
PC
RC
Farmington
99
Facility 99
MO AVG 97
Rank #186 / 454
98.0%
Facility 98.0%
MO AVG 66.6%
Rank #12 / 434
+47%
2.68
Facility 2.68
MO AVG 3.74
Rank #253 / 282
+4%-28%
$0
Facility $0
MO AVG $76.9k
Rank #1 / 289
28
Facility 28
MO AVG 36.5
Rank #125 / 287
7.0
Facility 7.0
MO AVG 5.7
Rank #222 / 287
-93-
77
Facility 77
MO AVG 45
Rank #53 / 563
Miss Ouri Nursing & Rehab, LLC
$8.1M
Facility $8.1M
MO AVG $8.4M
Rank #95 / 292
$4.1M
Facility $4.1M
MO AVG $3.3M
Rank #78 / 292
50.7%
Facility 50.7%
MO AVG 45.6%
Rank #94 / 292
265798

Financial Assistance for
Nursing Home in Missouri

Camelot Nursing & Rehab Center is located in Farmington, Missouri.
Here are the financial assistance programs available to residents in Missouri.

Get Financial aid guidance

Aged and Disabled Waiver

Missouri Medicaid A&D Waiver

Age 65+ or disabled
General Missouri resident, Medicaid- eligible, nursing home-level care need.
Income Limits (2025) ~$2,829/month 300% FBR, individual
Asset Limits $2,000 (individual), $3,000 (couple).
MO

Rural access prioritized.

Benefits
Personal care (5-7 hours/day) Respite (240 hours/year) Adult day care (~$65/day) Home health services

Missouri Supplemental Nursing Care (SNC)

MO SNC

Age 65+
General Missouri resident, in approved facility.
Income Limits ~$1,215/month individual
Asset Limits $2,000 individual
MO

Supplements SSI; facility-based only.

Benefits
Monthly cash payment (~$156-$292/month) for care costs

Structured Family Caregiving Waiver (SFCW)

Missouri Structured Family Caregiving Waiver

Age 65+
General Missouri resident, MO HealthNet-eligible, NFLOC, dementia diagnosis, live with caregiver.
Income Limits (2025) ~$2,901/month (300% FBR, individual); QIT required.
Asset Limits $5,909.25 (individual), $11,818.45 (couple).
MO

Caregiver must be family; small program size.

Benefits
Cash stipend ($1,000-$1,500/month) to family caregiver Respite Training Supplies ($500/year)

MO HealthNet Aged, Blind, and Disabled (ABD)

Missouri MO HealthNet ABD

Age 65+ or disabled
General Missouri resident, MO HealthNet-eligible, needs help with 1+ ADL.
Income Limits (2025) ~$1,690/month (individual, projected); spenddown allowed.
Asset Limits $5,909.25 (individual), $11,818.45 (couple).
MO

Less intensive than waivers; statewide access.

Benefits
Personal care (2-4 hours/day) Homemaker services Limited respite Medical equipment

Medicare Savings Program (MSP)

Missouri Medicare Savings Program

Age 65+ or disabled
General Missouri resident, Medicare Part A/B.
Income Limits (2025) ~$2,510/month (QMB), ~$3,380/month (SLMB), ~$3,598/month (QI)—individual.
Asset Limits $9,430 (individual), $14,130 (couple).
MO

Three tiers; no waitlist; includes Extra Help for Part D.

Benefits
Covers Part B premiums ($174.70/month) Deductibles ($240/year) Copays (~20%)

Missouri Caregiver Program (Customized Caregiver Training & Relief)

Missouri Caregiver Program

Age
General Caregivers of 60+ with dementia, Missouri resident, functional needs (2+ ADLs).
Income Limits (2025) No strict cap; prioritizes low-income ~$24,980/year individual
Asset Limits Not assessed; need-based.
MO

Administered via AAAs and Alzheimer’s Association; rural focus.

Benefits
Respite (4-6 hours/week) Training Assistive tech ($500/year) Supplies

VA Aid and Attendance (A&A) and Housebound Benefits

Missouri VA Aid and Attendance/Housebound

Age 65+ or disabled veteran/spouse
General Missouri resident, wartime service, need for ADL help (A&A) or homebound.
Income Limits (2025) Net income < ~$1,984/month (veteran with dependent, A&A); pension offsets income.
Asset Limits ~$155,356 net worth limit
MO

High veteran demand in rural/urban areas.

Benefits
Cash (~$1,433-$2,642/month veteran, ~$951-$1,318 spouse) for care costs (e.g., in-home, assisted living)

Frequently Asked Questions about Camelot Nursing & Rehab Center

What neighborhood is Camelot Nursing & Rehab Center in?

Camelot Nursing & Rehab Center is in the Sleepy Hollow Run neighborhood.

Is Camelot Nursing & Rehab Center in a walkable area?

Camelot Nursing & Rehab Center has a walk score of 55. Moderately walkable. Some errands can be accomplished on foot, with a mix of nearby amenities.

What is the occupancy rate at Camelot Nursing & Rehab Center?

Camelot Nursing & Rehab Center's occupancy is 73.0%.

Does Camelot Nursing & Rehab Center operate as a for-profit or non-profit?

Camelot Nursing & Rehab Center is registered as a for-profit.

Are there photos of Camelot Nursing & Rehab Center?

Yes — there are 26 photos of Camelot Nursing & Rehab Center in the photo gallery on this page.

What is the address of Camelot Nursing & Rehab Center?

Camelot Nursing & Rehab Center is located at 705 Grand Canyon Dr, Farmington, MO 63640.

What is the phone number of Camelot Nursing & Rehab Center?

(573) 756-8911 will put you in contact with the team at Camelot Nursing & Rehab Center.

Guides for Better Senior Living

Care Cost Calculator: See Prices in Your Area

Nursing Home Data Explorer

Don’t Wait Too Long: 7 Red Flag Signs Your Parent Needs Assisted Living Now

The True Cost of Assisted Living in 2025 – And How Families Are Paying For It

Understanding Senior Living Costs: Pricing Models, Discounts & Financial Assistance