Explore Open Rooms
1 Contact details
2 What type of senior care service are you looking for?
3 What budget do you have in mind for senior care?
4 How soon do you need to find care?
5 Additional details

Thank you for your interest!

Our team will be in touch shortly to help with next steps.

Assisted Living in Pacific Grove

CMS overall rating Info The Overall CMS Rating combines results from health inspections, staffing levels and quality measures. Health inspections carry the most weight. Staffing and quality scores can increase or decrease the final rating based on performance compared to state and national standards.

Canterbury Woods

Overview of Canterbury Woods

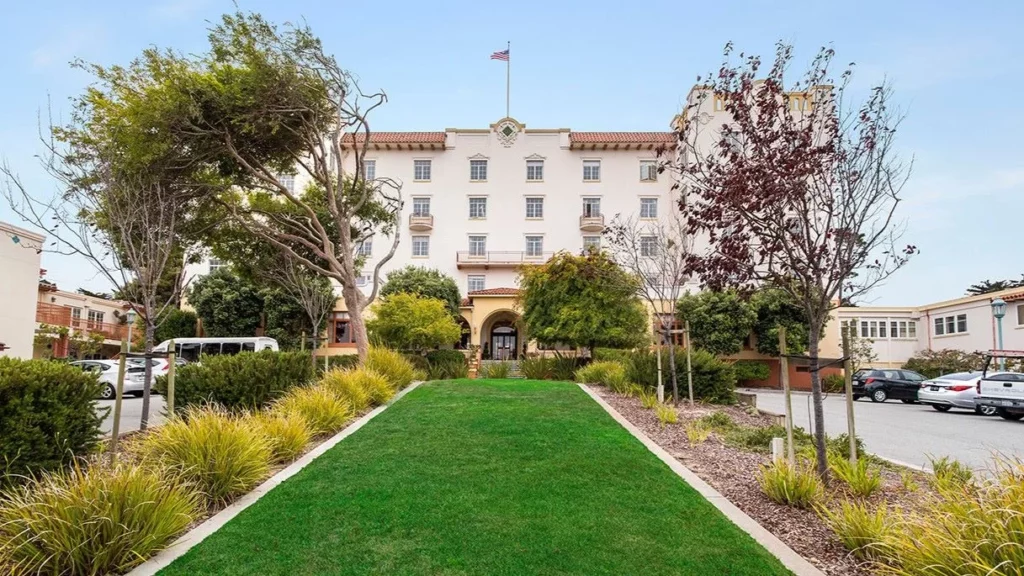
Situated on six wooded acres just blocks from the charming downtown of Pacific Grove, California, Canterbury Woods emerges as a vibrant coastal senior living community where active living harmoniously intersects with incredible natural beauty. As a proud member of the Front Porch Community, Canterbury Woods ensures that residents experience endless opportunities to stay connected and social, seamlessly integrating the care they need for today and tomorrow with the best offerings of the Monterey Peninsula.

Nestled within walking distance of the beach, Canterbury Woods unfolds a dynamic array of programs, beautiful walking trails, and a calendar filled with cultural and academic events, concerts, and classes. The spacious grounds, adorned with gardens and a serene Koi pond, create a tranquil oasis for residents, inviting them to immerse themselves in the coastal beauty. Life at Canterbury Woods is a testament to thriving in a community that values connection, well-being, and active engagement. Here, living well, aging well, and embracing the coastal beauty become not just aspirations but the very essence of the Canterbury Woods experience.

(716) 929-5817

Quality ratings

Measured by Centers for Medicare & Medicaid Services (CMS)

Overall rating Info The Overall CMS Rating combines results from health inspections, staffing levels and quality measures. Health inspections carry the most weight. Staffing and quality scores can increase or decrease the final rating based on performance compared to state and national standards.
5/5
California average: 3.6/5
Health Inspection Info Based on the results of the facility's three most recent standard inspections and any complaint investigations. CMS reviews the number, scope, and severity of deficiencies, with more recent findings weighted more heavily.
4/5
California average: 3.2/5
Staffing Info Measures average nursing staff hours per resident per day, including Registered Nurses (RNs) and total nursing staff. Ratings are adjusted based on the level of care residents require and are compared to state and national benchmarks.
5/5
California average: 3.5/5
Quality Measures Info Based on clinical and physical health indicators reported to CMS, such as hospital readmissions, falls, pressure ulcers, and improvements in mobility. These measures reflect how well residents' health needs are being managed.
5/5
California average: 4.3/5

Nursing care per resident

Info This shows how many total hours of nursing staff time are available per resident each day. Higher numbers usually mean more staff support.
6h 18m per day

This home provides 44% more nursing time per resident than the California average.

California average: 4h 23m per day

Capacity and availability

Medium-capacity home

Offers a balance of services and community atmosphere.

Total beds 190

This home usually has availability

Lower occupancy suggests more openings may be available.

Lower demand than the California average
Occupancy rate 74.7%
Residents per day 142
Occupancy rate
74.7%
Residents per day
142

Who this home usually serves

TYPE OF STAY

Mostly short-term rehab stays

Most residents typically stay for a few weeks or months before returning home or moving on.

Might be optimal for
Short stays Recovery Medicare-covered care

Breakdown by payment type

Medicare

98% of new residents, usually for short-term rehab.

Typical stay 25 days

Private pay

2% of new residents, often for short stays.

Typical stay 5 years

Finances and operations

Voluntary non-profit community
Home revenue
$16.5M
Surplus of revenue
$247.3K
Voluntary non-profit community
Home revenue
$16.5M
Surplus of revenue
$247.3K
Payroll costs Info The portion of the home's budget spent on staff, including nurses, caregivers, and other employees who support care and operations.
$5.2M
31.6% of revenue
Other operating costs Info All remaining costs needed to run the home, such as food, utilities, building maintenance, supplies and administrative expenses.
$11.0M
Total costs $16.2M
Bed community size
190-bed community
A large-scale community that may provide a wide range of amenities, services, and structured programs.
Years in operation
36 years in operation
A longer operating history, which may indicate experience navigating regulations and delivering ongoing care.
Walk Score
Walk Score: 81 / 100
Very walkable. Most errands can be accomplished on foot, and many essentials are within a short walk.
BBB Rating
BBB Rating: A+ (Not Accredited)
An independent rating from the Better Business Bureau based on factors such as complaint history, transparency, and business practices.
How BBB ratings work

About this community

Occupancy

Occupancy rate
75%
In line with California average

California average: 73%

Occupied beds
142 / 190
Average residents 87 per day

License Details

Facility TypeRcfe-continuing Care Retirement Community
StatusLicensed
IssuanceSeptember 15, 1989
CountyMONTEREY

Additional Licensing Details

CMS Certification Number55303
RCFE NumberLic 270708224 COA 323

Ownership & Operating Entity

Canterbury Woods is legally operated by Front Porch Communities And Services.

Staffing & Medical

1 service
Licensed Nurses/CNAs

Amenities & Lifestyle

0 amenities
Specific ProgramsIndependent Living, Assisted Living, Memory Care

Inspection History

In California, the Department of Social Services (for assisted living facilities) and the Department of Public Health (for nursing homes) conduct inspections to ensure resident safety and regulatory compliance.

9 visits

California average: 16 visits

Breakdown by visit type

2 total complaint visits

7 other visits Info Other visits include regulatory visits that are not routine inspections or complaint investigations, such as administrative check-ins, follow-up reviews, or licensing-related visits.

California average

13 total complaint visits

7 other visits

1 complaint investigation Info Inspections conducted in response to complaints filed by residents, families, staff, or others about possible problems at the facility.

Investigations can have many visits.

California average: 10 complaint investigations

4 official inspections Info Routine inspections conducted by state regulators to evaluate whether the facility meets federal and state care and safety standards.

California average: 4 official inspections

3 total citations

Citations indicate regulatory violations. A higher number implies the facility had several areas requiring improvement.

California average: 10 citations

1 serious citation

A violation that poses an immediate risk to resident health or safety, or represents a substantial failure to comply with licensing requirements.

California average: 3 serious citations

2 moderate citations

A violation that does not pose an immediate risk to resident health or safety but requires correction to remain in compliance.

California average: 4 moderate citations

Latest inspection

Date September 4, 2025
Annual Inspection

3 deficiencies

Deficiencies indicate regulatory issues. A higher number implies the facility had several areas requiring improvement.

California average: 8 deficiencies

Inspection Report Summary for Canterbury Woods

Most inspections found no deficiencies, with the facility consistently clean, well-maintained, and compliant with safety and health regulations. The most recent report from September 4, 2025, was perfect with no deficiencies noted. Earlier in 2023, there were some issues including a substantiated complaint where a resident suffered dehydration and acute kidney injury due to inadequate personal assistance, and another investigation found rough care by staff and an elevator out of service, both posing risks to residents. Several other complaint investigations were unsubstantiated, and the facility showed improvement over time, with no deficiencies found in the latest annual inspections. No fines or enforcement actions were listed in the available reports.

Health Inspection History

Inspections
Total health inspections 3

California average 12.5


Last Health inspection on Sep 2024

Total health citations 26

California average 50.2

Citations per inspection
8.67

California average 4.65


Health citations are formal notices following inspections when they fail to comply with safety and care standards.

All 26 citations resulted from standard inspections.

Breakdown of citation severity (last 3 years)
Critical Health citations More info 0
100% better than California average

California average: 0.4


Serious Health citations More info 0
100% better than California average

California average: 1

0 critical citations More info California average: 0.4

0 serious citations More info California average: 1

26 moderate citations More info California average: 47.2

0 minor citations More info California average: 1.5
Citations history (last 3 years)
Administration moderate citation Info Issues related to how the facility is managed, including policies, procedures, and compliance with regulations. Sep 13, 2024
Corrected

Infection Control moderate citation Info Issues related to preventing and controlling infections, including hygiene practices and safety protocols. Sep 13, 2024
Corrected

Nutrition moderate citation Info Issues related to food quality, meal service, and resident's nutritional needs. Sep 13, 2024
Corrected

Nutrition moderate citation Info Issues related to food quality, meal service, and resident's nutritional needs. Sep 13, 2024
Corrected

Compare Assisted Living around Pacific Grove The information below is reported by the California Department of Social Services and Department of Public Health.

Filter by care type
Pacific Grove Senior Living
AL

Assisted Living A licensed, long-term care setting for seniors or individuals with disabilities who need help with daily activities — like bathing, dressing, and medication management — but not 24-hour skilled nursing. Offers housing, meals, and around-the-clock support while aiming to maximize resident independence.

Pacific Grove
150
No
90
3
35
5
3
52.7%
-
Pacific Grove Senior Living Llc;Ca Snr Lvg Mgt Llc
-
Canterbury Woods
NH

Nursing Home Licensed facility providing 24/7 skilled nursing care for residents with complex, ongoing medical needs. Staffed by RNs, LPNs, and CNAs. Inspected and star-rated annually by CMS. Accepts Medicare (short-term rehab) and Medicaid (long-term care).

AL

Assisted Living A licensed, long-term care setting for seniors or individuals with disabilities who need help with daily activities — like bathing, dressing, and medication management — but not 24-hour skilled nursing. Offers housing, meals, and around-the-clock support while aiming to maximize resident independence.

Pacific Grove
24
No
81
4
2
1
36
74.7%
A+
Front Porch Communities And Services
1 Bed / 2 Bed

Places of interest near Canterbury Woods

Address 0.5 miles from city center — 0.3 miles to nearest hospital (Soft Tissue Medical Center)

Calculate Travel Distance to Canterbury Woods

Add your location

Address

Staffing Data (Q2 2025)

This data corresponds to Q2 2025 and is based on CMS Payroll-Based Journal.

Total staff 68
Employees 43
Contractors 25
Staff to resident ratio 4.53:1
4533233% better than California average

California average ratio: 0.00:1

Avg staff/day 19
Average shift 7 hours
9% worse than California average

California average: 7.7 hours

Total staff hours (quarter) 12,112
Nursing staff breakdown
Registered Nurse

Manages medical care and health needs.

Total count 6
Average shift length Info Average shift length. Calculated as total hours divided by days worked and average staff per day. 9 hours

No contractors work on this role.

Licensed Practical Nurse

Assists with medical care and medications.

Total count 5
Average shift length Info Average shift length. Calculated as total hours divided by days worked and average staff per day. 9.1 hours

No contractors work on this role.

Certified Nursing Assistant

Helps with daily care and mobility.

Total count 22
Average shift length Info Average shift length. Calculated as total hours divided by days worked and average staff per day. 7.7 hours

This role is partially covered by contractors.

Contractor staffing

Total hours from contractors

14.1%

1,704 contractor hours this quarter

Respiratory Therapy Technician: 6 Physical Therapy Assistant: 4 Speech Language Pathologist: 4 Qualified Social Worker: 3 Occupational Therapy Aide: 2 Physical Therapy Aide: 2 Certified Nursing Assistant: 1 Administrator: 1 Occupational Therapy Assistant: 1 Medical Director: 1
Staff by category
Certified Nursing Assistant211225,37591100%7.7
Licensed Practical Nurse5051,46891100%9.1
RN Director of Nursing4041,2817886%8
Registered Nurse6061,0819099%9
Physical Therapy Aide0225126369%7.5
Mental Health Service Worker1014886167%8
Nurse Practitioner1013844853%8
Occupational Therapy Aide0222644954%5.1
Administrator0112526369%4
Respiratory Therapy Technician0662525763%3.2
Physical Therapy Assistant0442225763%3.7
Clinical Nurse Specialist1011892426%7.9
Other Dietary Services Staff4041502325%6.5
Speech Language Pathologist0441404347%3.1
Occupational Therapy Assistant0113067%5
Qualified Social Worker033201516%1.2
Medical Director011633%2
22 Certified Nursing Assistant
% of Days 100%
5 Licensed Practical Nurse
% of Days 100%
4 RN Director of Nursing
% of Days 86%
6 Registered Nurse
% of Days 99%
2 Physical Therapy Aide
% of Days 69%
1 Mental Health Service Worker
% of Days 67%
1 Nurse Practitioner
% of Days 53%
2 Occupational Therapy Aide
% of Days 54%
1 Administrator
% of Days 69%
6 Respiratory Therapy Technician
% of Days 63%
4 Physical Therapy Assistant
% of Days 63%
1 Clinical Nurse Specialist
% of Days 26%
4 Other Dietary Services Staff
% of Days 25%
4 Speech Language Pathologist
% of Days 47%
1 Occupational Therapy Assistant
% of Days 7%
3 Qualified Social Worker
% of Days 16%
1 Medical Director
% of Days 3%

Facility Characteristics

Source: CMS Long-Term Care Facility Characteristics (Data as of Jan 2026)

Total census
15 residents
Residents by payment source
Medicare
5 residents (33.3%)
Private pay or other
10 residents (66.7%)
Programs & Services
Residents' Group

Residents meet regularly to discuss policies, care quality, and activities

Nurse Aide Training

State-approved Nurse Aide Training and Competency Evaluation Program on-site

CCRC

Part of a Continuing Care Retirement Community offering multiple care levels

Active Resident Council

Organized group of residents that meets regularly to discuss facility policies, quality of life, and activities.

Quality of care over time

These measures show how residents usually do over time at this home, based on health outcomes and preventive care.

High-risk clinical events score Info A composite score based on pressure ulcers, falls with injury, weight loss, walking ability decline, and activities of daily living decline. 1.2
81% better than California average

California average: 6.6

Functional decline score Info A composite score based on activities of daily living decline, walking ability decline, and incontinence. 11.2
In line with California average

California average: 11.3

Long-stay resident measures
Low Risk Residents with Bowel/Bladder Incontinence Info Percent of low risk long-stay residents who lose control of their bowels or bladder 11.2%
In line with California average

California average: 11.3%

Falls with Major Injury Info Percent of long-stay residents experiencing one or more falls with major injury 0.0%
100% better than California average

California average: 1.7%

High Risk Residents with Pressure Ulcers Info Percent of long-stay high risk residents with pressure ulcers 2.5%
50% better than California average

California average: 5.0%

Urinary Tract Infection Info Percent of long-stay residents with a urinary tract infection 0.0%
100% better than California average

California average: 1.2%

Depressive Symptoms Info Percent of long-stay residents who have depressive symptoms 14.3%
114% worse than California average

California average: 6.7%

Antipsychotic Use Info Percent of long-stay residents who received an antipsychotic medication 0.0%
100% better than California average

California average: 10.1%

Pneumococcal Vaccine Info Percent of long-stay residents assessed and appropriately given the pneumococcal vaccine 100.0%
In line with California average

California average: 98.5%

Short-stay resident measures
Pneumococcal Vaccine Info Percent of short-stay residents assessed and appropriately given the pneumococcal vaccine 99.3%
6% better than California average

California average: 94.0%

Antipsychotic medication increase Info Percent of short-stay residents who newly received an antipsychotic medication 0.0%
100% better than California average

California average: 1.5%

Influenza Vaccine Info Percent of short-stay residents assessed and appropriately given the seasonal influenza vaccine 97.8%
5% better than California average

California average: 93.2%

Guides for Better Senior Living

Care Cost Calculator: See Prices in Your Area

Nursing Home Data Explorer

Don’t Wait Too Long: 7 Red Flag Signs Your Parent Needs Assisted Living Now

The True Cost of Assisted Living in 2025 – And How Families Are Paying For It

Understanding Senior Living Costs: Pricing Models, Discounts & Financial Assistance

Financial Aid for California Seniors

Get financial aid guidance

Multipurpose Senior Services Program

MSSP (Medi-Cal Waiver)

Age 65+, California resident, Medi-Cal eligible, nursing home risk.

~$2,829/month (300% FBR, individual).

$2,000 (individual), $3,000 (couple).

County-managed; waitlists possible.

In-Home Supportive Services (IHSS)

California IHSS

Age 65+, California resident, Medicaid-eligible or low-income.

~$1,732/month (individual, Medi-Cal threshold).

$2,000 (individual).

Can hire family as caregivers.

Multipurpose Senior Services Program (MSSP)

CA MSSP

Age 65+, California resident, Medi-Cal-eligible, nursing home-eligible but community-capable.

~$2,829/month (300% FBR, individual).

$2,000 (individual).

Available in 38 counties; waitlists common.

Property Tax Postponement Program (PTP)

CA PTP

Age 62+, California resident, own and live in home, 40% equity.

~$51,500/year (household, adjusted annually).

Equity-based; no strict asset cap.

Deferred taxes accrue interest (5% as of 2024); repaid upon sale/death.

Assisted Living Waiver (ALW)

CA ALW

Age 65+ or disabled, California resident, Medi-Cal-eligible, nursing home-eligible.

~$2,829/month (300% FBR, individual).

$2,000 (individual).

Available in 15 counties (e.g., LA, Sacramento); waitlists common.

California CARES Program

CA CARES

Caregivers of California residents 60+ needing help with 3+ daily activities; no caregiver age limit.

No strict limit; cost-sharing above ~$2,500/month threshold.

Not applicable; need-based.

High demand in urban areas; complements IHSS respite.

Low-Income Home Energy Assistance Program (LIHEAP)

CA LIHEAP

Age 60+ priority, California resident, low-income, utility/heating need.

~$2,510/month (200% of poverty level, individual).

Not applicable; income-focused.

High demand in inland/coastal extremes; weatherization capped at $5,000/home.

Tour Icon
Planning a tour? Check our touring checklist.
Chat Icon
Thinking of living here? We can help you speak to a current resident