


Total health inspections
5
Arkansas average 4.2
Last Health inspection on Aug 2025
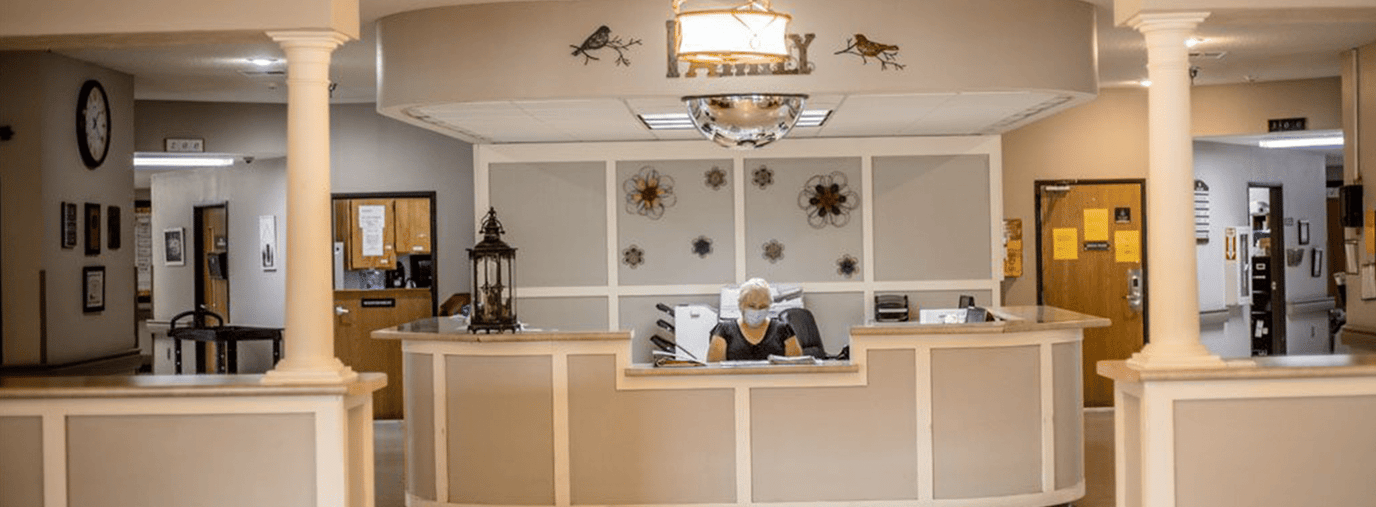


Care Manor Nursing and Rehab is a 104-bed care home in Mountain Home, Arkansas, owned by Randy Sutterfield and run by MHCNC, Inc for the last 30 years. The average stay here is about 113 days, which means the daily workflow focuses heavily on short-term recovery stints for folks coming out of the hospital, though they handle permanent residential care too. For billing, the front office takes traditional Medicare, state Medicaid, and standard private funds.
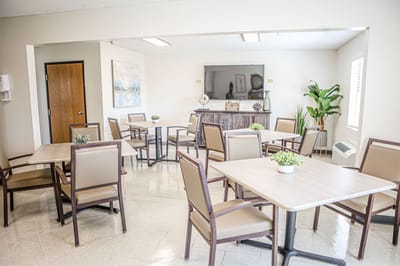
Residents get a lot of direct attention on the floor, with the nursing crew averaging about 4 hours and 56 minutes of hands-on care per person every day. This 24-hour team handles regular clinical needs and runs therapy routines in an on-site gym. The building also has an outdoor courtyard, a hair salon, and a dining program run by a certified dietary manager. The neighborhood scores a 60 for walkability, so family members visiting the home can easily cross a few quick errands off their list on foot.
State inspectors have previously noted compliance issues with assessment accuracy, care planning details, infection control practices, and general staff procedural awareness. You can go over these specific survey results with the management team to see how they handle daily safety protocols and quality control.
Families looking into local options can call the front desk to see which rooms are currently open or to find out how the admissions process works.
| Staff type | Hours / Day / Resident | vs state avg |
|---|---|---|
|
Registered Nurse (RN)
| 23m per day | ■ Avg State avg: 24m per day · National avg: 41m per day |
|
LPN / LVN
| 58m per day | ■ Avg State avg: 57m per day · National avg: 52m per day |
|
Nurse Aide
| 2h 34m per day | ▼ 6% State avg: 2h 44m per day · National avg: 2h 21m per day |
|
Weekend Total Nursing
| 3h 15m per day | ▼ 7% State avg: 3h 29m per day · National avg: 3h 26m per day |
|
Physical Therapist
| 0m per day | ▼ 83% State avg: 2m per day · National avg: 4m per day |
|
Weekend RN
| 13m per day | ▼ 20% State avg: 16m per day · National avg: 29m per day |
Care Manor Nursing and Rehab is legally operated by MHCNC, Inc., and administered by Randy J Sutterfield.
Key information about the people who lead and staff this community.
In Arkansas, the Department of Human Services, Office of Long Term Care is authorized to conduct unannounced inspections and issue official quality of care reports for all senior living providers.
Deficiencies
| This Facility | AR Average | vs. AR Avg |
|---|---|---|---|
|
Total deficiencies
| 33 | 21 | This facility has 57% more total deficiencies than a typical Arkansas nursing home (33 vs. AR avg 21).↑ 57% worse |
Arkansas average 4.2
Last Health inspection on Aug 2025
Arkansas average 21.8
Arkansas average 5.32
Health citations are formal notices following inspections when they fail to comply with safety and care standards.
11 of 18 citations resulted from standard inspections; 4 of 18 resulted from complaint investigations; and 3 of 18 came from combined inspections (standard and complaint).
Arkansas average: 0.4
Arkansas average: 0.2
Reporting period: October 1 – December 31, 2025 (Q4 2025). Source: CMS Payroll-Based Journal report.
Manages medical care and health needs.
Assists with medical care and medications.
Helps with daily care and mobility.
Total hours from contractors
827 contractor hours this quarter
| Certified Nursing Assistant | 43 | 0 | 43 | 12,682 | 92 | 100% | 7.5 |
| Licensed Practical Nurse | 16 | 0 | 16 | 5,087 | 92 | 100% | 9.5 |
| Nurse Aide in Training | 8 | 0 | 8 | 2,342 | 88 | 96% | 8.2 |
| Clinical Nurse Specialist | 3 | 2 | 5 | 1,380 | 90 | 98% | 7.2 |
| Other Dietary Services Staff | 2 | 0 | 2 | 971 | 65 | 71% | 8.2 |
| RN Director of Nursing | 2 | 0 | 2 | 800 | 68 | 74% | 9.4 |
| Medication Aide/Technician | 1 | 0 | 1 | 650 | 72 | 78% | 9 |
| Nurse Practitioner | 1 | 0 | 1 | 504 | 67 | 73% | 7.5 |
| Registered Nurse | 3 | 0 | 3 | 497 | 53 | 58% | 8.3 |
| Dental Services Staff | 1 | 0 | 1 | 478 | 59 | 64% | 8.1 |
| Administrator | 1 | 0 | 1 | 456 | 57 | 62% | 8 |
| Speech Language Pathologist | 0 | 2 | 2 | 297 | 67 | 73% | 4.4 |
| Physical Therapy Aide | 0 | 3 | 3 | 296 | 66 | 72% | 4.4 |
| Qualified Social Worker | 0 | 1 | 1 | 91 | 48 | 52% | 1.9 |
| Physical Therapy Assistant | 0 | 3 | 3 | 39 | 30 | 33% | 1.3 |
| Respiratory Therapy Technician | 0 | 4 | 4 | 34 | 24 | 26% | 1.3 |
Includes penalties issued in 2025
Federal penalties imposed by CMS for regulatory violations, including civil money penalties (fines) and denials of payment for new Medicare/Medicaid admissions.
Source: CMS Penalties Database (Data as of Jan 2026)
Arkansas average: $26K
Arkansas average: 1.5
Arkansas average: 0.2
Penalties are imposed by CMS for violations of federal nursing home regulations.
1 penalty in the past 3 years
Aug 29, 2025 · $14K
Last updated: Jan 2026
These measures show how residents usually do over time at this home, based on health outcomes and preventive care.
Arkansas average: 7.7
Arkansas average: 13.3
Arkansas average: 11.5%
Arkansas average: 13.4%
Arkansas average: 15.1%
Arkansas average: 3.9%
Arkansas average: 4.7%
Arkansas average: 1.3%
Arkansas average: 5.0%
Arkansas average: 1.5%
Arkansas average: 10.5%
Arkansas average: 94.4%
Arkansas average: 96.2%
Arkansas average: 1.97
Arkansas average: 2.18
Arkansas average: 80.9%
Arkansas average: 1.5%
Arkansas average: 77.7%
Arkansas average: 25.2%
Arkansas average: 13.8%
Arkansas average: 0.8%
Arkansas average: 53.7%
Arkansas average: 50.6%
Quality measures are calculated from Minimum Data Set (MDS) assessments. For most measures, lower percentages indicate better care quality.
34% of new residents, usually for short-term rehab.
57% of new residents, often for short stays.
9% of new residents, often for long-term daily care.
Source: CMS Long-Term Care Facility Characteristics (Data as of Jan 2026)
Residents meet regularly to discuss policies, care quality, and activities
State-approved Nurse Aide Training and Competency Evaluation Program on-site
Organized group of residents that meets regularly to discuss facility policies, quality of life, and activities.
Data sourced from CMS Long-Term Care Facility Characteristics quarterly report. Payer mix reflects the current resident census by primary payment source.
Historical financial and operational data for Care Manor Nursing and Rehab from 2011–2023, based on CMS SNF Cost Reports.
Key figures below are for fiscal year ending in 12/2023.
Based on CMS SNF Cost Report for fiscal year ending in 12/2023.
This home supports both short-term rehab and long-term care, with residents staying for a wide range of durations.
Most new residents arrive under private pay (57% of admissions), and a typical private pay stay runs around 2 - 3 months.
Coverage residents most often arrive under.
Coverage residents most often leave under.
![]() 0.0 miles from city center
0.0 miles from city center
![]() Estimated distance in miles from Mountain Home's city center to Care Manor Nursing and Rehab's address, calculated via Google Maps.
Estimated distance in miles from Mountain Home's city center to Care Manor Nursing and Rehab's address, calculated via Google Maps.
Add your location
Info below is compiled from CMS reports & the AR Dept. of Human Services (DHS), senior community websites & trusted data sources such as Walk Score & BBB.
Communities are listed from highest to lowest based on our ranking methodology.
| Hiram Shaddox Health and Rehab | NH MC RC SNF | Mountain Home | 140
Facility
140
AR AVG
84
Rank
#18 / 329 |
46.4%
Facility
46.4%
AR AVG
65.7
Rank
#138 / 165 | -29% | 3.58
Facility
3.58
AR AVG
4.67
Rank
#180 / 184 | -3% | -23% | $0
Facility
$0
AR AVG
$27.3k
Rank
#1 / 189 | 18
Facility
18
AR AVG
21.8
Rank
#69 / 188 | 4.5
Facility
4.5
AR AVG
5.3
Rank
#71 / 188 | - | 65 | - |
12
Facility
12
AR AVG
34
Rank
#329 / 416 | Tiffany Lockard | $9.6MFiscal year ending 12/2023
Facility
$9.6MFiscal year ending 12/2023
AR AVG
$9.4M
Rank
#48 / 184 | $3.3MFiscal year ending 12/2023
Facility
$3.3MFiscal year ending 12/2023
AR AVG
$3.4M
Rank
#116 / 184 | 34.2%Fiscal year ending 12/2023
Facility
34.2%Fiscal year ending 12/2023
AR AVG
37.9%
Rank
#181 / 184 | 45471 | ||||
| Lake Forest Senior Living at Mountain Home | NH AL HOS IL MC PC SNF | Mountain Home | 70
Facility
70
AR AVG
84
Rank
#205 / 329 |
63.9%
Facility
63.9%
AR AVG
65.7
Rank
#103 / 165 | -3% | 4.30
Facility
4.30
AR AVG
4.67
Rank
#126 / 184 | -41% | -8% | $0
Facility
$0
AR AVG
$27.3k
Rank
#1 / 189 | 22
Facility
22
AR AVG
21.8
Rank
#108 / 188 | 5.5
Facility
5.5
AR AVG
5.3
Rank
#114 / 188 | - | 45 | - |
14
Facility
14
AR AVG
34
Rank
#318 / 416 | Mountain Home Snf Opco LLC | $5.6MFiscal year ending 12/2023
Facility
$5.6MFiscal year ending 12/2023
AR AVG
$9.4M
Rank
#91 / 184 | $3.7MFiscal year ending 12/2023
Facility
$3.7MFiscal year ending 12/2023
AR AVG
$3.4M
Rank
#113 / 184 | 66%Fiscal year ending 12/2023
Facility
66%Fiscal year ending 12/2023
AR AVG
37.9%
Rank
#133 / 184 | 45250 | ||||
| Care Manor Nursing and Rehab | NH MC RC SNF | Mountain Home | 104
Facility
104
AR AVG
84
Rank
#118 / 329 | - | - | 4.94
Facility
4.94
AR AVG
4.67
Rank
#51 / 184 | -43% | +6% | $0
Facility
$0
AR AVG
$27.3k
Rank
#1 / 189 | 18
Facility
18
AR AVG
21.8
Rank
#69 / 188 | 3.6
Facility
3.6
AR AVG
5.3
Rank
#32 / 188 | 1 | 2 | A+ |
60
Facility
60
AR AVG
34
Rank
#48 / 416 | Randy Sutterfield | $6.5MFiscal year ending 12/2023
Facility
$6.5MFiscal year ending 12/2023
AR AVG
$9.4M
Rank
#134 / 184 | $2.8MFiscal year ending 12/2023
Facility
$2.8MFiscal year ending 12/2023
AR AVG
$3.4M
Rank
#155 / 184 | 43.7%Fiscal year ending 12/2023
Facility
43.7%Fiscal year ending 12/2023
AR AVG
37.9%
Rank
#139 / 184 | 45351 |
Care Manor Nursing and Rehab is located in Mountain Home, Arkansas.
Here are the financial assistance programs available to residents in Arkansas.
Care Manor Nursing and Rehab is legally operated by MHCNC, Inc., and administered by Randy J Sutterfield.
Care Manor Nursing and Rehab has a walk score of 60. Moderately walkable. Some errands can be accomplished on foot, with a mix of nearby amenities.
Care Manor Nursing and Rehab's occupancy is 53.7%.
Care Manor Nursing and Rehab has been operating for approximately 30 years, based on available licensing and registration records.
No, Care Manor Nursing and Rehab has a no-pet policy.
Care Manor Nursing and Rehab is registered as a for-profit in AR.
Randy J Sutterfield is the administrator of Care Manor Nursing and Rehab.
Care Cost Calculator: See Prices in Your Area
Nursing Home Data Explorer
Don’t Wait Too Long: 7 Red Flag Signs Your Parent Needs Assisted Living Now
The True Cost of Assisted Living in 2025 – And How Families Are Paying For It
Understanding Senior Living Costs: Pricing Models, Discounts & Financial Assistance


