


Total staff
222
Employees
202
Contractors
20
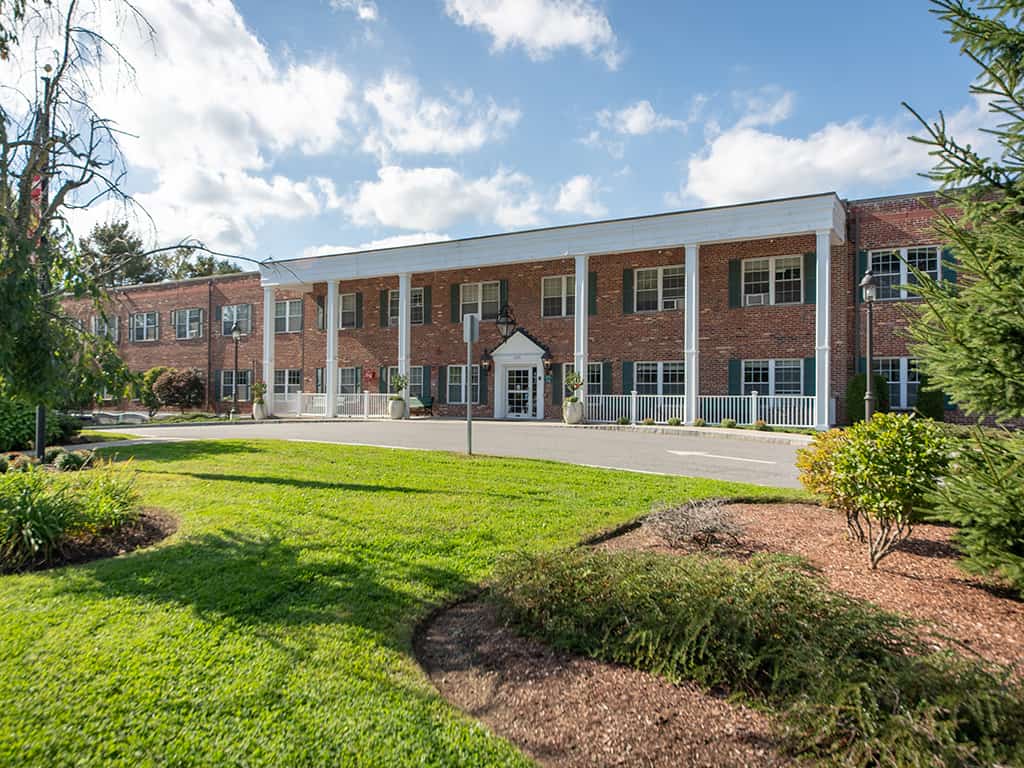
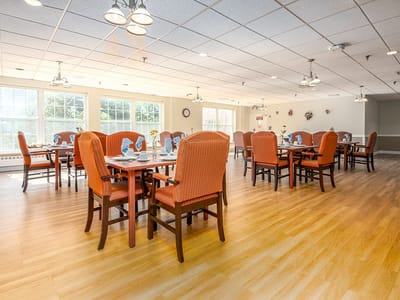
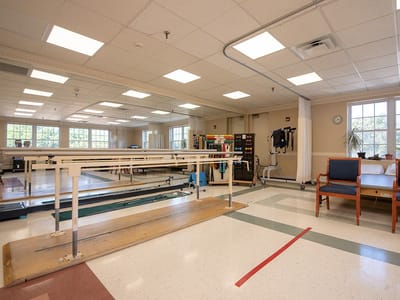
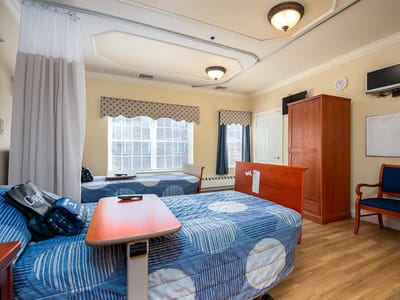
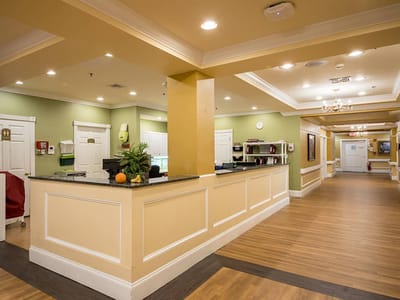
CareOne at Newton is an award-winning nursing home in Newton, MA, that offers long-term care, rehabilitation, respite care, and skilled nursing. Dedicated to older adults’ comfort and healing, the community continuously promotes a nurturing and welcoming environment. A maintenance-free lifestyle is also guaranteed with 24-hour care, healthy meals, and comprehensive therapies. Through a person-centered approach to care, the community strives to meet residents’ unique needs and preferences.
Light exercises, social gatherings, and games provide residents with more opportunities to explore new interests and have fun. With spacious common areas and top-notch amenities, residents can rest and move around safely. Newton-Wellesley Hospital, Charles River Reservation, and Cochituate Aqueduct Trail are also located nearby, providing quick access to necessities and leisure. This nursing home is one of the trusted choices for senior living in Massachusetts, especially with its commitment to older adults’ well-being.
| Staff type | Hours / Day / Resident | vs state avg |
|---|---|---|
|
Registered Nurse (RN)
| 34m per day | ▼ 13% State avg: 39m per day · National avg: 41m per day |
|
LPN / LVN
| 1h 0m per day | ▲ 5% State avg: 57m per day · National avg: 52m per day |
|
Nurse Aide
| 2h 9m per day | ▼ 5% State avg: 2h 16m per day · National avg: 2h 20m per day |
|
Weekend Total Nursing
| 3h 33m per day | ■ Avg State avg: 3h 29m per day · National avg: 3h 27m per day |
|
Physical Therapist
| 8m per day | ▲ 65% State avg: 5m per day · National avg: 4m per day |
|
Weekend RN
| 30m per day | ▲ 10% State avg: 27m per day · National avg: 29m per day |
Reporting period: October 1 – December 31, 2025 (Q4 2025). Source: CMS Payroll-Based Journal report.
Manages medical care and health needs.
Assists with medical care and medications.
Helps with daily care and mobility.
Total hours from contractors
1,492 contractor hours this quarter
| Certified Nursing Assistant | 86 | 0 | 86 | 33,719 | 92 | 100% | 8.4 |
| Licensed Practical Nurse | 22 | 15 | 37 | 11,551 | 92 | 100% | 9.8 |
| Registered Nurse | 11 | 1 | 12 | 5,443 | 92 | 100% | 9.4 |
| RN Director of Nursing | 9 | 0 | 9 | 4,162 | 92 | 100% | 9.1 |
| Physical Therapy Assistant | 17 | 1 | 18 | 3,249 | 79 | 86% | 7.9 |
| Clinical Nurse Specialist | 12 | 0 | 12 | 2,900 | 92 | 100% | 7.3 |
| Other Dietary Services Staff | 5 | 0 | 5 | 2,333 | 92 | 100% | 7.7 |
| Respiratory Therapy Technician | 13 | 1 | 14 | 1,965 | 79 | 86% | 7.7 |
| Qualified Social Worker | 5 | 0 | 5 | 1,192 | 78 | 85% | 7.5 |
| Speech Language Pathologist | 5 | 1 | 6 | 980 | 66 | 72% | 7.9 |
| Physical Therapy Aide | 3 | 0 | 3 | 829 | 81 | 88% | 7.2 |
| Nurse Practitioner | 2 | 0 | 2 | 520 | 64 | 70% | 8 |
| Dental Services Staff | 1 | 0 | 1 | 504 | 63 | 68% | 8 |
| Occupational Therapy Aide | 7 | 0 | 7 | 486 | 66 | 72% | 6.8 |
| Dietitian | 1 | 0 | 1 | 484 | 63 | 68% | 7.7 |
| Administrator | 1 | 0 | 1 | 461 | 58 | 63% | 7.9 |
| Qualified Activities Professional | 1 | 0 | 1 | 378 | 49 | 53% | 7.7 |
| Mental Health Service Worker | 1 | 0 | 1 | 200 | 25 | 27% | 8 |
| Medical Director | 0 | 1 | 1 | 60 | 6 | 7% | 10 |
Includes penalties issued in 2024
Federal penalties imposed by CMS for regulatory violations, including civil money penalties (fines) and denials of payment for new Medicare/Medicaid admissions.
Source: CMS Penalties Database (Data as of Jan 2026)
Massachusetts average: $72K
Massachusetts average: 1.7
Massachusetts average: 0.1
Penalties are imposed by CMS for violations of federal nursing home regulations.
1 penalty in the past 3 years
Oct 9, 2024 · $9K
Last updated: Jan 2026
These measures show how residents usually do over time at this home, based on health outcomes and preventive care.
Massachusetts average: 10.2
Massachusetts average: 20.0
Massachusetts average: 18.7%
Massachusetts average: 19.3%
Massachusetts average: 22.1%
Massachusetts average: 3.6%
Massachusetts average: 4.7%
Massachusetts average: 2.1%
Massachusetts average: 5.2%
Massachusetts average: 10.7%
Massachusetts average: 20.3%
Massachusetts average: 91.9%
Massachusetts average: 94.8%
Massachusetts average: 76.7%
Massachusetts average: 1.3%
Massachusetts average: 77.7%
Quality measures are calculated from Minimum Data Set (MDS) assessments. For most measures, lower percentages indicate better care quality.
56% of new residents, usually for short-term rehab.
40% of new residents, often for short stays.
5% of new residents, often for long-term daily care.
Source: CMS Long-Term Care Facility Characteristics (Data as of Jan 2026)
Data sourced from CMS Long-Term Care Facility Characteristics quarterly report. Payer mix reflects the current resident census by primary payment source.
Historical financial and operational data for CareOne at Newton from 2011–2023, based on CMS SNF Cost Reports.
Key figures below are for fiscal year ending in 12/2023.
Based on CMS SNF Cost Report for fiscal year ending in 12/2023.
Building Type: 2-story

On-site Medical Care and Health Services
Rehabilitative Support
Most residents typically stay for a few weeks or months before returning home or moving on.
Most new residents arrive under Medicare (56% of admissions), and a typical Medicare stay runs around 26 days.
Coverage residents most often arrive under.
Coverage residents most often leave under.
![]() 2.7 miles from city center
2.7 miles from city center
![]() Estimated distance in miles from Newton's city center to CareOne at Newton's address, calculated via Google Maps.
Estimated distance in miles from Newton's city center to CareOne at Newton's address, calculated via Google Maps.
Add your location
Info below is compiled from CMS reports & the MA Executive Office of Elder Affairs, senior community websites & trusted data sources such as Walk Score & BBB.
Communities are listed from highest to lowest based on our ranking methodology.
| Lasell Village | NH SNF | Newton (Auburndale) | 44
Facility
44
MA AVG
94
Rank
#245 / 276 |
72.7%
Facility
72.7%
MA AVG
78.3
Rank
#59 / 81 | -7% | 6.86
Facility
6.86
MA AVG
3.93
Rank
#2 / 86 | +25% | +74% | $0
Facility
$0
MA AVG
$76.6k
Rank
#1 / 87 | 6
Facility
6
MA AVG
32.7
Rank
#4 / 86 | 3.0
Facility
3.0
MA AVG
7.2
Rank
#6 / 86 | - | 32 | - |
52
Facility
52
MA AVG
53
Rank
#250 / 498 | Alessandro Vianello | $4.7MFiscal year ending 06/2024
Facility
$4.7MFiscal year ending 06/2024
MA AVG
$17.4M
Rank
#14 / 89 | $9.4MFiscal year ending 06/2024
Facility
$9.4MFiscal year ending 06/2024
MA AVG
$6.5M
Rank
#45 / 89 | 199.9%Fiscal year ending 06/2024
Facility
199.9%Fiscal year ending 06/2024
MA AVG
43.6%
Rank
#87 / 89 | 225755 | ||||
| Stone Rehabilitation & Senior Living | NH AL HOS RESC RC SNF | Newton (Newton Upper Falls) | 82
Facility
82
MA AVG
94
Rank
#153 / 276 |
94.6%
Facility
94.6%
MA AVG
78.3
Rank
#8 / 81 | +21% | 3.66
Facility
3.66
MA AVG
3.93
Rank
#52 / 86 | -13% | -7% | $16.2k
Facility
$16.2k
MA AVG
$76.6k
Rank
#64 / 87 | 24
Facility
24
MA AVG
32.7
Rank
#37 / 86 | 4.8
Facility
4.8
MA AVG
7.2
Rank
#26 / 86 | 3 | 78 | - |
61
Facility
61
MA AVG
53
Rank
#212 / 498 | Jean Thurston | $9.5MFiscal year ending 12/2023
Facility
$9.5MFiscal year ending 12/2023
MA AVG
$17.4M
Rank
#74 / 89 | $6.0MFiscal year ending 12/2023
Facility
$6.0MFiscal year ending 12/2023
MA AVG
$6.5M
Rank
#69 / 89 | 63.6%Fiscal year ending 12/2023
Facility
63.6%Fiscal year ending 12/2023
MA AVG
43.6%
Rank
#14 / 89 | 225683 | ||||
| CareOne at Newton | NH RC SNF | Newton | 202
Facility
202
MA AVG
94
Rank
#8 / 276 |
84.2%
Facility
84.2%
MA AVG
78.3
Rank
#39 / 81 | +8% | 3.79
Facility
3.79
MA AVG
3.93
Rank
#44 / 86 | -58% | -4% | $30.0k
Facility
$30.0k
MA AVG
$76.6k
Rank
#69 / 87 | 42
Facility
42
MA AVG
32.7
Rank
#65 / 86 | 5.3
Facility
5.3
MA AVG
7.2
Rank
#30 / 86 | 5 | 170 | - |
45
Facility
45
MA AVG
53
Rank
#289 / 498 | Moshael Straus | $24.4MFiscal year ending 12/2023
Facility
$24.4MFiscal year ending 12/2023
MA AVG
$17.4M
Rank
#5 / 89 | $16.7MFiscal year ending 12/2023
Facility
$16.7MFiscal year ending 12/2023
MA AVG
$6.5M
Rank
#8 / 89 | 68.3%Fiscal year ending 12/2023
Facility
68.3%Fiscal year ending 12/2023
MA AVG
43.6%
Rank
#83 / 89 | 225268 |
CareOne at Newton is located in Newton, Massachusetts.
Here are the financial assistance programs available to residents in Massachusetts.
CareOne at Newton has a walk score of 45. Somewhat walkable. A few nearby services may be reachable on foot, but most trips require transportation.
CareOne at Newton's occupancy is 73.7%.
No, CareOne at Newton has a no-pet policy.
CareOne at Newton is registered as a for-profit.
Yes — there are 7 photos of CareOne at Newton in the photo gallery on this page.
CareOne at Newton is located at 2101 Washington St, Newton, MA 02462.
(617) 969-4660 will put you in contact with the team at CareOne at Newton.
Care Cost Calculator: See Prices in Your Area
Nursing Home Data Explorer
Don’t Wait Too Long: 7 Red Flag Signs Your Parent Needs Assisted Living Now
The True Cost of Assisted Living in 2025 – And How Families Are Paying For It
Understanding Senior Living Costs: Pricing Models, Discounts & Financial Assistance


