Carespring – Barrington of Fort Thomas
Nursing Home, Assisted Living, Independent Living & Respite Care · Fort Thomas, KY
CMS overall rating Info CMS (the Centers for Medicare & Medicaid Services) is the federal agency that rates nursing home quality. Its Overall Rating runs from 1 to 5 stars, combining health inspections, staffing, and quality measures, with inspections weighted most heavily.

Carespring – Barrington of Fort Thomas

Nursing Home, Assisted Living, Independent Living & Respite Care · Fort Thomas, KY
CMS overall rating Info CMS (the Centers for Medicare & Medicaid Services) is the federal agency that rates nursing home quality. Its Overall Rating runs from 1 to 5 stars, combining health inspections, staffing, and quality measures, with inspections weighted most heavily.
Calculator: See prices in your area
Carespring – Barrington of Fort Thomas accepts Medicare, Medicaid, and private pay.

Overview of Carespring – Barrington of Fort Thomas

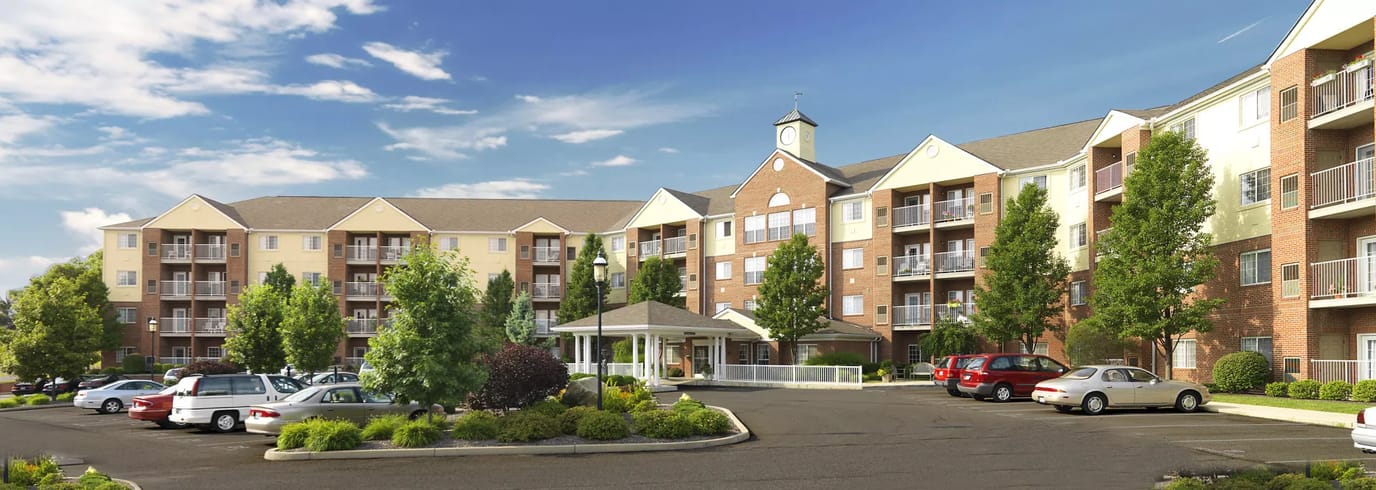
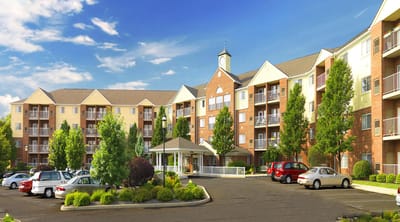
The Carespring Community in Northern Kentucky is an ideal place that provides programs and activities that are enjoyable and nurturing. Offering assisted living, memory care, long-term care, and rehabilitation– their approach to modern senior living promotes a lifestyle centered on growth. Residents are able to learn to love life through the staff’s encouragement of purposeful living.

At a Carespring community, residents are able to feel comfortable and safe because of the welcoming environment that is balanced with the urban and vibrant atmosphere.

Quality ratings

Measured by Centers for Medicare & Medicaid Services (CMS)

Overall rating Info The Overall CMS Rating combines results from health inspections, staffing levels and quality measures. Health inspections carry the most weight. Staffing and quality scores can increase or decrease the final rating based on performance compared to state and national standards.
▲ 42.1% Above KY avg. ▲ 42.1% Above KY avg.KY average: 2.8Click the badge to see the full State ranking.Click here to see the full State ranking.
Health Inspection Info Based on the results of the facility's three most recent standard inspections and any complaint investigations. CMS reviews the number, scope, and severity of deficiencies, with more recent findings weighted more heavily.
▲ 2.8% Above KY avg. ▲ 2.8% Above KY avg.KY average: 2.9Click the badge to see the full State ranking.Click here to see the full State ranking.
Staffing Info Measures average nursing staff hours per resident per day, including Registered Nurses (RNs) and total nursing staff. Ratings are adjusted based on the level of care residents require and are compared to state and national benchmarks.
▲ 12.4% Above KY avg. ▲ 12.4% Above KY avg.KY average: 2.7Click the badge to see the full State ranking.Click here to see the full State ranking.
Quality Measures Info Based on clinical and physical health indicators reported to CMS, such as hospital readmissions, falls, pressure ulcers, and improvements in mobility. These measures reflect how well residents' health needs are being managed.
▲ 72.7% Above KY avg. ▲ 72.7% Above KY avg.KY average: 2.9Click the badge to see the full State ranking.Click here to see the full State ranking.

Staffing hours breakdown

Info Daily nursing hours per resident by staff type, reported to CMS. Higher is generally better — compare this facility to state and national averages to see where staffing stands.

Hours per resident per day — compared to Kentucky state averages

Total nursing care / resident Info This home is ranked 117th out of 193 homes in Kentucky for nurse hours. Total adjusted nursing hours per resident per day, combining RN, LPN, and aide time. CMS adjusts this for case-mix so facilities can be fairly compared.
3h 10m per day
Rank #117 / 193Nurse hours — State benchmarkedThis home is ranked 117th out of 193 homes in Kentucky. Shows adjusted nurse hours per resident per day benchmarked to the Kentucky average, with a ranking across 193 Kentucky facilities. More hours mean more direct care. The national average is about 3.5 hrs; below 3.0 is a red flag.Rankings are based only on facilities in Kentucky that report data for that category. Facilities without available data are excluded from the ranking.Click the rank badge to see the full State ranking.Click here to see the full State ranking.
This facility Kentucky avg (3h 45m per day)
vs Kentucky avg
-16%

2 of 6 metrics below state avg

Standout metric Physical Therapist is +53% above state avg
Staff typeHours / Day / Residentvs state avg
Registered Nurse (RN) Info RNs hold the highest nursing license and can assess residents, interpret test results, and direct care plans. More RN hours per day often signals stronger clinical oversight and faster response to health changes. 50m per day ▲ 10% State avg: 46m per day · National avg: 41m per day
LPN / LVN Info Licensed Practical Nurses (LPNs) or Licensed Vocational Nurses (LVNs) deliver routine hands-on care — medication administration, wound dressing, and monitoring vital signs. They work under RN supervision and make up a large share of daily bedside care. 35m per day ▼ 28% State avg: 48m per day · National avg: 52m per day
Nurse Aide Info Certified Nurse Aides (CNAs) provide the most direct day-to-day assistance: bathing, dressing, feeding, and mobility. Nurse aide hours are typically the largest staffing category and directly affect residents' quality of life. 2h 45m per day ▲ 14% State avg: 2h 24m per day · National avg: 2h 20m per day
Weekend Total Nursing Info Combined nursing hours (RN + LPN + Nurse Aide) per resident per day on weekends. Staffing often drops on weekends — this figure reveals whether the facility maintains adequate coverage outside of weekday hours. 3h 24m per day ▼ 4% State avg: 3h 32m per day · National avg: 3h 27m per day
Physical Therapist Info Hours per resident per day provided by licensed Physical Therapists (PTs) or PT Assistants. PT services help residents recover mobility after injury or illness and are especially important for post-acute (short-stay) rehabilitation. 6m per day ▲ 53% State avg: 4m per day · National avg: 4m per day
Weekend RN Info Registered nurse hours specifically on weekends. Facilities sometimes reduce RN presence on Saturdays and Sundays — a low weekend RN figure compared to weekday hours can indicate reduced clinical oversight when most administrative staff are absent. 35m per day ▲ 13% State avg: 31m per day · National avg: 29m per day

Capacity and availability

Avg. Length of Stay
72 days
Bed community size
110-bed community Rank #70 / 341Bed count — State benchmarkedThis home is ranked 70th out of 341 homes in Kentucky. Shows this facility's certified or reported bed count compared to other Kentucky facilities. Larger communities may offer more amenities, programs, and on-site services for residents and families.Rankings are based only on facilities in Kentucky that report data for that category. Facilities without available data are excluded from the ranking.Click the rank badge to see the full State ranking.Click here to see the full State ranking.
A larger shared setting that may offer more common spaces and organized community services.
Years in operation
19 years in operation Rank #26 / 149Years in operation — State benchmarkedThis home is ranked 26th out of 149 homes in Kentucky. Shows how long this facility has been in operation compared to other Kentucky facilities. Longer operating histories may benefit residents, families, and staff.Rankings are based only on facilities in Kentucky that report data for that category. Facilities without available data are excluded from the ranking.Click the rank badge to see the full State ranking.Click here to see the full State ranking.
A longer operating history, which may indicate experience navigating regulations and delivering ongoing care.
Walk Score
Walk Score: 48 / 100 Rank #176 / 423Walk Score — State benchmarkedThis home is ranked 176th out of 423 homes in Kentucky. Shows how walkable this facility's neighborhood is compared to the average Walk Score across Kentucky facilities. Higher scores benefit residents, families, and staff.Rankings are based only on facilities in Kentucky that report data for that category. Facilities without available data are excluded from the ranking.Click the rank badge to see the full State ranking.Click here to see the full State ranking.
Somewhat walkable. A few nearby services may be reachable on foot, but most trips require transportation.
BBB Rating
BBB Rating: A+ (Not Accredited)
An independent rating from the Better Business Bureau based on factors such as complaint history, transparency, and business practices.
How BBB ratings work

About this community

Occupancy

Occupancy rate
85%
Rank #113 / 209Occupancy rate — State benchmarkedThis home is ranked 113th out of 209 homes in Kentucky. Shows this facility's occupancy rate versus the Kentucky average, with its Statewide rank out of 209. Higher occupancy signals strong local demand and financial stability.Rankings are based only on facilities in Kentucky that report data for that category. Facilities without available data are excluded from the ranking.Click the rank badge to see the full State ranking.Click here to see the full State ranking.
Similar to the Kentucky average: 81.3%
Occupied beds
94 / 110
Average occupied beds in Kentucky homes 80 beds

Awards

National Quality Award 2024 Bronze

License Details

Facility TypeAssisted Living Community
StatusActive
CountyCampbell
License Number101612

Staffing

Key information about the people who lead and staff this community.

Leadership

ContactMr. Barry Bortz, Founder

Therapy & Rehabilitation

3 services
Rehabilitation Services
Respite Care
Short-Term Rehab

Staffing & Medical

1 service
24-Hour Staffing

Additional Services

2 services
Skilled Nursing & Rehabilitation
Long-Term Nursing Care

Amenities & Lifestyle

Activities
Specific ProgramsHemodialysis

Contact Carespring – Barrington of Fort Thomas

Health Inspection History

Inspections since 2018
Total health inspections 3

Kentucky average 2.9


Last Health inspection on Dec 2024

Total health citations
10 Rank #80 / 195Health citations — State benchmarkedThis home is ranked 80th out of 195 homes in Kentucky. Shows this facility's total health deficiency citations benchmarked to the Kentucky State average, with a ranking across all 195 KY facilities. Lower citation counts earn a better rank.Rankings are based only on facilities in Kentucky that report data for that category. Facilities without available data are excluded from the ranking.Click the rank badge to see the full State ranking.Click here to see the full State ranking.

Kentucky average 13.5

Citations per inspection
3.33 Rank #66 / 195Citations per inspection — State benchmarkedThis home is ranked 66th out of 195 homes in Kentucky. Shows average deficiency citations per CMS inspection for this facility versus the Kentucky mean across 195 facilities with citation data. Lower is better.Rankings are based only on facilities in Kentucky that report data for that category. Facilities without available data are excluded from the ranking.Click the rank badge to see the full State ranking.Click here to see the full State ranking.

Kentucky average 4.4


Health citations are formal notices following inspections when they fail to comply with safety and care standards.

All 10 citations resulted from standard inspections.

Breakdown of citation severity (last 8 years)
Critical health citations
0
100% better than Kentucky average

Kentucky average: 1.1


Serious health citations
0
100% better than Kentucky average

Kentucky average: 0.6

0 critical citations Kentucky average: 1.1

0 serious citations Kentucky average: 0.6

10 moderate citations Kentucky average: 11.6

0 minor citations Kentucky average: 0.1
Citations history (last 8 years)
Infection Control moderate citation Dec 06, 2024
Corrected

Nursing Services moderate citation Dec 06, 2024
Corrected

Pharmacy moderate citation Dec 06, 2024
Corrected

Quality of Care moderate citation Dec 06, 2024
Corrected

Staffing Data

Reporting period: October 1 – December 31, 2025 (Q4 2025). Source: CMS Payroll-Based Journal report.

Total staff 204
Employees 183
Contractors 21
Staff to resident ratio 1.48 : 1
14% fewer staff per resident than Kentucky average
Kentucky average ratio: 1.72 : 1 Kentucky average ratio: 1.72 : 1See full Kentucky ranking
Avg staff/day 82
Average shift 7.9 hours
7% worse than Kentucky average
Kentucky average: 8.5 hours Kentucky average shift: 8.5 hoursSee full Kentucky ranking
Total staff hours (quarter) 59,377

Nursing staff breakdown

Q4 2025 · Oct 1 – Dec 31 More info This data comes from the CMS Payroll-Based Journal report covering October 1 – December 31, 2025.
Registered Nurse

Manages medical care and health needs.

RN Staff Info All 17 RN Staff are full-time employees. No contractors work on this role. 17
Average shift length Info Average shift length. Calculated as total hours divided by days worked and average staff per day. 9.3 hours
Licensed Practical Nurse

Assists with medical care and medications.

LPN Staff Info All 16 LPN Staff are full-time employees. No contractors work on this role. 16
Average shift length Info Average shift length. Calculated as total hours divided by days worked and average staff per day. 9.3 hours
Certified Nursing Assistant

Helps with daily care and mobility.

CNA Staff Info All 91 CNA Staff are full-time employees. No contractors work on this role. 91
Average shift length Info Average shift length. Calculated as total hours divided by days worked and average staff per day. 7.6 hours

Contractor staffing

Q4 2025 · Oct 1 – Dec 31 More info This data comes from the CMS Payroll-Based Journal report covering October 1 – December 31, 2025.

Total hours from contractors

7.5%

4,465 contractor hours this quarter

Physical Therapy Aide: 5 Respiratory Therapy Technician: 4 Physical Therapy Assistant: 4 Speech Language Pathologist: 3 Qualified Social Worker: 1 Occupational Therapy Assistant: 1 Qualified Activities Professional: 1 Medical Director: 1 Other Physician: 1

Staff by category

Q4 2025 · Oct 1 – Dec 31 More info This data comes from the CMS Payroll-Based Journal report covering October 1 – December 31, 2025.
Certified Nursing Assistant9109129,00692100%7.6
Registered Nurse170175,47192100%9.3
Licensed Practical Nurse160165,24292100%9.3
Clinical Nurse Specialist170174,2849199%9.1
Medication Aide/Technician9093,0149098%9
RN Director of Nursing9091,9178997%8.8
Nurse Aide in Training130131,8726368%7.4
Respiratory Therapy Technician0441,2147076%6
Physical Therapy Aide0551,0067582%6.6
Physical Therapy Assistant0449006672%6
Speech Language Pathologist0338187076%7.1
Nurse Practitioner1016197986%7.8
Occupational Therapy Aide3035406672%7.5
Physical Therapist1015106672%7.7
Other Dietary Services Staff1014946267%8
Mental Health Service Worker1014736368%7.5
Dietitian1014616571%7.1
Qualified Social Worker0114515863%7.8
Feeding Assistant1014435964%7.5
Administrator1013586571%5.5
Dental Services Staff1012133639%5.9
Occupational Therapy Assistant0113967%6.5
Medical Director0112333%7.5
Qualified Activities Professional0119910%1
Other Physician011533%1.7
91 Certified Nursing Assistant
% of Days 100%
17 Registered Nurse
% of Days 100%
16 Licensed Practical Nurse
% of Days 100%
17 Clinical Nurse Specialist
% of Days 99%
9 Medication Aide/Technician
% of Days 98%
9 RN Director of Nursing
% of Days 97%
13 Nurse Aide in Training
% of Days 68%
4 Respiratory Therapy Technician
% of Days 76%
5 Physical Therapy Aide
% of Days 82%
4 Physical Therapy Assistant
% of Days 72%
3 Speech Language Pathologist
% of Days 76%
1 Nurse Practitioner
% of Days 86%
3 Occupational Therapy Aide
% of Days 72%
1 Physical Therapist
% of Days 72%
1 Other Dietary Services Staff
% of Days 67%
1 Mental Health Service Worker
% of Days 68%
1 Dietitian
% of Days 71%
1 Qualified Social Worker
% of Days 63%
1 Feeding Assistant
% of Days 64%
1 Administrator
% of Days 71%
1 Dental Services Staff
% of Days 39%
1 Occupational Therapy Assistant
% of Days 7%
1 Medical Director
% of Days 3%
1 Qualified Activities Professional
% of Days 10%
1 Other Physician
% of Days 3%

Penalties and fines

Federal penalties imposed by CMS for regulatory violations, including civil money penalties (fines) and denials of payment for new Medicare/Medicaid admissions.

Source: CMS Penalties Database

No penalties in the past 3 years

No civil money penalties or payment denials were reported in the last 3 years.

Quality of care over time

These measures show how residents usually do over time at this home, based on health outcomes and preventive care.

High-risk clinical events score Info A composite score based on pressure ulcers, falls with injury, weight loss, walking ability decline, and activities of daily living decline. 4.9
53% better than Kentucky average

Kentucky average: 10.5

Functional decline score Info A composite score based on activities of daily living decline, walking ability decline, and incontinence. 13.1
31% better than Kentucky average

Kentucky average: 18.9

Long-stay resident measures
Need for Help with Daily Activities Increased Info Percent of long-stay residents whose need for help with daily activities has increased 5.6%
67% better than Kentucky average

Kentucky average: 16.8%

Walking Ability Worsened Info Percent of long-stay residents whose ability to move independently worsened 4.7%
76% better than Kentucky average

Kentucky average: 19.6%

Low Risk Residents with Bowel/Bladder Incontinence Info Percent of low risk long-stay residents who lose control of their bowels or bladder 28.8%
41% worse than Kentucky average

Kentucky average: 20.5%

Falls with Major Injury Info Percent of long-stay residents experiencing one or more falls with major injury 3.5%
6% better than Kentucky average

Kentucky average: 3.8%

High Risk Residents with Pressure Ulcers Info Percent of long-stay high risk residents with pressure ulcers 3.0%
48% better than Kentucky average

Kentucky average: 5.8%

Urinary Tract Infection Info Percent of long-stay residents with a urinary tract infection 0.2%
87% better than Kentucky average

Kentucky average: 1.9%

Lost Too Much Weight Info Percent of long-stay residents who lose too much weight 7.8%
15% worse than Kentucky average

Kentucky average: 6.8%

Depressive Symptoms Info Percent of long-stay residents who have depressive symptoms 37.3%
162% worse than Kentucky average

Kentucky average: 14.3%

Antipsychotic Use Info Percent of long-stay residents who received an antipsychotic medication 16.8%
8% worse than Kentucky average

Kentucky average: 15.6%

Pneumococcal Vaccine Info Percent of long-stay residents assessed and appropriately given the pneumococcal vaccine 99.5%
6% better than Kentucky average

Kentucky average: 93.9%

Influenza Vaccine Info Percent of long-stay residents assessed and appropriately given the seasonal influenza vaccine 98.4%
In line with Kentucky average

Kentucky average: 96.2%

Short-stay resident measures
Pneumococcal Vaccine Info Percent of short-stay residents assessed and appropriately given the pneumococcal vaccine 100.0%
19% better than Kentucky average

Kentucky average: 83.7%

Antipsychotic medication increase Info Percent of short-stay residents who newly received an antipsychotic medication 0.6%
71% better than Kentucky average

Kentucky average: 1.9%

Influenza Vaccine Info Percent of short-stay residents assessed and appropriately given the seasonal influenza vaccine 97.0%
16% better than Kentucky average

Kentucky average: 83.6%

Breakdown by payment type

Medicare

31% of new residents, usually for short-term rehab.

Typical stay 25 days

Private pay

53% of new residents, often for short stays.

Typical stay 1 - 2 months

Medicaid

17% of new residents, often for long-term daily care.

Typical stay 8 - 9 months

Facility Characteristics

Source: CMS Long-Term Care Facility Characteristics (Data as of Jan 2026)

Total residents 138
Medicare
9
6.5% of residents
Medicaid
92
66.7% of residents
Private pay or other
37
26.8% of residents
Programs & Services
Residents Group

Residents meet regularly to discuss policies, care quality, and activities

Nurse Aide Training

State-approved Nurse Aide Training and Competency Evaluation Program on-site

Active Resident Council

Organized group of residents that meets regularly to discuss facility policies, quality of life, and activities.

Finances and operations

Based on CMS SNF Cost Report for fiscal year ending in 12/2023.

For-profit
Corporation
Net patient revenue Info Net patient revenue — what the home actually collects for resident care, after contractual allowances, bad debt and discounts are subtracted from its gross charges (CMS cost report, Worksheet G-3). It covers resident care only; money the home earns from other sources is shown separately as "Other income."
$15.2M
Net patient income Info Net patient income: net patient revenue minus the home's total operating expenses. A positive figure means it earns more from resident care than it spends to deliver it; a negative figure means the opposite. It excludes non-operating "other income."
$374.8K
For-profit Corporation
Net patient revenue Info Net patient revenue — what the home actually collects for resident care, after contractual allowances, bad debt and discounts are subtracted from its gross charges (CMS cost report, Worksheet G-3). It covers resident care only; money the home earns from other sources is shown separately as "Other income."
$15.2M Rank #16 / 197Revenue — State benchmarkedThis home is ranked 16th out of 197 homes in Kentucky. Shows this facility's annual revenue compared to the Kentucky average. Higher revenue generally means more resources for staffing and capital — read alongside Payroll %.Rankings are based only on facilities in Kentucky that report data for that category. Facilities without available data are excluded from the ranking.Click the rank badge to see the full State ranking.Click here to see the full State ranking.
Net patient income Info Net patient income: net patient revenue minus the home's total operating expenses. A positive figure means it earns more from resident care than it spends to deliver it; a negative figure means the opposite. It excludes non-operating "other income."
$374.8K
Other income Info Money the home earns outside of resident care — such as investments, grants, rentals and other non-operating sources (CMS cost report, Worksheet G-3). It is tracked separately from net patient revenue: it is not part of that figure, and it is not included in net patient income.
$33.9K
Payroll costs Info Staff salaries plus wage-related costs — benefits such as payroll taxes, health insurance and retirement — from the home's own accounting records (CMS cost report, Worksheet A). Contract or agency labor is counted separately, under other operating costs. Rank #25 / 197Payroll — State benchmarkedThis home is ranked 25th out of 197 homes in Kentucky. Shows total annual staff payroll benchmarked to the Kentucky average. Higher payroll investment relative to peers often signals better staffing and less reliance on cheaper contract labor.Rankings are based only on facilities in Kentucky that report data for that category. Facilities without available data are excluded from the ranking.Click the rank badge to see the full State ranking.Click here to see the full State ranking.
$7.2M 47.2% of net patient revenue Info Payroll as a share of revenue: staff salaries and wage-related benefits divided by net patient revenue. A higher figure means more of each revenue dollar goes to staff pay. Rank #108 / 197Payroll % — State benchmarkedThis home is ranked 108th out of 197 homes in Kentucky. Shows payroll as a percentage of revenue versus the Kentucky average. Well-run Kentucky facilities typically land around 51–61% — the top third Statewide. Below 25% may signal understaffing or heavy agency use — read with Staffing ratings.Rankings are based only on facilities in Kentucky that report data for that category. Facilities without available data are excluded from the ranking.Click the rank badge to see the full State ranking.Click here to see the full State ranking.
Other operating costs Info Everything it costs to run the home apart from payroll — food, utilities, supplies, maintenance, contract labor and administration. Calculated as total operating expense minus payroll (staff salaries and wage-related benefits).
$7.7M
Total costs Info The home's total operating expense for the year — all the costs of running it, salaries included (CMS cost report, Worksheet G-3).
$14.9M

What does this home offer?

Housing options icon

Housing Options: Studio / 1 Bed / 2 Bed

Building type icon
Building type icon

Building Type: Mid-rise

Transportation services icon

Transportation Services

Fitness and recreation icon

Fitness and Recreation

Who this home usually serves

TYPE OF STAY

Mix of rehab and long-term care

This home supports both short-term rehab and long-term care, with residents staying for a wide range of durations.

Most new residents arrive under private pay (53% of admissions), and a typical private pay stay runs around 1 - 2 months.

Admissions
575 total

Coverage residents most often arrive under.

Medicare 31%
Private pay 53%
Medicaid 17%
Discharges
605 total

Coverage residents most often leave under.

Medicare 20%
Private pay 55%
Medicaid 25%

Places of interest near Carespring – Barrington of Fort Thomas

Address 1.0 miles from city center Info Estimated distance in miles from Fort Thomas's city center to Carespring – Barrington of Fort Thomas's address, calculated via Google Maps.

Calculate Travel Distance to Carespring – Barrington of Fort Thomas

Add your location

Address

Compare Nursing Homes around Covington

The information below is reported by the Kentucky Cabinet for Health and Family Services, Office of Inspector General.

3 facilities compared · CMS & KY Dept. of Health data

Carespring – Barrington of Fort Thomas
NH
AL
IL
RC
Fort Thomas
110
Facility 110
KY AVG 82
Rank #70 / 341
85.2%
Facility 85.2%
KY AVG 81.3%
Rank #113 / 209
+5%
3.16
Facility 3.16
KY AVG 3.75
Rank #117 / 193
-23%-16%
$0
Facility $0
KY AVG $65.4k
Rank #1 / 199
10
Facility 10
KY AVG 13.5
Rank #80 / 195
3.3
Facility 3.3
KY AVG 4.4
Rank #66 / 195
-134A+
48
Facility 48
KY AVG 41
Rank #176 / 423
Carespring Health Care Holdings LP
$15.2M
Facility $15.2M
KY AVG $10.5M
Rank #16 / 197
$7.2M
Facility $7.2M
KY AVG $4.0M
Rank #25 / 197
47.2%
Facility 47.2%
KY AVG 40.7%
Rank #108 / 197
185383
Rosedale Green
NH
HC
MC
NC
PC
Covington
191
Facility 191
KY AVG 82
Rank #7 / 341
88.7%
Facility 88.7%
KY AVG 81.3%
Rank #83 / 209
+9%
4.36
Facility 4.36
KY AVG 3.75
Rank #22 / 193
-58%+16%
$0
Facility $0
KY AVG $65.4k
Rank #1 / 199
10
Facility 10
KY AVG 13.5
Rank #80 / 195
3.3
Facility 3.3
KY AVG 4.4
Rank #66 / 195
2165-
1
Facility 1
KY AVG 41
Rank #404 / 423
Londa Knollman
$18.3M
Facility $18.3M
KY AVG $10.5M
Rank #10 / 197
$7.7M
Facility $7.7M
KY AVG $4.0M
Rank #29 / 197
42.3%
Facility 42.3%
KY AVG 40.7%
Rank #154 / 197
185225
The Pavilion at Kenton
NH
AL
Covington (Wallace Woods)
82
Facility 82
KY AVG 82
Rank #160 / 341
96.3%
Facility 96.3%
KY AVG 81.3%
Rank #26 / 209
+18%
2.89
Facility 2.89
KY AVG 3.75
Rank #162 / 193
+12%-23%
$0
Facility $0
KY AVG $65.4k
Rank #1 / 199
8
Facility 8
KY AVG 13.5
Rank #49 / 195
2.7
Facility 2.7
KY AVG 4.4
Rank #37 / 195
-75-
54
Facility 54
KY AVG 41
Rank #134 / 423
Wildcat Holding LLC
$9.0M
Facility $9.0M
KY AVG $10.5M
Rank #113 / 197
$4.3M
Facility $4.3M
KY AVG $4.0M
Rank #85 / 197
47.9%
Facility 47.9%
KY AVG 40.7%
Rank #74 / 197
185038

Financial Assistance for
Nursing Home in Kentucky

Carespring – Barrington of Fort Thomas is located in Fort Thomas, Kentucky.
Here are the financial assistance programs available to residents in Kentucky.

Get Financial aid guidance

Home and Community Based Waiver

Kentucky Medicaid HCB Waiver

Age 65+ or disabled
General Kentucky resident, Medicaid-eligible, nursing home-level care need.
Income Limits (2025) ~$2,829/month 300% FBR, individual
Asset Limits $2,000 (individual), $3,000 (couple).
KY

Rural focus; waitlists possible.

Benefits
Personal care (5-7 hours/day) Respite (240 hours/year) Homemaker services Home modifications

Hart-Supported Living Program

KY Hart-Supported Living

Age 65+ or disabled
General Kentucky resident.
Income Limits No strict limit; prioritizes low-income.
Asset Limits Not applicable.
KY

Competitive grants; limited availability.

Benefits
In-home support (up to 10 hours/week) Respite (varies) Adaptive equipment (~$500 avg.)

Kentucky Homecare Program

Kentucky Homecare Program

Age 60+
General Kentucky resident, at risk of nursing home placement, not eligible for Medicaid waivers.
Income Limits (2025) No strict limit; prioritizes low-income ~$24,980/year individual
Asset Limits Not assessed; need-based focus.
KY

15 AAAs; rural focus; not in nursing homes.

Benefits
Personal care (4-6 hours/day) Respite (5 days/year) Chore services Meal delivery ($7/meal) Minor home repairs

Medicare Savings Program (MSP)

Kentucky Medicare Savings Program

Age 65+ or disabled
General Kentucky resident, Medicare Part A/B.
Income Limits (2025) ~$2,510/month (QMB), ~$3,380/month (SLMB), ~$3,598/month (QI)—individual.
Asset Limits $9,430 (individual), $14,130 (couple).
KY

Three tiers; no waitlist; auto Extra Help for Part D.

Benefits
Covers Part B premiums ($174.70/month) Deductibles ($240/year) Copays (~20%)

National Family Caregiver Support Program (NFCSP) Respite

Kentucky NFCSP Respite Care

Age
General Caregivers of 60+ needing care or 55+ caregivers of others; Kentucky resident; functional needs (2+ ADLs).
Income Limits (2025) Prioritizes ~$24,980/year (individual); no strict cap.
Asset Limits Not assessed; need-based.
KY

15 AAAs; prioritizes low-income, rural caregivers.

Benefits
Respite (4-6 hours/week or 5 days/year) Adult day care ($55/day) Caregiver training Supplies (~$500/year)

Kentucky Family Caregiver Program

Kentucky Family Caregiver Program

Age
General Grandparents (often 55+) as primary caregivers to grandchildren under 18, Kentucky resident, not on Kinship Care.
Income Limits (2025) ~$31,225/year (individual); varies by AAA.
Asset Limits Not strictly assessed; need-based.
KY

Max $1,500/year; statewide via AAAs.

Benefits
Grants (~$500-$1,500/year) for respite Supplies Care costs; counseling Training

VA Aid and Attendance (A&A) and Housebound Benefits

Kentucky VA Aid and Attendance/Housebound

Age 65+ or disabled veteran/spouse
General Kentucky resident, wartime service, need for ADL help (A&A) or homebound.
Income Limits (2025) Net income < ~$1,984/month (veteran with dependent, A&A); pension offsets income.
Asset Limits ~$155,356 net worth limit
KY

High veteran demand in rural areas.

Benefits
Cash (~$1,433-$2,642/month veteran, ~$951-$1,318 spouse) for care costs (e.g., in-home, assisted living)

Frequently Asked Questions about Carespring – Barrington of Fort Thomas

What neighborhood is Carespring – Barrington of Fort Thomas in?

Carespring – Barrington of Fort Thomas is in the Fort Thomas neighborhood of KY 41075.

Is Carespring – Barrington of Fort Thomas in a walkable area?

Carespring – Barrington of Fort Thomas has a walk score of 48. Somewhat walkable. A few nearby services may be reachable on foot, but most trips require transportation.

What is the license number of Carespring – Barrington of Fort Thomas?

According to state health department records, Carespring – Barrington of Fort Thomas's license number is 101612.

What is the occupancy rate at Carespring – Barrington of Fort Thomas?

Carespring – Barrington of Fort Thomas's occupancy is 85%.

Does Carespring – Barrington of Fort Thomas operate as a for-profit or non-profit?

Carespring – Barrington of Fort Thomas is registered as a for-profit.

How many beds does Carespring – Barrington of Fort Thomas have?

Carespring – Barrington of Fort Thomas has 110 beds.

Are there photos of Carespring – Barrington of Fort Thomas?

Yes — there are 5 photos of Carespring – Barrington of Fort Thomas in the photo gallery on this page.

Guides for Better Senior Living

Care Cost Calculator: See Prices in Your Area

Nursing Home Data Explorer

Don’t Wait Too Long: 7 Red Flag Signs Your Parent Needs Assisted Living Now

The True Cost of Assisted Living in 2025 – And How Families Are Paying For It

Understanding Senior Living Costs: Pricing Models, Discounts & Financial Assistance