


Total staff
225
Employees
104
Contractors
121
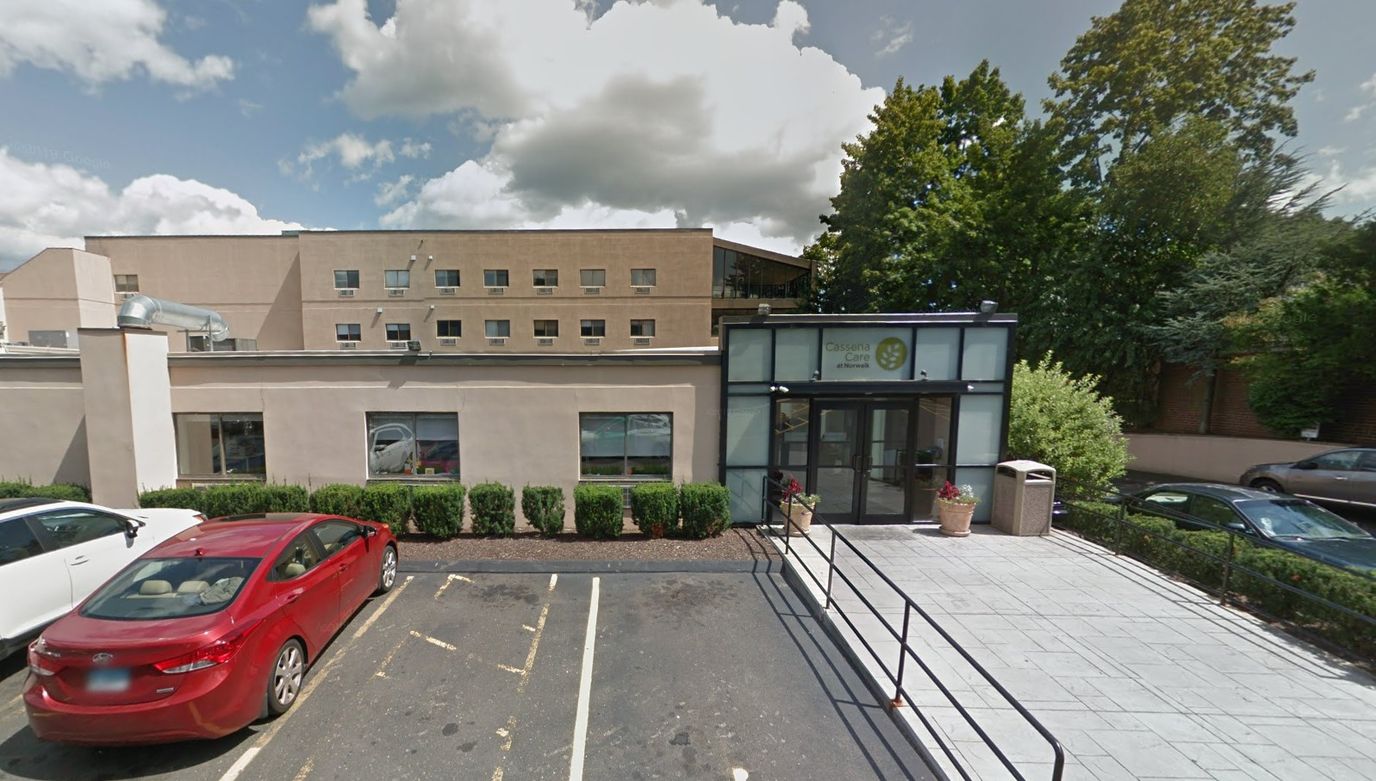


Cassena Care at Norwalk sits on Prospect Street, about a mile from Norwalk’s city center, in a neighborhood where a Walk Score of 76 means most day-to-day errands are within walking distance. The two-story, 150-bed nursing home and assisted living community currently houses 124 residents across private and semi-private rooms. An average stay of 131 days puts this facility squarely in mixed-use territory: short-term rehabilitation stays and longer-term nursing care are both part of the daily population.
Staffing figures reported to CMS put total nursing hours at 3 hours 47 minutes per resident per day. RN hours come in at 32 minutes per resident per day, with LPN/LVN coverage at 50 minutes. The facility accepts Medicare, Medicaid, and private pay, which covers the full range of standard funding pathways for this type of care. CMS Facility Characteristics data notes an Active Resident Council, a Residents Group, and a Family Member Group, indicating organized community governance structures are in place.
Cassena Care at Norwalk is a mid-sized, urban, CMS-certified nursing facility near the center of Norwalk. Stamford Hospital is 7.94 miles away.
They accept all three major payer types and carry a resident population split between short rehabilitation stays and longer nursing care, in a location that is genuinely walkable for visitors and staff.
Staffing hours
![]() Daily nursing hours per resident by staff type, reported to CMS. Higher is generally better — compare this facility to state and national averages to see where staffing stands.
Daily nursing hours per resident by staff type, reported to CMS. Higher is generally better — compare this facility to state and national averages to see where staffing stands.
Hours per resident per day vs Connecticut averages
Total nursing care
![]() This home is ranked 29th out of 65 homes in Connecticut for nurse hours. Total adjusted nursing hours per resident per day, combining RN, LPN, and aide time. CMS adjusts this for case-mix so facilities can be fairly compared.
This home is ranked 29th out of 65 homes in Connecticut for nurse hours. Total adjusted nursing hours per resident per day, combining RN, LPN, and aide time. CMS adjusts this for case-mix so facilities can be fairly compared.
3h 47m
5% below state avg3 of 6 metrics below state avg
Reporting period: October 1 – December 31, 2025 (Q4 2025). Source: CMS Payroll-Based Journal report.
Manages medical care and health needs.
Assists with medical care and medications.
Helps with daily care and mobility.
Total hours from contractors
10,164 contractor hours this quarter
| Certified Nursing Assistant | 64 | 44 | 108 | 29,093 | 92 | 100% | 7.7 |
| Licensed Practical Nurse | 19 | 42 | 61 | 10,015 | 92 | 100% | 7.3 |
| Registered Nurse | 7 | 15 | 22 | 4,522 | 92 | 100% | 8.4 |
| Clinical Nurse Specialist | 5 | 0 | 5 | 1,836 | 65 | 71% | 7.3 |
| Mental Health Service Worker | 3 | 0 | 3 | 964 | 76 | 83% | 6.7 |
| Other Dietary Services Staff | 2 | 0 | 2 | 936 | 87 | 95% | 7.8 |
| Physical Therapy Assistant | 0 | 2 | 2 | 740 | 61 | 66% | 7.9 |
| Speech Language Pathologist | 0 | 2 | 2 | 588 | 71 | 77% | 8 |
| Occupational Therapy Aide | 0 | 1 | 1 | 488 | 65 | 71% | 7.5 |
| Administrator | 2 | 0 | 2 | 480 | 64 | 70% | 7.5 |
| Qualified Social Worker | 0 | 2 | 2 | 470 | 64 | 70% | 6.6 |
| Dietitian | 1 | 0 | 1 | 427 | 57 | 62% | 7.5 |
| Feeding Assistant | 0 | 3 | 3 | 362 | 62 | 67% | 5.2 |
| Physical Therapy Aide | 0 | 1 | 1 | 314 | 37 | 40% | 8.5 |
| Nurse Practitioner | 1 | 0 | 1 | 160 | 22 | 24% | 7.3 |
| Respiratory Therapy Technician | 0 | 3 | 3 | 130 | 22 | 24% | 5.6 |
| Medical Director | 0 | 2 | 2 | 104 | 24 | 26% | 4.3 |
| Occupational Therapy Assistant | 0 | 2 | 2 | 63 | 30 | 33% | 1.8 |
| Other Physician | 0 | 1 | 1 | 32 | 8 | 9% | 4 |
| Physician Assistant | 0 | 1 | 1 | 32 | 4 | 4% | 8 |
Includes penalties issued in 2023-2024
Federal penalties imposed by CMS for regulatory violations, including civil money penalties (fines) and denials of payment for new Medicare/Medicaid admissions.
Source: CMS Penalties Database (Data as of Jan 2026)
Connecticut average: $44K
Connecticut average: 1.7
Connecticut average: 0.1
Penalties are imposed by CMS for violations of federal nursing home regulations.
3 penalties in the past 3 years
Multiple penalties were reported in the last 3 years.
Last updated: Jan 2026
These measures show how residents usually do over time at this home, based on health outcomes and preventive care.
Connecticut average: 10.4
Connecticut average: 21.1
Connecticut average: 18.9%
Connecticut average: 19.2%
Connecticut average: 24.9%
Connecticut average: 3.5%
Connecticut average: 4.6%
Connecticut average: 1.7%
Connecticut average: 6.3%
Connecticut average: 15.2%
Connecticut average: 17.2%
Connecticut average: 87.5%
Connecticut average: 93.5%
Connecticut average: 70.1%
Connecticut average: 1.5%
Connecticut average: 69.8%
Quality measures are calculated from Minimum Data Set (MDS) assessments. For most measures, lower percentages indicate better care quality.
36% of new residents, usually for short-term rehab.
32% of new residents, often for short stays.
32% of new residents, often for long-term daily care.
Source: CMS Long-Term Care Facility Characteristics (Data as of Jan 2026)
Residents meet regularly to discuss policies, care quality, and activities
Family members meet regularly to discuss policies, care quality, and activities
Organized group of family members that meets regularly to discuss facility policies, resident care, and activities.
Organized group of residents that meets regularly to discuss facility policies, quality of life, and activities.
Data sourced from CMS Long-Term Care Facility Characteristics quarterly report. Payer mix reflects the current resident census by primary payment source.
Historical financial and operational data for Cassena Care at Norwalk from 2012–2023, based on CMS SNF Cost Reports.
Key figures below are for fiscal year ending in 09/2023.
Based on CMS SNF Cost Report for fiscal year ending in 09/2023.
No pets allowed
Housing Options: Private Rooms / Semi-Private Rooms
Building Type: Two-story
Transportation Services
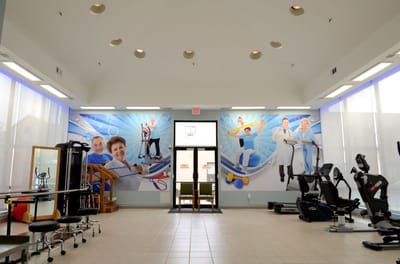
Fitness and Recreation
Most residents typically stay for a few weeks or months before returning home or moving on.
New residents most often arrive under Medicare (36% of admissions), and a typical Medicare stay runs around 1 - 2 months.
Coverage residents most often arrive under.
Coverage residents most often leave under.
![]() 1.0 miles from city center
1.0 miles from city center
![]() Estimated distance in miles from Norwalk's city center to Cassena Care at Norwalk's address, calculated via Google Maps.
— 7.94 miles to nearest hospital (Stamford Hospital)
Estimated distance in miles from Norwalk's city center to Cassena Care at Norwalk's address, calculated via Google Maps.
— 7.94 miles to nearest hospital (Stamford Hospital)
Add your location
Info below is compiled from CMS reports & the CT Dept. of Public Health (DPH), senior community websites & trusted data sources such as Walk Score & BBB.
Communities are listed from highest to lowest based on our ranking methodology.
| Autumn Lake Healthcare at Norwalk | NH HOS MC PC RC SNF | Norwalk (Midrocks Drive) | 150
Facility
150
CT AVG
113
Rank
#24 / 119 |
97.3%
Facility
97.3%
CT AVG
84
Rank
#10 / 104 | +16% | 3.31
Facility
3.31
CT AVG
3.97
Rank
#53 / 65 | -50% | -17% | $12.8k
Facility
$12.8k
CT AVG
$43.8k
Rank
#45 / 67 | 28
Facility
28
CT AVG
32.0
Rank
#33 / 67 | 5.6
Facility
5.6
CT AVG
5.8
Rank
#41 / 67 | - | 146 | A+ |
13
Facility
13
CT AVG
48
Rank
#239 / 262 | Norwalk Operations LLC | $21.4MFiscal year ending 12/2023
Facility
$21.4MFiscal year ending 12/2023
CT AVG
$18.0M
Rank
#16 / 65 | $3.8MFiscal year ending 12/2023
Facility
$3.8MFiscal year ending 12/2023
CT AVG
$10.6M
Rank
#63 / 65 | 17.7%Fiscal year ending 12/2023
Facility
17.7%Fiscal year ending 12/2023
CT AVG
68%
Rank
#62 / 65 | 75387 | ||||
| Cassena Care at Norwalk | NH HOS MC PC RC SNF | Norwalk | 150
Facility
150
CT AVG
113
Rank
#24 / 119 |
87.3%
Facility
87.3%
CT AVG
84
Rank
#58 / 104 | +4% | 3.78
Facility
3.78
CT AVG
3.97
Rank
#29 / 65 | -9% | -5% | $198.2k
Facility
$198.2k
CT AVG
$43.8k
Rank
#67 / 67 | 42
Facility
42
CT AVG
32.0
Rank
#54 / 67 | 7.0
Facility
7.0
CT AVG
5.8
Rank
#52 / 67 | 3 | 131 | - |
76
Facility
76
CT AVG
48
Rank
#43 / 262 | Yong Lee | $17.7MFiscal year ending 09/2023
Facility
$17.7MFiscal year ending 09/2023
CT AVG
$18.0M
Rank
#25 / 65 | $10.1MFiscal year ending 09/2023
Facility
$10.1MFiscal year ending 09/2023
CT AVG
$10.6M
Rank
#34 / 65 | 56.9%Fiscal year ending 09/2023
Facility
56.9%Fiscal year ending 09/2023
CT AVG
68%
Rank
#41 / 65 | 75159 |
Cassena Care at Norwalk is located in Norwalk, Connecticut.
Here are the financial assistance programs available to residents in Connecticut.
Cassena Care at Norwalk has a walk score of 76. Very walkable. Most errands can be accomplished on foot, and many essentials are within a short walk.
Cassena Care at Norwalk's occupancy is 84.2%.
No, Cassena Care at Norwalk has a no-pet policy.
Cassena Care at Norwalk is registered as a for-profit.
Yes — there are 4 photos of Cassena Care at Norwalk in the photo gallery on this page.
Cassena Care at Norwalk is located at 23 Prospect St, Norwalk, CT 06850.
(203) 853-0010 will put you in contact with the team at Cassena Care at Norwalk.
Care Cost Calculator: See Prices in Your Area
Nursing Home Data Explorer
Don’t Wait Too Long: 7 Red Flag Signs Your Parent Needs Assisted Living Now
The True Cost of Assisted Living in 2025 – And How Families Are Paying For It
Understanding Senior Living Costs: Pricing Models, Discounts & Financial Assistance


