Explore Open Rooms

1 Contact details
2 What type of senior care service are you looking for?
3 What budget do you have in mind for senior care?
4 How soon do you need to find care?
5 Additional details

Thank you for your interest!

Our team will be in touch shortly to help with next steps.

Memory Care Home

Cedarview Rehabilitation & Nursing Care

Memory Care Home

Cedarview Rehabilitation & Nursing Care

115 Oregonia Rd, Lebanon, OH 45036 View map
Overview of Cedarview Rehabilitation & Nursing Care

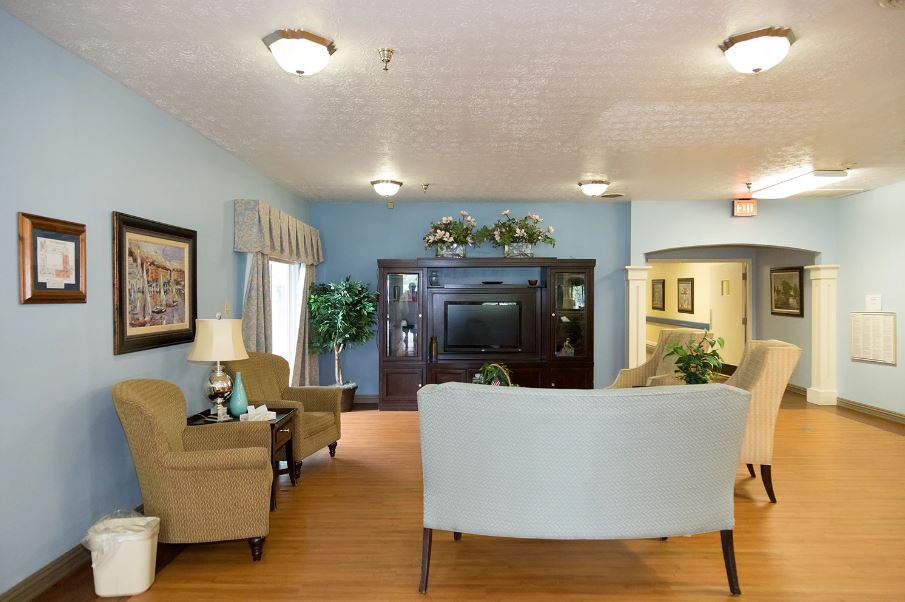
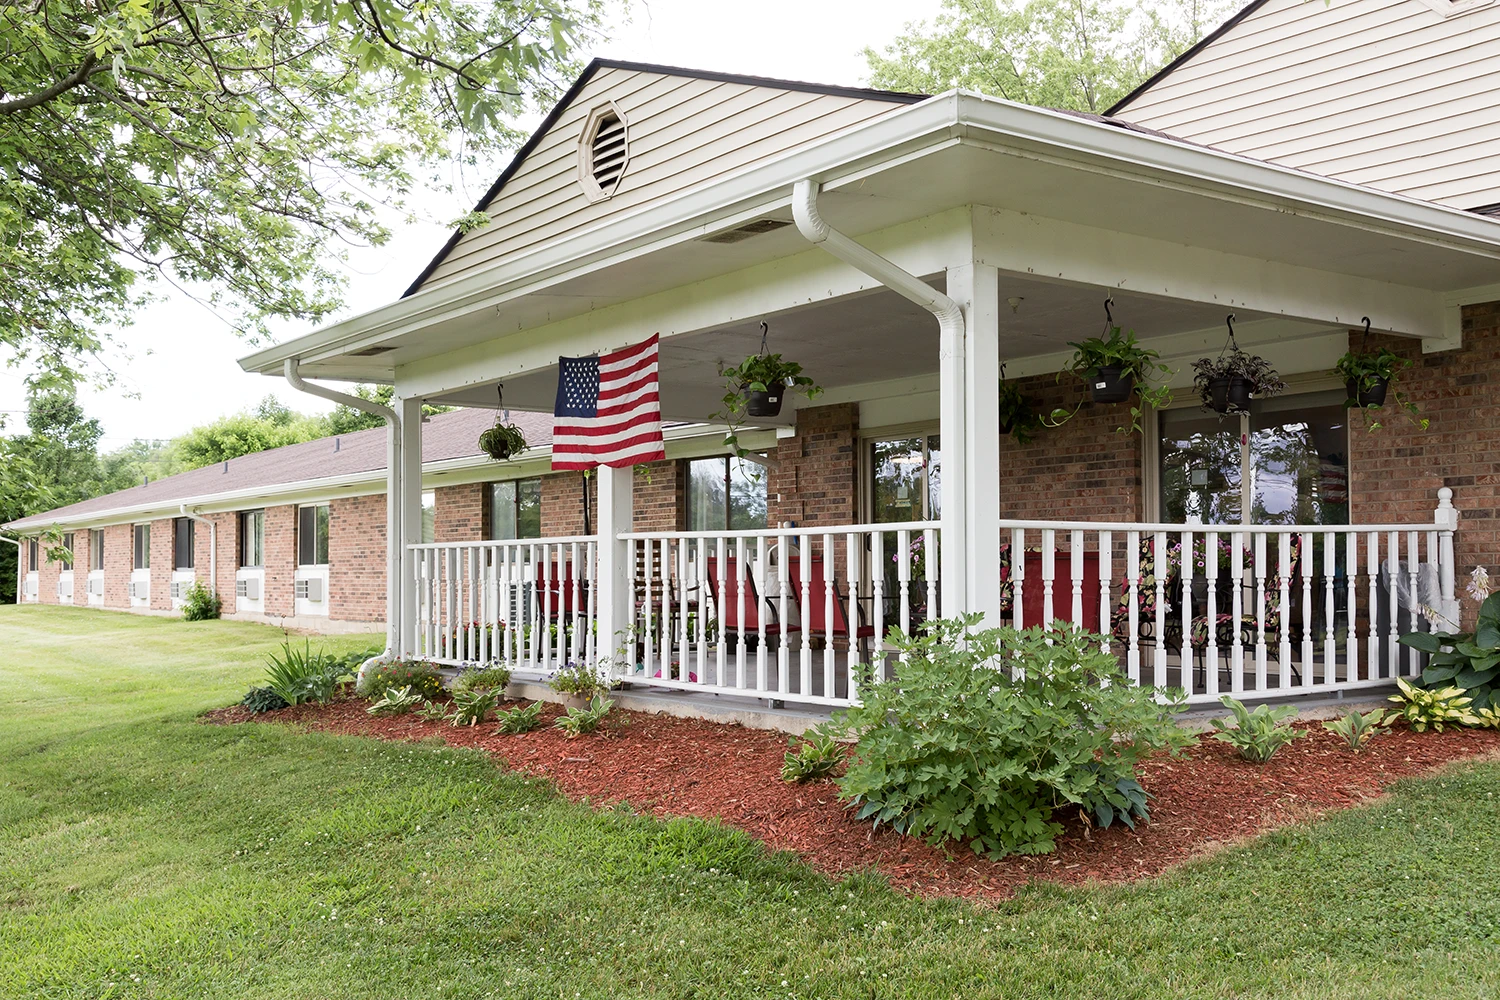
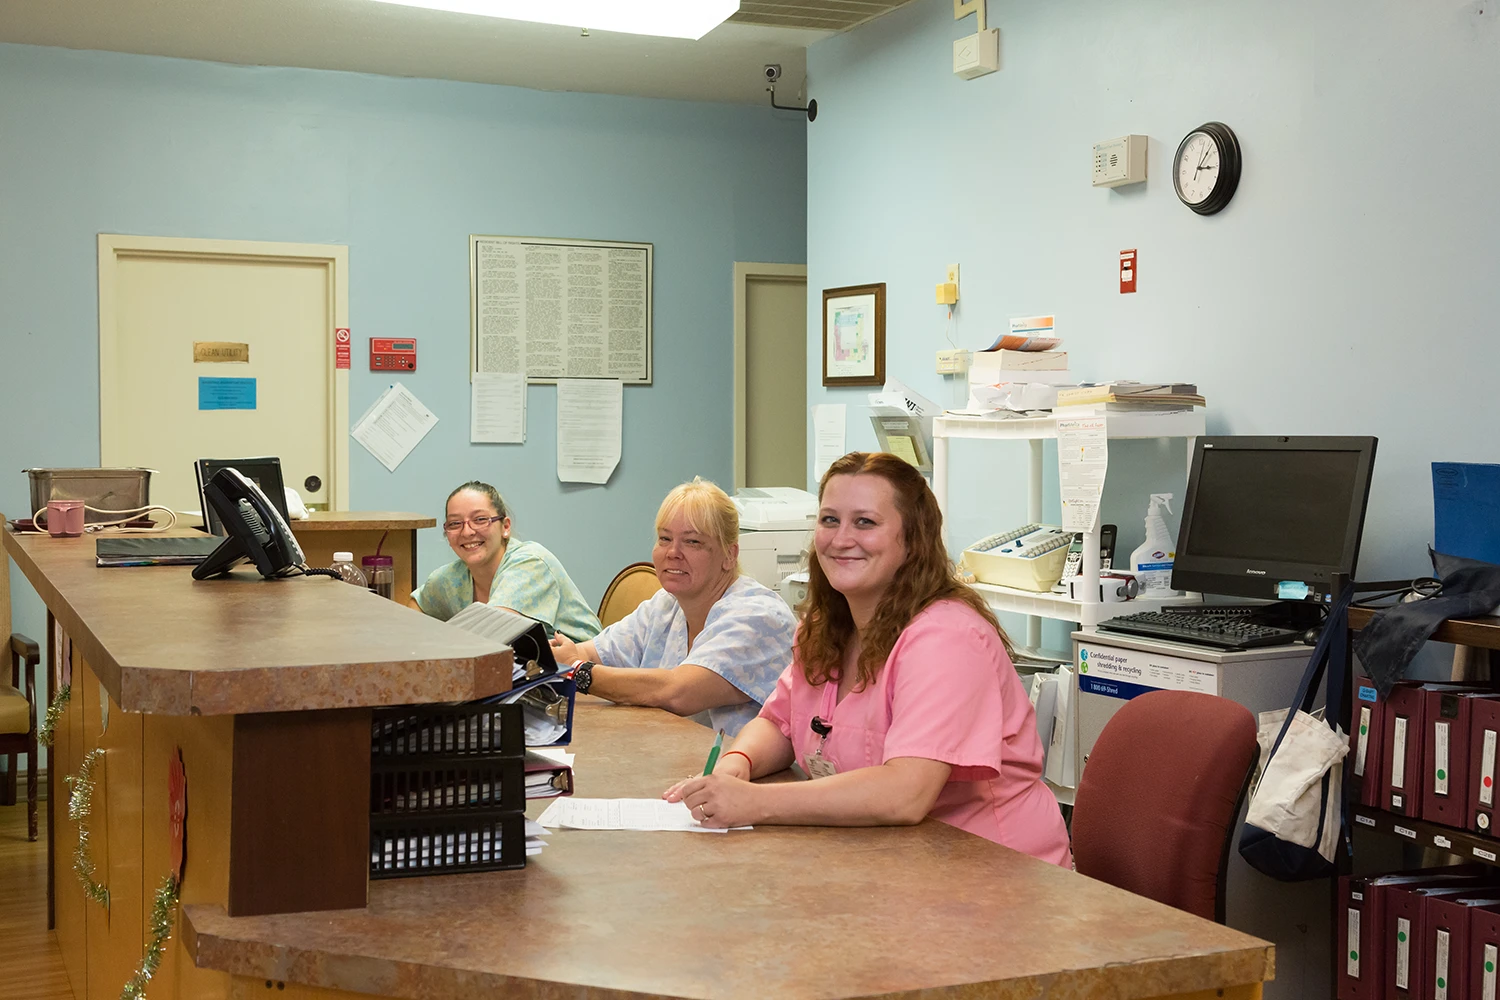
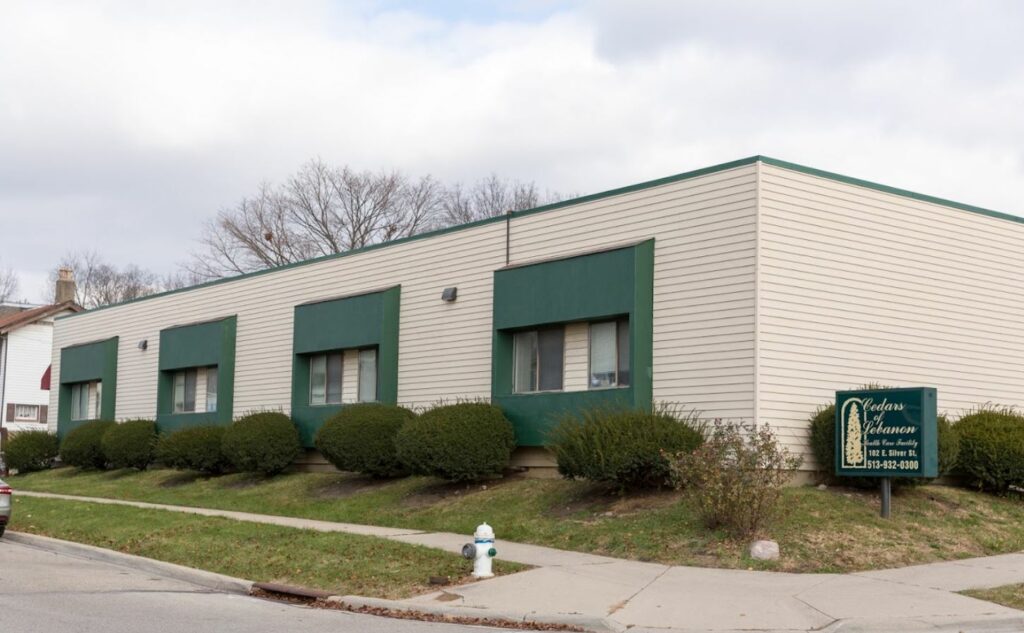
Located in Lebanon, OH, Cedarview Rehabilitation & Living Center is a premier senior care provider, offering short-term care, long-term care, memory care, and respite stays. Residents have peace of mind, knowing they are in good hands with a team of nurses and care professionals with years of experience in hands-on care. The community works closely with residents, their families, or guardians in creating a personalized care plan that fully understands residents’ pain points.

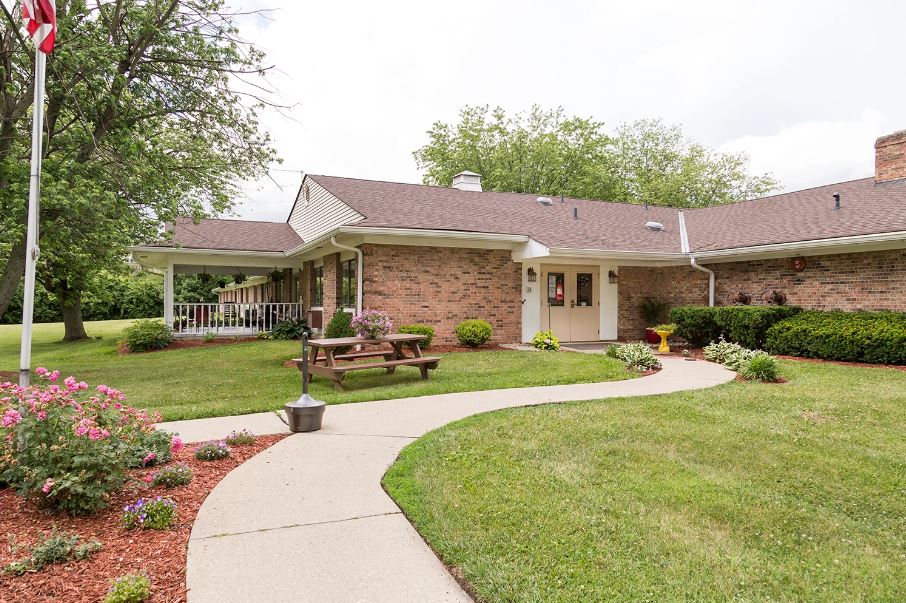
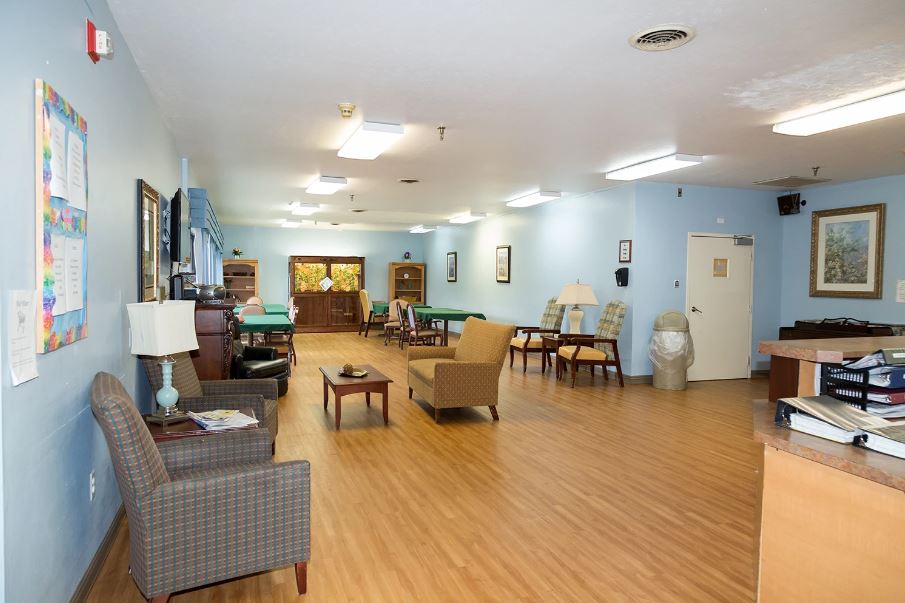
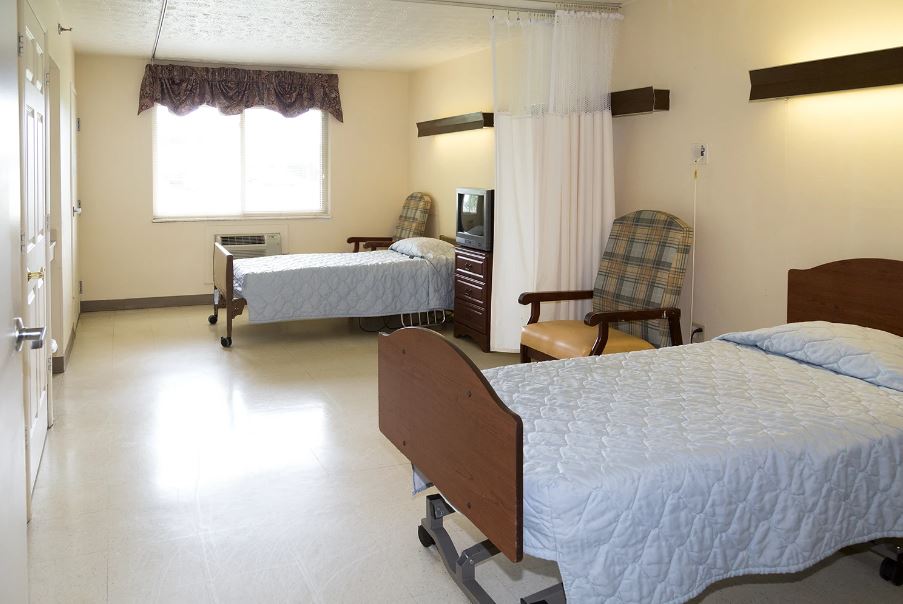
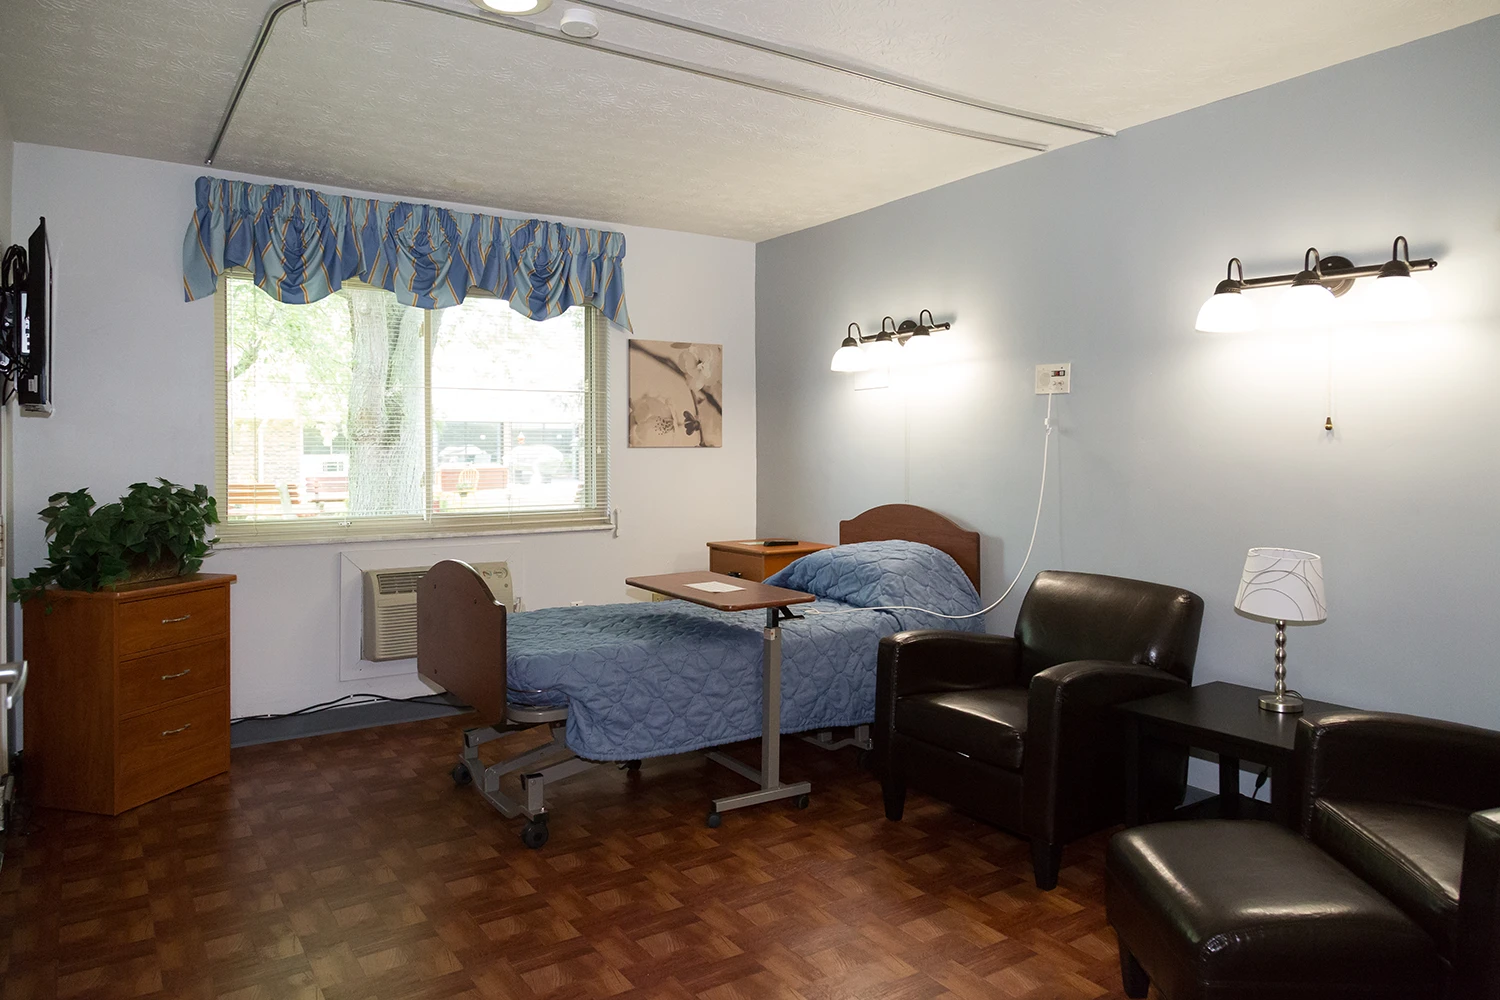
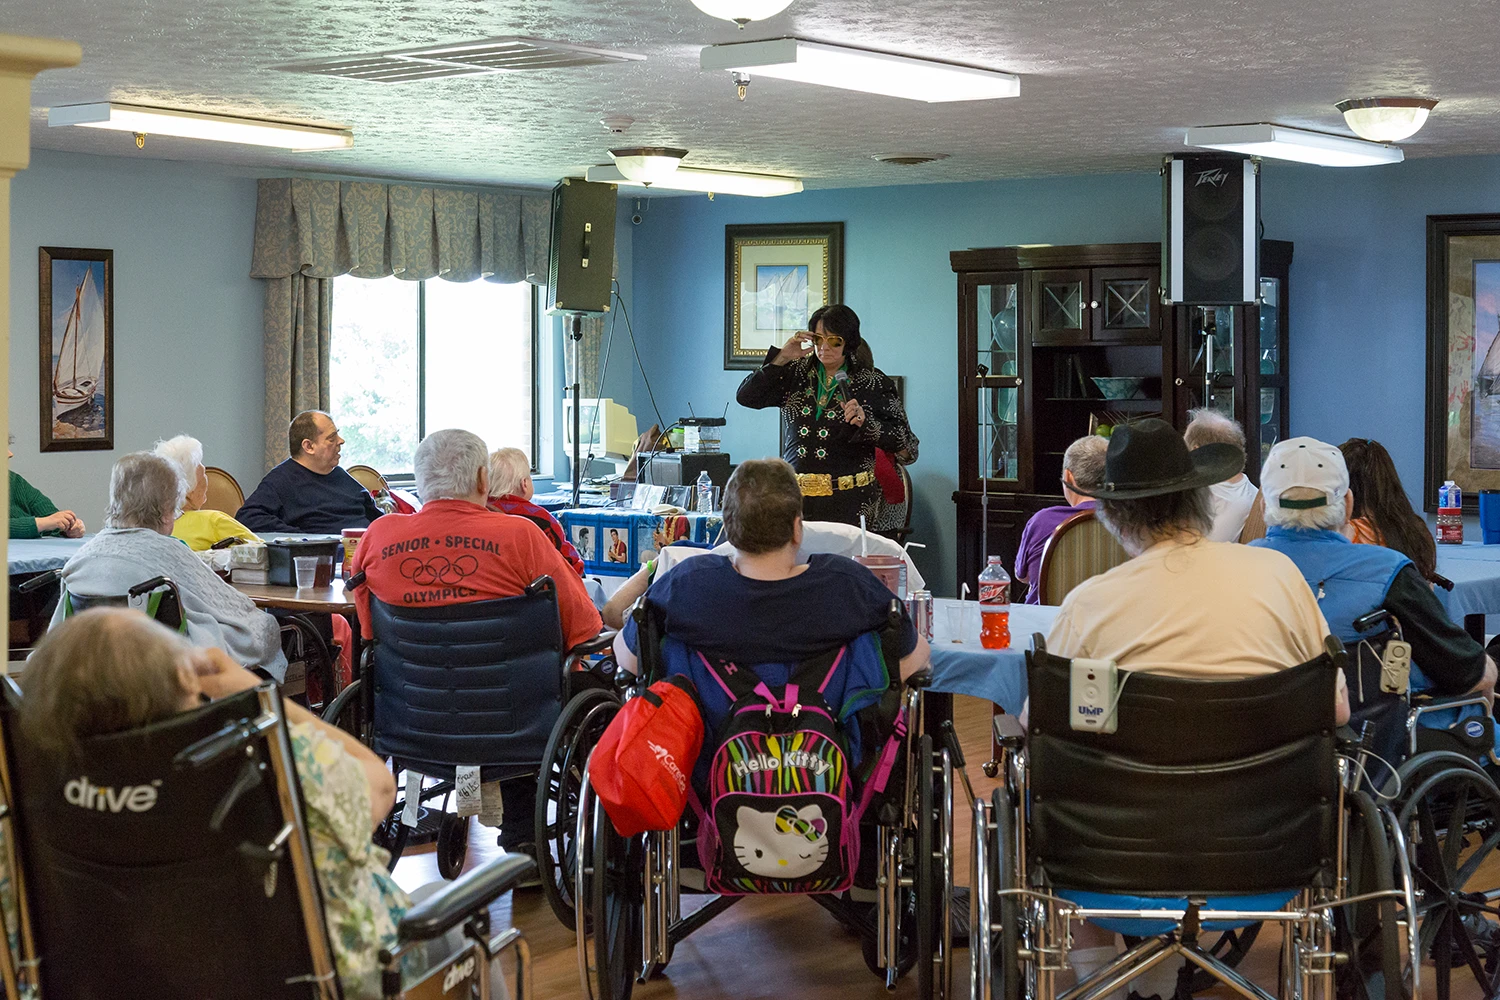
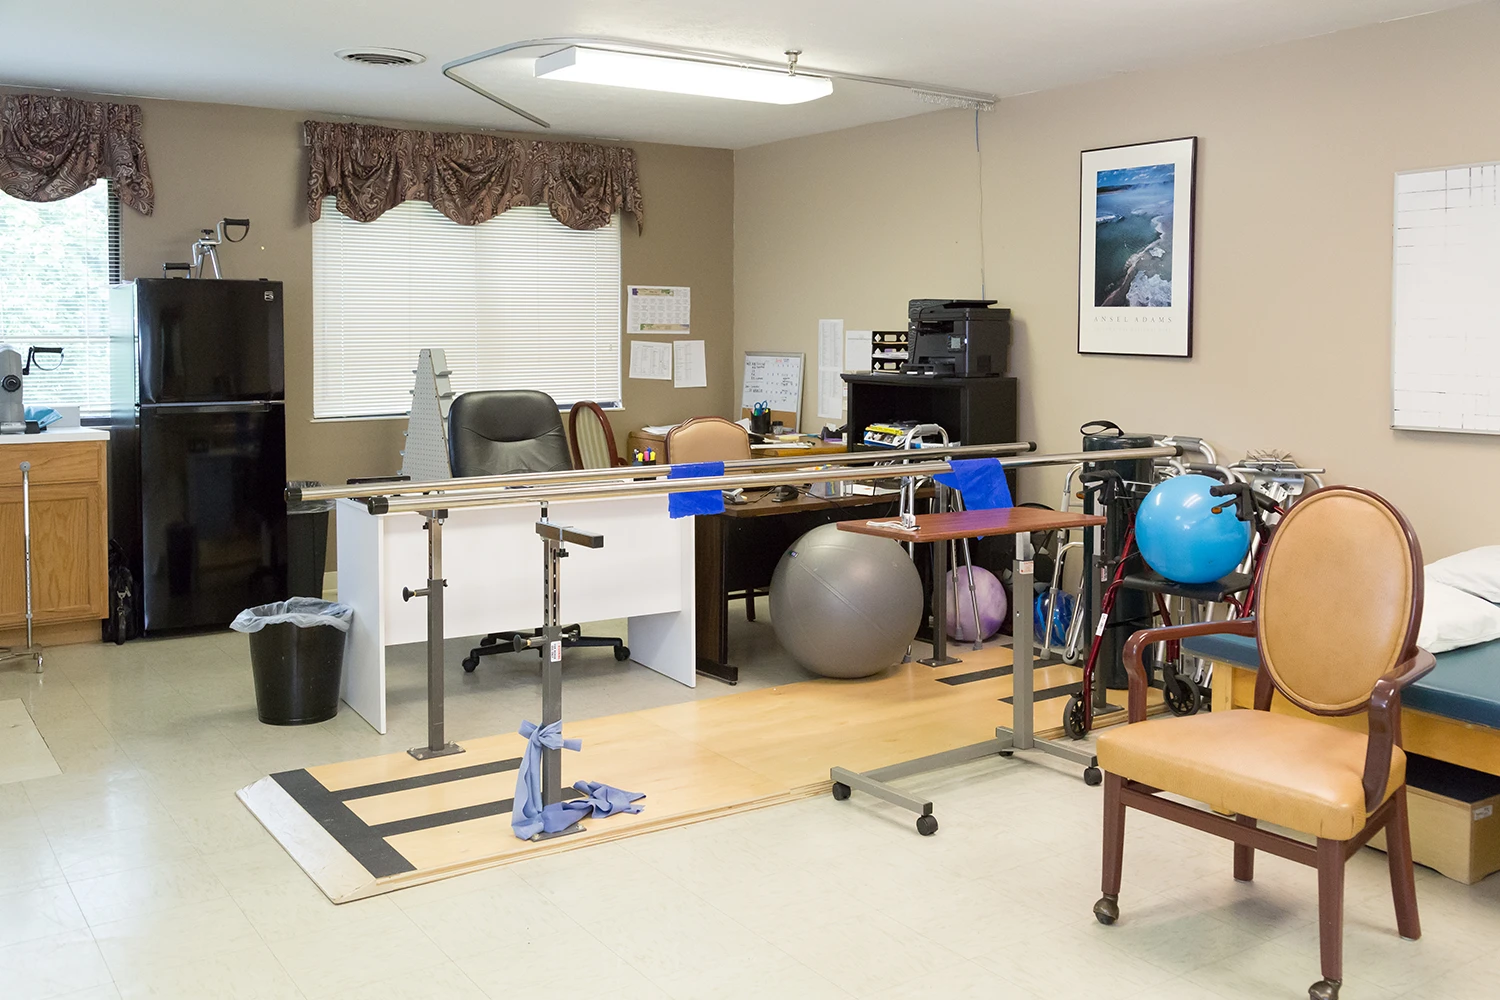
The community ensures residents have a pleasant healing and recovery journey with well-designed suites and lounges. Custom care plans are complemented with a variety of activities and events, such as weekly excursions, religious services, and daily activities, promoting a vibrant everyday life. Residents are sure to enjoy an exquisite dining experience with gourmet meals tailored to their dietary preferences and requirements. Amenities like an on-site beauty salon and beautiful outdoor spaces add to residents’ healing experience.

Quality ratings

Measured by Centers for Medicare & Medicaid Services (CMS)

Overall rating Info The Overall CMS Rating combines results from health inspections, staffing levels and quality measures. Health inspections carry the most weight. Staffing and quality scores can increase or decrease the final rating based on performance compared to state and national standards.
3/5
Ohio average: 3.2/5
Health Inspection Info Based on the results of the facility's three most recent standard inspections and any complaint investigations. CMS reviews the number, scope, and severity of deficiencies, with more recent findings weighted more heavily.
3/5
Ohio average: 2.8/5
Staffing Info Measures average nursing staff hours per resident per day, including Registered Nurses (RNs) and total nursing staff. Ratings are adjusted based on the level of care residents require and are compared to state and national benchmarks.
3/5
Ohio average: 2.4/5
Quality Measures Info Based on clinical and physical health indicators reported to CMS, such as hospital readmissions, falls, pressure ulcers, and improvements in mobility. These measures reflect how well residents' health needs are being managed.
4/5
Ohio average: 4.4/5

Nursing care per resident

Info This shows how many total hours of nursing staff time are available per resident each day. Higher numbers usually mean more staff support.
3h 24m per day

This home provides 4% less nursing time per resident than the Ohio average.

Ohio average: 3h 32m per day

Staffing hours breakdown

Info Hours of care per resident per day, broken down by staff type. Data from CMS Medicare.
Staff type Facility State avg National avg
Registered Nurse (RN) Info Registered nurse hours per resident per day. 54m per day 38m per day 41m per day
Nurse Aide Info Nurse aide hours per resident per day. 2h 15m per day 2h 8m per day 2h 21m per day
Total Nursing (Weekend) Info Total number of nurse staff hours per resident per day on weekends. 3h 25m per day 3h 17m per day 3h 26m per day
Physical Therapist Info Physical therapist staff hours per resident per day. 4m per day 3m per day 4m per day
RN (Weekend) Info Registered nurse hours per resident per day on weekends. 46m per day 25m per day 29m per day

Capacity and availability

Smaller home

May offer a more intimate, personalized care environment.

Total beds 83

This home usually has limited availability

Occupancy is moderate, suggesting balanced demand.

Similar demand to the Ohio average
Occupancy rate 85.5%
Residents per day (avg) 69
Occupancy rate
85.5%
Residents per day (avg)
69

Who this home usually serves

TYPE OF STAY

Mix of rehab and long-term care

This home supports both short-term rehab and long-term care, with residents staying for a wide range of durations.

Breakdown by payment type

Medicare

25% of new residents, usually for short-term rehab.

Typical stay 1 - 2 months

Private pay

57% of new residents, often for short stays.

Typical stay 1 - 2 months

Medicaid

18% of new residents, often for long-term daily care.

Typical stay 2 years

Finances and operations

Privately-owned community
Operated by a business corporation.
Home revenue
$13.6M
Profit
$2.4M
Privately-owned community Operated by a business corporation.
Home revenue
$13,637,606.00
Profit
$2,412,336.00
Payroll costs Info The portion of the home's budget spent on staff, including nurses, caregivers, and other employees who support care and operations.
$4.8M
35.1% of revenue
Other operating costs Info All remaining costs needed to run the home, such as food, utilities, building maintenance, supplies and administrative expenses.
$6.4M
Total costs $11.2M
Walk Score
Walk Score: 35 / 100
Somewhat walkable. A few nearby services may be reachable on foot, but most trips require transportation.

About this community

Care Services

Nursing Services
Rehabilitation Services
Respite Care
Memory Care
Skilled Nursing
Licensed Nurses/CNAs
24-Hour Staffing
Short-Term Rehab

All Levels of Care

Long-Term Care
Short-Term Rehab
Memory Care
Ventilator Program
Wound Care.

Amenities & Lifestyle

Gourmet meals
On-site beauty salon
Updated suites and lounges
Outdoor seating areas
Weekly outings
Religious services
Daily activities
Socials and meet ups.

Programs & Activities

Activities
Comprehensive activity schedule available.
Specific Programs
Long-Term Care, Short-Term Rehab, Memory Care, Ventilator Program, Wound Care, Respite Care, IV Therapy, Pain Management, Dementia Care, Local Physician Rounding on Staff, Staff Psychologist.
Religious Services
Yes

Dining & Nutrition

Food Description
Gourmet meals available.

What does this home offer?

Housing options icon

Housing Options: 1 Bed / 2 Bed

Building type icon
Building type icon

Building Type: Single-story

Transportation services icon

Transportation Services

Fitness and recreation icon

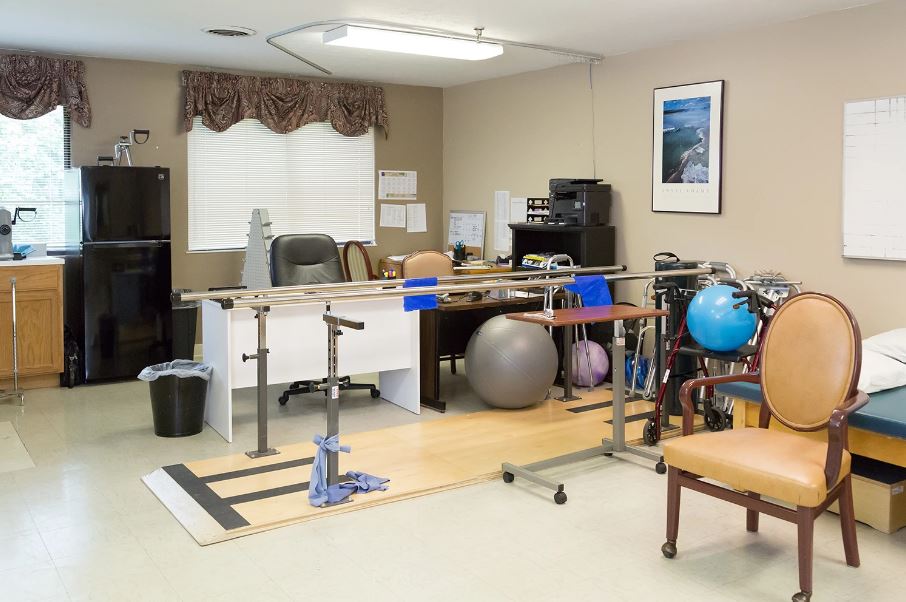
Fitness and Recreation

Types of Care at Cedarview Rehabilitation & Nursing Care

Assisted Living Memory Care Respite Care

Health Inspection History

Inspections
Total health inspections 8

Ohio average 6.7


Last Health inspection on Aug 2024

Total health citations 36

Ohio average 30.9

Citations per inspection
4.5

Ohio average 4.59


Health citations are formal notices following inspections when they fail to comply with safety and care standards.

22 of 36 citations resulted from standard inspections; 12 of 36 resulted from complaint investigations; and 2 of 36 came from combined inspections (standard and complaint).

Breakdown of citation severity (last 3 years)
Critical Health citations More info 0
100% better than Ohio average

Ohio average: 0.3


Serious Health citations More info 0
100% better than Ohio average

Ohio average: 0.9

0 critical citations More info Ohio average: 0.3

0 serious citations More info Ohio average: 0.9

34 moderate citations More info Ohio average: 29

2 minor citations More info Ohio average: 0.7
Citations history (last 3 years)
Pharmacy moderate citation Info Issues related to medication management, including how drugs are stored, administered, and monitored. Aug 13, 2024
Corrected

Quality of Care moderate citation Info Issues related to how well residents receive appropriate treatment and support for their medical and daily care needs. May 15, 2024
Corrected

Care Planning moderate citation Info Issues related to creating and updating personalized care plans for residents based on their needs and conditions. May 15, 2024
Corrected

Environmental moderate citation Info Issues related to building safety, cleanliness, maintenance, and overall living conditions. Apr 18, 2024
Corrected

Compare Memory Care around Lebanon The information below is reported by the Ohio Department of Health, Bureau of Survey and Certification.

Cedarview Rehabilitation & Nursing Care
NH

Nursing Home Licensed facility providing 24/7 skilled nursing care for residents with complex, ongoing medical needs. Staffed by RNs, LPNs, and CNAs. Inspected and star-rated annually by CMS. Accepts Medicare (short-term rehab) and Medicaid (long-term care).

AL

Assisted Living A licensed, long-term care setting for seniors or individuals with disabilities who need help with daily activities — like bathing, dressing, and medication management — but not 24-hour skilled nursing. Offers housing, meals, and around-the-clock support while aiming to maximize resident independence.

MC

Memory Care Secured, specialized care for people living with Alzheimer's or dementia. Staff trained in cognitive impairment, with higher staff-to-resident ratios and an environment designed to reduce confusion and wandering risk.

RC

Respite Care Short-term temporary care — days to weeks — to give family caregivers a break. Full care provided during the stay. Often used after hospitalization or to trial a facility before a permanent placement decision.

Lebanon
83
-
35
1 Bed / 2 Bed
-
-
-
Cedars of Lebanon Rehabilitation & Nursing Care
NH

Nursing Home Licensed facility providing 24/7 skilled nursing care for residents with complex, ongoing medical needs. Staffed by RNs, LPNs, and CNAs. Inspected and star-rated annually by CMS. Accepts Medicare (short-term rehab) and Medicaid (long-term care).

AL

Assisted Living A licensed, long-term care setting for seniors or individuals with disabilities who need help with daily activities — like bathing, dressing, and medication management — but not 24-hour skilled nursing. Offers housing, meals, and around-the-clock support while aiming to maximize resident independence.

MC

Memory Care Secured, specialized care for people living with Alzheimer's or dementia. Staff trained in cognitive impairment, with higher staff-to-resident ratios and an environment designed to reduce confusion and wandering risk.

RC

Respite Care Short-term temporary care — days to weeks — to give family caregivers a break. Full care provided during the stay. Often used after hospitalization or to trial a facility before a permanent placement decision.

Lebanon
45
-
83
1 Bed / 2 Bed
-
-
-
Otterbein SeniorLife
AL

Assisted Living A licensed, long-term care setting for seniors or individuals with disabilities who need help with daily activities — like bathing, dressing, and medication management — but not 24-hour skilled nursing. Offers housing, meals, and around-the-clock support while aiming to maximize resident independence.

Lebanon
-
-
0
1 Bed / 2 Bed
-
-
-

Places of interest near Cedarview Rehabilitation & Nursing Care

Address 1.1 miles from city center

Address 115 Oregonia Rd, Lebanon, OH 45036

Calculate Travel Distance to Cedarview Rehabilitation & Nursing Care

Add your location

Address

Staffing Data (Q2 2025)

This data corresponds to Q2 2025 and is based on CMS Payroll-Based Journal.

Total staff 328
Employees 86
Contractors 242
Staff to resident ratio 4.56:1
112% better than Ohio average

Ohio average ratio: 2.14:1

Avg staff/day 45
Average shift 8.1 hours
0% compared with Ohio average

Ohio average: 8.1 hours

Total staff hours (quarter) 33,085
Nursing staff breakdown
Registered Nurse

Manages medical care and health needs.

Total count 58
Average shift length Info Average shift length. Calculated as total hours divided by days worked and average staff per day. 8.9 hours

This role is partially covered by contractors.

Licensed Practical Nurse

Assists with medical care and medications.

Total count 75
Average shift length Info Average shift length. Calculated as total hours divided by days worked and average staff per day. 8.9 hours

This role is partially covered by contractors.

Certified Nursing Assistant

Helps with daily care and mobility.

Total count 152
Average shift length Info Average shift length. Calculated as total hours divided by days worked and average staff per day. 8.4 hours

This role is partially covered by contractors.

Contractor staffing

Total hours from contractors

22.3%

7,379 contractor hours this quarter

Certified Nursing Assistant: 111 Licensed Practical Nurse: 61 Registered Nurse: 43 Qualified Activities Professional: 6 Qualified Social Worker: 5 Physical Therapy Assistant: 3 Physical Therapy Aide: 3 Respiratory Therapy Technician: 2 Speech Language Pathologist: 2 Physician Assistant: 2 Medical Director: 2 RN Director of Nursing: 1 Occupational Therapy Assistant: 1
Staff by category
Certified Nursing Assistant4111115214,18491100%8.4
Licensed Practical Nurse1461755,98891100%8.9
Registered Nurse1543585,19691100%8.9
Qualified Activities Professional66122,64491100%8.9
RN Director of Nursing3141,3967582%7.2
Other Dietary Services Staff5051,3898088%7.5
Nurse Practitioner1014966268%8
Respiratory Therapy Technician0224115965%7
Speech Language Pathologist0223636774%5.4
Physical Therapy Aide0332965156%5.4
Administrator1012082629%8
Qualified Social Worker0551854752%3.3
Physical Therapy Assistant0331246369%1.9
Physician Assistant0221162932%4
Medical Director022632629%2.3
Occupational Therapy Assistant0112533%8.2
152 Certified Nursing Assistant
% of Days 100%
75 Licensed Practical Nurse
% of Days 100%
58 Registered Nurse
% of Days 100%
12 Qualified Activities Professional
% of Days 100%
4 RN Director of Nursing
% of Days 82%
5 Other Dietary Services Staff
% of Days 88%
1 Nurse Practitioner
% of Days 68%
2 Respiratory Therapy Technician
% of Days 65%
2 Speech Language Pathologist
% of Days 74%
3 Physical Therapy Aide
% of Days 56%
1 Administrator
% of Days 29%
5 Qualified Social Worker
% of Days 52%
3 Physical Therapy Assistant
% of Days 69%
2 Physician Assistant
% of Days 32%
2 Medical Director
% of Days 29%
1 Occupational Therapy Assistant
% of Days 3%

Facility Characteristics

Source: CMS Long-Term Care Facility Characteristics (Data as of Jan 2026)

Total census
72 residents
Residents by payment source
Medicare
9 residents (12.5%)
Medicaid
56 residents (77.8%)
Private pay or other
7 residents (9.7%)
Programs & Services
Residents' Group

Residents meet regularly to discuss policies, care quality, and activities

Active Resident Council

Organized group of residents that meets regularly to discuss facility policies, quality of life, and activities.

Quality of care over time

These measures show how residents usually do over time at this home, based on health outcomes and preventive care.

High-risk clinical events score Info A composite score based on pressure ulcers, falls with injury, weight loss, walking ability decline, and activities of daily living decline. 6.6
13% worse than Ohio average

Ohio average: 5.8

Functional decline score Info A composite score based on activities of daily living decline, walking ability decline, and incontinence. 12.9
In line with Ohio average

Ohio average: 12.7

Long-stay resident measures
Significantly above average Ohio avg: 4.8 Info CMS star rating based on long-stay quality measure performance. 5 stars = significantly above average, 1 star = significantly below average.
Need for Help with Daily Activities Increased Info Percent of long-stay residents whose need for help with daily activities has increased 3.9%
43% better than Ohio average

Ohio average: 6.8%

Walking Ability Worsened Info Percent of long-stay residents whose ability to move independently worsened 11.8%
32% worse than Ohio average

Ohio average: 8.9%

Low Risk Residents with Bowel/Bladder Incontinence Info Percent of low risk long-stay residents who lose control of their bowels or bladder 22.9%
In line with Ohio average

Ohio average: 22.0%

Falls with Major Injury Info Percent of long-stay residents experiencing one or more falls with major injury 1.7%
51% better than Ohio average

Ohio average: 3.4%

High Risk Residents with Pressure Ulcers Info Percent of long-stay high risk residents with pressure ulcers 7.3%
87% worse than Ohio average

Ohio average: 3.9%

Urinary Tract Infection Info Percent of long-stay residents with a urinary tract infection 0.0%
100% better than Ohio average

Ohio average: 0.5%

Lost Too Much Weight Info Percent of long-stay residents who lose too much weight 8.1%
31% worse than Ohio average

Ohio average: 6.2%

Depressive Symptoms Info Percent of long-stay residents who have depressive symptoms 14.6%
39% better than Ohio average

Ohio average: 24.0%

Antipsychotic Use Info Percent of long-stay residents who received an antipsychotic medication 8.0%
6% better than Ohio average

Ohio average: 8.4%

Pneumococcal Vaccine Info Percent of long-stay residents assessed and appropriately given the pneumococcal vaccine 99.6%
8% better than Ohio average

Ohio average: 92.4%

Influenza Vaccine Info Percent of long-stay residents assessed and appropriately given the seasonal influenza vaccine 100.0%
6% better than Ohio average

Ohio average: 94.5%

Hospitalizations per 1,000 days Info Number of hospitalizations per 1,000 long-stay resident days. 2.38
34% worse than Ohio average

Ohio average: 1.77

ED visits per 1,000 days Info Number of outpatient emergency department visits per 1,000 long-stay resident days. 2.27
24% worse than Ohio average

Ohio average: 1.83

Short-stay resident measures
Average Ohio avg: 1.9 Info CMS star rating based on short-stay quality measure performance. 5 stars = much above average, 1 star = much below average.
Pneumococcal Vaccine Info Percent of short-stay residents assessed and appropriately given the pneumococcal vaccine 93.3%
20% better than Ohio average

Ohio average: 78.0%

Antipsychotic medication increase Info Percent of short-stay residents who newly received an antipsychotic medication 1.2%
7% better than Ohio average

Ohio average: 1.3%

Influenza Vaccine Info Percent of short-stay residents assessed and appropriately given the seasonal influenza vaccine 88.1%
17% better than Ohio average

Ohio average: 75.6%

Re-hospitalized after SNF stay Info Percentage of short-stay residents who were re-hospitalized after their nursing home admission. 18.6%
26% better than Ohio average

Ohio average: 25.1%

Emergency department visits Info Percentage of short-stay residents who had an outpatient emergency department visit. 18.6%
49% worse than Ohio average

Ohio average: 12.5%

Falls with major injury Info Percentage of SNF residents who experience falls with major injury during their stay. 0.0%
100% better than Ohio average

Ohio average: 0.8%

Ability to care for self at discharge Info Percentage of residents at or above expected ability to care for themselves at discharge. 60.0%
12% better than Ohio average

Ohio average: 53.7%

Successful return to home or community Info Rate of successful return to home or community from a skilled nursing facility. 40.1%
21% worse than Ohio average

Ohio average: 50.6%

Penalties and fines

Federal penalties imposed by CMS for regulatory violations, including civil money penalties (fines) and denials of payment for new Medicare/Medicaid admissions.

Source: CMS Penalties Database (Data as of Jan 2026)

Total fines amount $0
100% lower than Ohio average

Ohio average: $69K

Number of fines 0
100% fewer fines than Ohio average

Ohio average: 1.9

Payment Denials Info Serious action where Medicare and/or Medicaid temporarily stops payments for new residents until issues are fixed. 1
86% more payment denials than Ohio average

Ohio average: 0.5

Fines amount comparison
This facility $0
Ohio average $69K
Penalty History

Penalties are imposed by CMS for violations of federal nursing home regulations.

Payment Denial Info Serious action where Medicare and/or Medicaid temporarily stops payments for new residents until issues are fixed. Apr 15, 2024
6 days

Last updated: Jan 2026

Guides for Better Senior Living

Care Cost Calculator: See Prices in Your Area

Nursing Home Data Explorer

Don’t Wait Too Long: 7 Red Flag Signs Your Parent Needs Assisted Living Now

The True Cost of Assisted Living in 2025 – And How Families Are Paying For It

Understanding Senior Living Costs: Pricing Models, Discounts & Financial Assistance

Financial Aid for Ohio Seniors

Get financial aid guidance

PASSPORT Waiver

Ohio Medicaid PASSPORT

Age 60+, Ohio resident, Medicaid-eligible, nursing home-level care need.

~$2,829/month (300% FBR, individual).

$2,000 (individual), $3,000 (couple).

Administered through regional agencies; waitlists possible.

Ohio Home Care Program (non-Medicaid)

OH HCP

Age 60+, Ohio resident, at risk of decline.

~$2,000/month (individual, varies).

$5,000 (individual).

Limited funding; regional variation.

Assisted Living Waiver (ALW)

Ohio Assisted Living Waiver

Age 21+ (65+ prioritized), OH resident, Medicaid-eligible, NFLOC.

~$2,829/month (individual); QIT required.

$2,000 (individual), $3,000 (couple).

Covers ~300 facilities; room/board not included (separate cost).

Program of All-Inclusive Care for the Elderly (PACE)

Ohio PACE (e.g., McGregor PACE)

Age 55+, OH resident (specific counties), NFLOC, safe with PACE support.

~$2,829/month (Medicaid-eligible); private pay option available.

$2,000 (individual), $3,000 (couple) for Medicaid enrollees.

Available in 9 counties (e.g., Cuyahoga, Franklin); expanding via Healthy Aging Grants.

Medicare Savings Program (MSP)

Ohio Medicare Savings Program

Age 65+ or disabled, OH resident, Medicare Part A/B.

~$2,510/month (QMB), ~$3,380/month (SLMB), ~$3,598/month (QI)—individual.

$9,430 (individual), $14,130 (couple).

Three tiers; includes Extra Help for Part D; no waitlist.

Home Energy Assistance Program (HEAP)

Ohio HEAP

Age 60+ prioritized, OH resident, low-income household.

~$3,970/month (individual, 185% FPL).

Not assessed; income-focused.

Covers gas, electric, oil; emergency aid via Winter/Summer Crisis Programs.

Family Caregiver Support Program (FCSP)

Ohio Family Caregiver Support Program

Caregivers of 60+ needing care or 55+ caregivers of others; OH resident; functional needs (2+ ADLs).

Prioritizes ~$24,980/year (individual); no strict cap.

Not assessed; need-based.

12 AAAs; rural/low-income priority; volunteer respite option.

Senior Community Service Employment Program (SCSEP)

Ohio SCSEP

Age 55+, unemployed, low-income, OH resident.

~$1,983/month (125% FPL).

Not specified; income-focused.

Priority for veterans, rural residents; AARP partnership.

VA Aid and Attendance (A&A) and Housebound Benefits

Ohio VA Aid and Attendance/Housebound

Age 65+ or disabled veteran/spouse, OH resident, wartime service, need for ADL help (A&A) or homebound.

Net income < ~$1,984/month (veteran with dependent, A&A); pension offsets income.

~$155,356 (net worth limit).

High veteran demand; supports care in multiple settings.

Homestead Exemption

Ohio Homestead Exemption

Age 65+ (or disabled), OH resident, homeowner, low-income.

~$38,500/year (individual, adjusted annually).

Not assessed; home ownership required.

Reduces taxable value by $25,000; applies to primary residence.

Save the Dream Ohio (Homeowner Assistance Fund)

Ohio Save the Dream

Age 60+ prioritized, OH resident, homeowner, hardship post-Jan 21, 2020.

~$147,600/year (family of 4, 150% AMI; varies by county).

Not assessed; hardship-focused.

Covers delinquent mortgages, utilities, taxes; max $25,000 mortgage aid.