


Total staff
126
Employees
112
Contractors
14
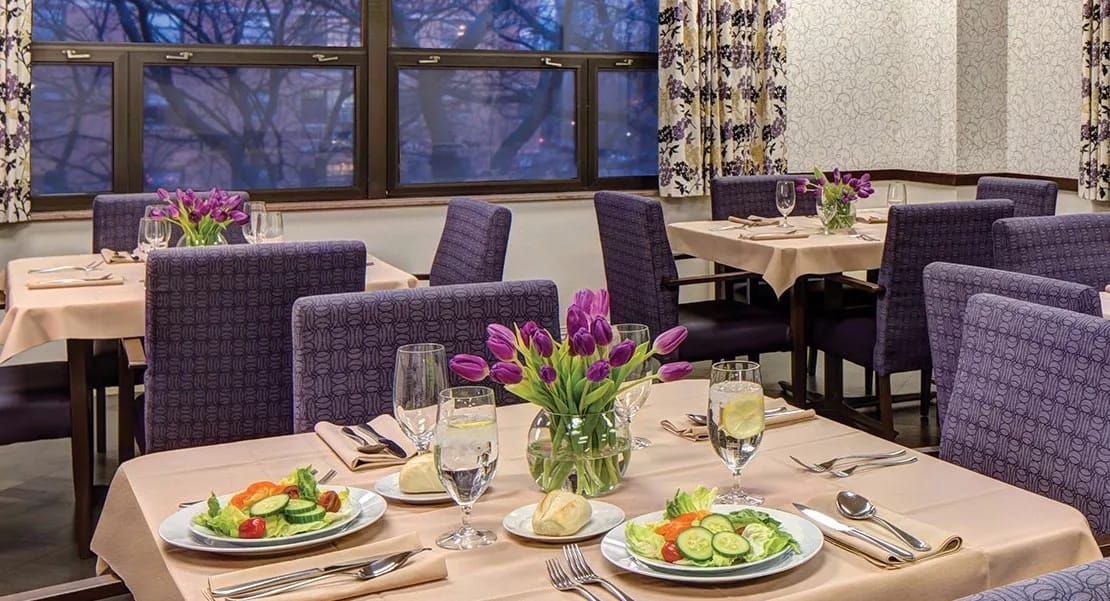


Chalet Living and Rehab combines comfortable living spaces with top-notch medical services, creating an environment that truly stands out. Equipped with the latest ancillary and diagnostic equipment, the facility ensures that residents have access to advanced medical services right on-site. Gone are the days of worrying about traveling to hospitals for tests and treatment—with physicians’ offices readily available, everything is within reach. Dedicated physical and occupational therapists, alongside experts in physical medicine, provide individualized care, tailoring treatments to address the unique needs of each resident.
Every aspect of Chalet is designed to offer comfort, security, and an elevated living experience. Imagine relaxing in well-mounted rooms with state-of-the-art TVs, or stepping out onto spacious patios to soak up the serenity of the surroundings. For those seeking privacy, private suites provide a personal sanctuary, while communal spaces foster meaningful connections and social interactions. At Chalet Living and Rehab, a transformative experience awaits. This is a place where residents can find solace, healing, and a supportive community that embraces them wholeheartedly.
| Staff type | Hours / Day / Resident | vs state avg |
|---|---|---|
|
Registered Nurse (RN)
| 25m per day | ▼ 44% State avg: 44m per day · National avg: 41m per day |
|
LPN / LVN
| 35m per day | ▼ 8% State avg: 38m per day · National avg: 52m per day |
|
Nurse Aide
| 1h 23m per day | ▼ 35% State avg: 2h 8m per day · National avg: 2h 21m per day |
|
Weekend Total Nursing
| 2h 16m per day | ▼ 26% State avg: 3h 5m per day · National avg: 3h 26m per day |
|
Physical Therapist
| 1m per day | ▼ 54% State avg: 3m per day · National avg: 4m per day |
|
Weekend RN
| 23m per day | ▼ 34% State avg: 34m per day · National avg: 29m per day |
Reporting period: October 1 – December 31, 2025 (Q4 2025). Source: CMS Payroll-Based Journal report.
Manages medical care and health needs.
Assists with medical care and medications.
Helps with daily care and mobility.
Total hours from contractors
1,921 contractor hours this quarter
| Certified Nursing Assistant | 62 | 0 | 62 | 25,917 | 92 | 100% | 7.4 |
| Licensed Practical Nurse | 18 | 0 | 18 | 8,489 | 92 | 100% | 8.1 |
| Registered Nurse | 12 | 0 | 12 | 5,394 | 92 | 100% | 7.9 |
| RN Director of Nursing | 5 | 0 | 5 | 2,456 | 90 | 98% | 5.6 |
| Other Dietary Services Staff | 4 | 0 | 4 | 1,866 | 91 | 99% | 7.5 |
| Clinical Nurse Specialist | 3 | 0 | 3 | 1,838 | 92 | 100% | 7.2 |
| Dental Services Staff | 3 | 0 | 3 | 853 | 89 | 97% | 5.6 |
| Speech Language Pathologist | 0 | 3 | 3 | 516 | 63 | 68% | 7.8 |
| Dietitian | 1 | 0 | 1 | 510 | 90 | 98% | 5.7 |
| Administrator | 1 | 0 | 1 | 508 | 90 | 98% | 5.6 |
| Nurse Practitioner | 1 | 0 | 1 | 508 | 90 | 98% | 5.6 |
| Respiratory Therapy Technician | 0 | 4 | 4 | 434 | 61 | 66% | 7 |
| Mental Health Service Worker | 2 | 0 | 2 | 384 | 68 | 74% | 5.7 |
| Qualified Social Worker | 0 | 2 | 2 | 377 | 63 | 68% | 6 |
| Physical Therapy Aide | 0 | 2 | 2 | 306 | 43 | 47% | 7.1 |
| Physical Therapy Assistant | 0 | 3 | 3 | 288 | 39 | 42% | 7.4 |
Includes penalties issued in 2024-2025
Federal penalties imposed by CMS for regulatory violations, including civil money penalties (fines) and denials of payment for new Medicare/Medicaid admissions.
Source: CMS Penalties Database (Data as of Jan 2026)
Illinois average: $143K
Illinois average: 3.0
Illinois average: 1.1
Penalties are imposed by CMS for violations of federal nursing home regulations.
4 penalties in the past 3 years
Multiple penalties were reported in the last 3 years.
Last updated: Jan 2026
These measures show how residents usually do over time at this home, based on health outcomes and preventive care.
Illinois average: 9.7
Illinois average: 18.6
Illinois average: 15.5%
Illinois average: 18.4%
Illinois average: 21.6%
Illinois average: 3.4%
Illinois average: 5.3%
Illinois average: 1.8%
Illinois average: 6.5%
Illinois average: 48.1%
Illinois average: 20.2%
Illinois average: 89.2%
Illinois average: 91.6%
Illinois average: 2.05
Illinois average: 2.25
Illinois average: 68.3%
Illinois average: 2.3%
Illinois average: 63.0%
Illinois average: 26.2%
Illinois average: 14.0%
Illinois average: 50.6%
Quality measures are calculated from Minimum Data Set (MDS) assessments. For most measures, lower percentages indicate better care quality.
11% of new residents, usually for short-term rehab.
78% of new residents, often for short stays.
11% of new residents, often for long-term daily care.
Source: CMS Long-Term Care Facility Characteristics (Data as of Jan 2026)
Residents meet regularly to discuss policies, care quality, and activities
Organized group of residents that meets regularly to discuss facility policies, quality of life, and activities.
Data sourced from CMS Long-Term Care Facility Characteristics quarterly report. Payer mix reflects the current resident census by primary payment source.
Historical financial and operational data for Chalet Living and Rehab from 2012–2023, based on CMS SNF Cost Reports.
Key figures below are for fiscal year ending in 12/2023.
Based on CMS SNF Cost Report for fiscal year ending in 12/2023.
Residents typically stay for brief periods, with frequent admissions and discharges throughout the year.
Most new residents arrive under private pay (78% of admissions), and a typical private pay stay runs around 5 - 6 months.
Coverage residents most often arrive under.
Coverage residents most often leave under.
What do you like most about living here?
Nurses
Are there enough caregivers to handle the residents' needs, especially during emergencies?
Yes
Are the common areas pleasant and comfortable for socializing or relaxing?
No
How do you feel about the level of social interaction available with other residents?
How was the units offered in this community?
X
Do you feel safe living in this community?
Yes
How well do you think the community handles emergencies or unexpected events?
X
How would you rate the quality and variety of the meals? (1-5)
2
Are special diets handled well?
No
Is the dining schedule flexible enough to meet your preferences?
Yes
Are there any hidden fees or unexpected charges?
X
Would you recommend this community to others looking for senior living options?
X
Is there anything you wish you knew before moving in?
X
![]() 9.3 miles from city center
9.3 miles from city center
![]() Estimated distance in miles from Chicago's city center to Chalet Living and Rehab's address, calculated via Google Maps.
— 5.81 miles to nearest hospital (Ascension Saint Joseph - Chicago)
Estimated distance in miles from Chicago's city center to Chalet Living and Rehab's address, calculated via Google Maps.
— 5.81 miles to nearest hospital (Ascension Saint Joseph - Chicago)
Add your location
Info below is compiled from CMS reports & the IL Dept. of Public Health (IDPH), senior community websites & trusted data sources such as Walk Score & BBB.
Communities are listed from highest to lowest based on our ranking methodology.
| Mercy Circle Senior Living | NH AL IL MC SNF | Chicago (Mount Greenwood) | 43
Facility
43
IL AVG
85
Rank
#330 / 419 | - | - | 4.57
Facility
4.57
IL AVG
3.10
Rank
#24 / 155 | -8% | +47% | $0
Facility
$0
IL AVG
$151.3k
Rank
#1 / 155 | 16
Facility
16
IL AVG
36.8
Rank
#24 / 155 | 4.0
Facility
4.0
IL AVG
3.7
Rank
#105 / 155 | - | 22 | - |
44
Facility
44
IL AVG
51
Rank
#392 / 648 | Sisters Of Mercy Of The Americas West Midwest Community Inc | $10.3MFiscal year ending 06/2024
Facility
$10.3MFiscal year ending 06/2024
IL AVG
$12.2M
Rank
#95 / 154 | $5.1MFiscal year ending 06/2024
Facility
$5.1MFiscal year ending 06/2024
IL AVG
$4.8M
Rank
#112 / 154 | 49.8%Fiscal year ending 06/2024
Facility
49.8%Fiscal year ending 06/2024
IL AVG
44.3%
Rank
#105 / 154 | 146174 | ||||
| The Selfhelp Home Senior Living Community | NH AL IL RC SNF | Chicago (Uptown) | 72
Facility
72
IL AVG
85
Rank
#204 / 419 |
81.9%
Facility
81.9%
IL AVG
73
Rank
#63 / 157 | +12% | 5.56
Facility
5.56
IL AVG
3.10
Rank
#8 / 155 | +44% | +79% | $0
Facility
$0
IL AVG
$151.3k
Rank
#1 / 155 | 21
Facility
21
IL AVG
36.8
Rank
#41 / 155 | 5.3
Facility
5.3
IL AVG
3.7
Rank
#138 / 155 | 1 | 59 | A+ |
92
Facility
92
IL AVG
51
Rank
#28 / 648 | Marvin Rubin | $9.3MFiscal year ending 09/2023
Facility
$9.3MFiscal year ending 09/2023
IL AVG
$12.2M
Rank
#76 / 154 | $7.0MFiscal year ending 09/2023
Facility
$7.0MFiscal year ending 09/2023
IL AVG
$4.8M
Rank
#72 / 154 | 75.3%Fiscal year ending 09/2023
Facility
75.3%Fiscal year ending 09/2023
IL AVG
44.3%
Rank
#59 / 154 | 146009 | ||||
| The Clare | NH AL IL MC SNF | Chicago (Rush & Division) | 49
Facility
49
IL AVG
85
Rank
#294 / 419 |
92.2%
Facility
92.2%
IL AVG
73
Rank
#23 / 157 | +26% | 3.69
Facility
3.69
IL AVG
3.10
Rank
#48 / 155 | +61% | +19% | $0
Facility
$0
IL AVG
$151.3k
Rank
#1 / 155 | 13
Facility
13
IL AVG
36.8
Rank
#19 / 155 | 2.6
Facility
2.6
IL AVG
3.7
Rank
#25 / 155 | 1 | 45 | A+ |
100
Facility
100
IL AVG
51
Rank
#1 / 648 | County Of Fulton | $4.4MFiscal year ending 11/2023
Facility
$4.4MFiscal year ending 11/2023
IL AVG
$12.2M
Rank
#147 / 154 | $3.6MFiscal year ending 11/2023
Facility
$3.6MFiscal year ending 11/2023
IL AVG
$4.8M
Rank
#146 / 154 | 81.8%Fiscal year ending 11/2023
Facility
81.8%Fiscal year ending 11/2023
IL AVG
44.3%
Rank
#14 / 154 | 146151 | ||||
| Asbury Gardens | NH HOS MC PC SNF | North Aurora (Airport Road) | 75
Facility
75
IL AVG
85
Rank
#193 / 419 |
76.5%
Facility
76.5%
IL AVG
73
Rank
#78 / 157 | +5% | 4.00
Facility
4.00
IL AVG
3.10
Rank
#41 / 155 | +6% | +29% | $6.4k
Facility
$6.4k
IL AVG
$151.3k
Rank
#66 / 155 | 21
Facility
21
IL AVG
36.8
Rank
#41 / 155 | 3.5
Facility
3.5
IL AVG
3.7
Rank
#72 / 155 | - | 57 | A+ |
38
Facility
38
IL AVG
51
Rank
#434 / 648 | Abraham Diamond | $6.7MFiscal year ending 12/2023
Facility
$6.7MFiscal year ending 12/2023
IL AVG
$12.2M
Rank
#137 / 154 | $3.8MFiscal year ending 12/2023
Facility
$3.8MFiscal year ending 12/2023
IL AVG
$4.8M
Rank
#128 / 154 | 56.5%Fiscal year ending 12/2023
Facility
56.5%Fiscal year ending 12/2023
IL AVG
44.3%
Rank
#28 / 154 | 146170 | ||||
| Chalet Living and Rehab | NH MC SNF | Chicago (Rogers Park) | 219
Facility
219
IL AVG
85
Rank
#17 / 419 |
92.9%
Facility
92.9%
IL AVG
73
Rank
#20 / 157 | +27% | 1.87
Facility
1.87
IL AVG
3.10
Rank
#148 / 155 | -33% | -40% | $275.9k
Facility
$275.9k
IL AVG
$151.3k
Rank
#149 / 155 | 49
Facility
49
IL AVG
36.8
Rank
#117 / 155 | 4.1
Facility
4.1
IL AVG
3.7
Rank
#108 / 155 | 3 | 204 | - |
84
Facility
84
IL AVG
51
Rank
#80 / 648 | - | $17.2MFiscal year ending 12/2023
Facility
$17.2MFiscal year ending 12/2023
IL AVG
$12.2M
Rank
#27 / 154 | $8.5MFiscal year ending 12/2023
Facility
$8.5MFiscal year ending 12/2023
IL AVG
$4.8M
Rank
#54 / 154 | 49.6%Fiscal year ending 12/2023
Facility
49.6%Fiscal year ending 12/2023
IL AVG
44.3%
Rank
#143 / 154 | 145670 |
Chalet Living and Rehab is located in Chicago, Illinois.
Here are the financial assistance programs available to residents in Illinois.
Chalet Living and Rehab is in the Rogers Park neighborhood.
Chalet Living and Rehab has a walk score of 84. Very walkable. Most errands can be accomplished on foot, and many essentials are within a short walk.
Chalet Living and Rehab's occupancy is 87.5%.
No, Chalet Living and Rehab has a no-pet policy.
Chalet Living and Rehab is registered as a for-profit.
Yes — there are 10 photos of Chalet Living and Rehab in the photo gallery on this page.
Chalet Living and Rehab is located at 7350 N Sheridan Rd, Chicago, IL 60626.
Care Cost Calculator: See Prices in Your Area
Nursing Home Data Explorer
Don’t Wait Too Long: 7 Red Flag Signs Your Parent Needs Assisted Living Now
The True Cost of Assisted Living in 2025 – And How Families Are Paying For It
Understanding Senior Living Costs: Pricing Models, Discounts & Financial Assistance


