Chestnut Hill Lodge
Nursing Home · Pennsylvania, PA
CMS overall rating Info The Overall CMS Rating is scored from 1 to 5 stars and combines results from health inspections, staffing levels, and quality measures. Health inspections carry the most weight. Staffing and quality scores can increase or decrease the final rating based on performance compared to state and national standards.

Chestnut Hill Lodge

Nursing Home · Pennsylvania, PA
CMS overall rating Info The Overall CMS Rating is scored from 1 to 5 stars and combines results from health inspections, staffing levels, and quality measures. Health inspections carry the most weight. Staffing and quality scores can increase or decrease the final rating based on performance compared to state and national standards.
Calculator: See prices in your area
Chestnut Hill Lodge accepts Medicare, Medicaid, and private pay.

Overview of Chestnut Hill Lodge

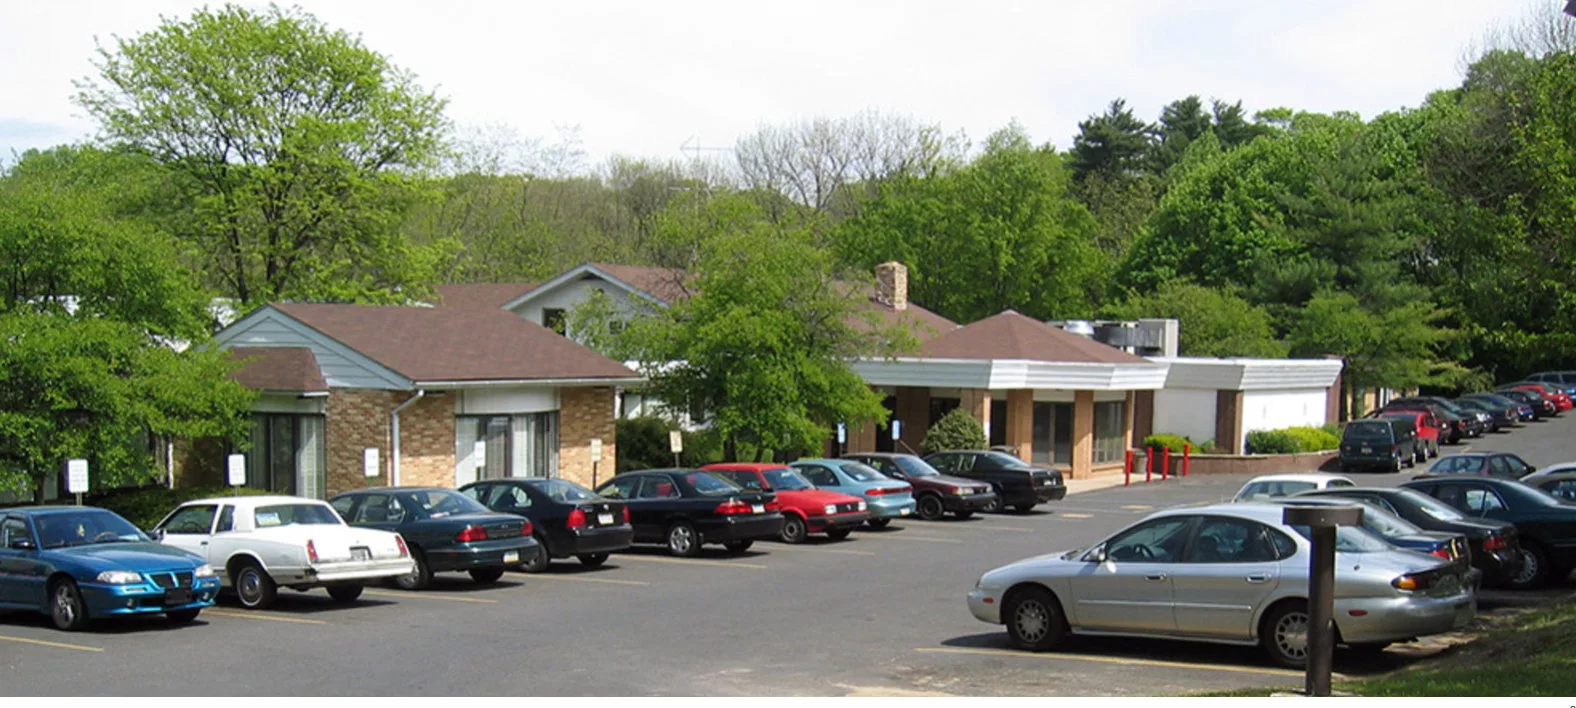
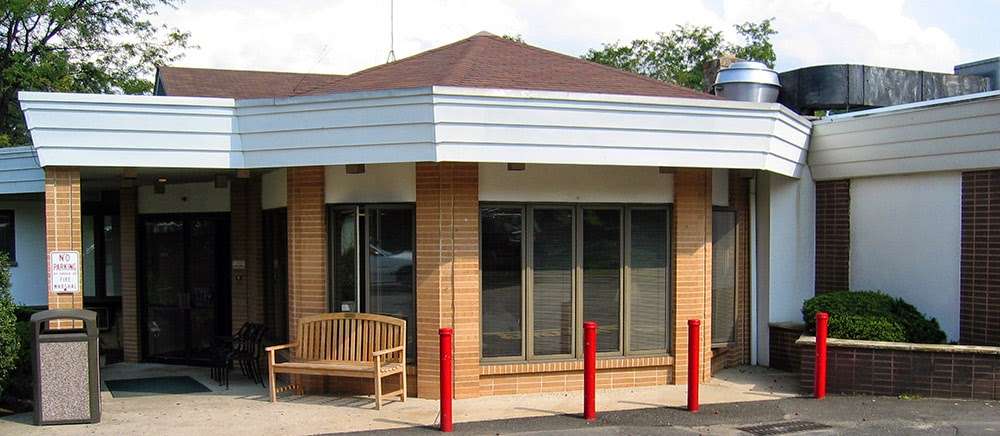
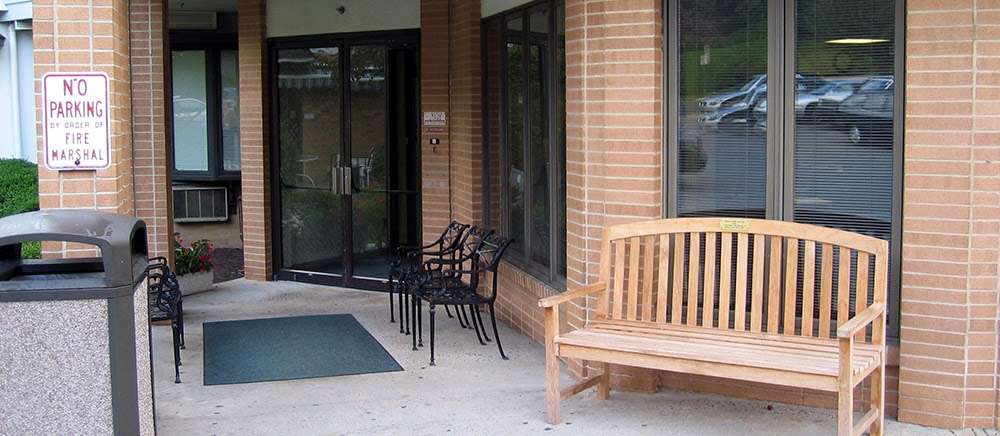
Chestnut Hill Lodge Healthcare and Rehabilitation, with its 181-bed facility, excels as a testament to continuous improvement in the field of senior care. Over the years, they have honed their expertise in providing a range of services, from short-term rehabilitation to long-term skilled nursing care and respite stays. What truly makes this facility special is its dedication to specialized programs, including cardiac care, diabetes management, hospice care, pain management, orthopedic rehabilitation, stroke recovery, and memory care.

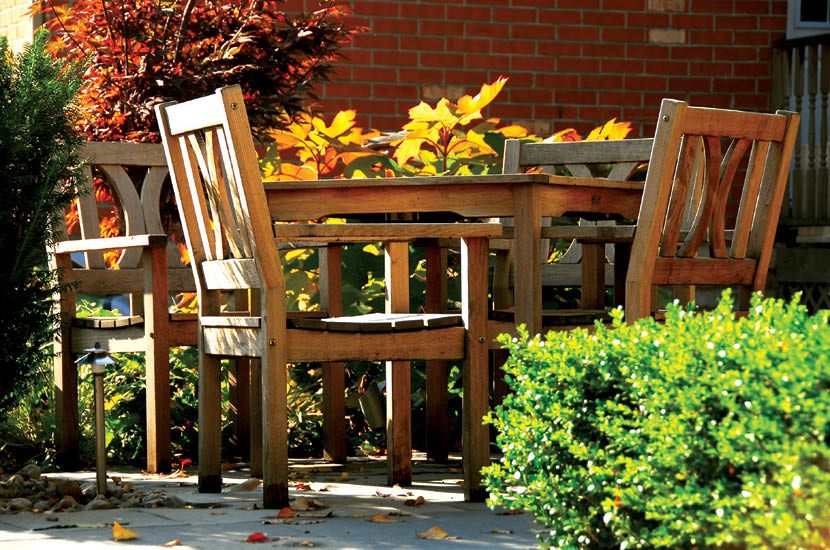
Situated in a convenient location with easy access to local conveniences, including emergency care, Chestnut Hill Lodge offers not just a place to stay but a vibrant community where residents can experience a rich dining atmosphere, unparalleled support services, and engaging social and recreational activities. In this safe and lively environment, residents can enjoy a fulfilling lifestyle while receiving top-notch care that surpasses the standards of nursing home facilities.

Quality ratings

Measured by Centers for Medicare & Medicaid Services (CMS)

Overall rating Info The Overall CMS Rating combines results from health inspections, staffing levels and quality measures. Health inspections carry the most weight. Staffing and quality scores can increase or decrease the final rating based on performance compared to state and national standards.
At PA avg. At PA avg.Click the badge to see the full State ranking.Click here to see the full State ranking.
Health Inspection Info Based on the results of the facility's three most recent standard inspections and any complaint investigations. CMS reviews the number, scope, and severity of deficiencies, with more recent findings weighted more heavily.
▲ 7.2% Above PA avg. ▲ 7.2% Above PA avg.Click the badge to see the full State ranking.Click here to see the full State ranking.
Staffing Info Measures average nursing staff hours per resident per day, including Registered Nurses (RNs) and total nursing staff. Ratings are adjusted based on the level of care residents require and are compared to state and national benchmarks.
▼ 11.5% Below PA avg. ▼ 11.5% Below PA avg.Click the badge to see the full State ranking.Click here to see the full State ranking.
Quality Measures Info Based on clinical and physical health indicators reported to CMS, such as hospital readmissions, falls, pressure ulcers, and improvements in mobility. These measures reflect how well residents' health needs are being managed.
▼ 41.1% Below PA avg. ▼ 41.1% Below PA avg.Click the badge to see the full State ranking.Click here to see the full State ranking.

Staffing hours breakdown

Info Daily nursing hours per resident by staff type, reported to CMS. Higher is generally better — compare this facility to state and national averages to see where staffing stands.

Hours per resident per day — compared to Pennsylvania state averages

Total nursing care / resident Info This home is ranked 98th out of 203 homes in Pennsylvania. Total adjusted nursing hours per resident per day, combining RN, LPN, and aide time. CMS adjusts this for case-mix so facilities can be fairly compared.
4h 11m per day
Rank #98 / 203Nurse hours — State benchmarkedThis home is ranked 98th out of 203 homes in Pennsylvania. Shows adjusted nurse hours per resident per day benchmarked to the Pennsylvania average, with a ranking across 203 Pennsylvania SNFs. More hours mean more direct care. The national average is about 3.5 hrs; below 3.0 is a red flag.Click the rank badge to see the full State ranking.Click here to see the full State ranking.
This facility Pennsylvania avg (4h 9m per day)
vs Pennsylvania avg
+1%

5 of 6 metrics below state avg

Standout metric LPN / LVN is +16% above state avg
Staff type Hours / Day / Resident vs state avg
Registered Nurse (RN) Info RNs hold the highest nursing license and can assess residents, interpret test results, and direct care plans. More RN hours per day often signals stronger clinical oversight and faster response to health changes. 24m per day ▼ 49% State avg: 47m per day · National avg: 41m per day
LPN / LVN Info Licensed Practical Nurses (LPNs) or Licensed Vocational Nurses (LVNs) deliver routine hands-on care — medication administration, wound dressing, and monitoring vital signs. They work under RN supervision and make up a large share of daily bedside care. 1h 4m per day ▲ 16% State avg: 55m per day · National avg: 52m per day
Nurse Aide Info Certified Nurse Aides (CNAs) provide the most direct day-to-day assistance: bathing, dressing, feeding, and mobility. Nurse aide hours are typically the largest staffing category and directly affect residents' quality of life. 1h 59m per day ▼ 10% State avg: 2h 12m per day · National avg: 2h 21m per day
Weekend Total Nursing Info Combined nursing hours (RN + LPN + Nurse Aide) per resident per day on weekends. Staffing often drops on weekends — this figure reveals whether the facility maintains adequate coverage outside of weekday hours. 3h 16m per day ▼ 7% State avg: 3h 31m per day · National avg: 3h 26m per day
Physical Therapist Info Hours per resident per day provided by licensed Physical Therapists (PTs) or PT Assistants. PT services help residents recover mobility after injury or illness and are especially important for post-acute (short-stay) rehabilitation. 1m per day ▼ 83% State avg: 6m per day · National avg: 4m per day
Weekend RN Info Registered nurse hours specifically on weekends. Facilities sometimes reduce RN presence on Saturdays and Sundays — a low weekend RN figure compared to weekday hours can indicate reduced clinical oversight when most administrative staff are absent. 12m per day ▼ 64% State avg: 33m per day · National avg: 29m per day

Capacity and availability

This home usually has limited availability

Occupancy between 85% and 95% suggests balanced demand.

Higher occupancy than the Pennsylvania average: 78.7%
Occupancy rate 92.1% Rank #42 / 511Occupancy rate — State benchmarkedThis home is ranked 42nd out of 511 homes in Pennsylvania. Shows this facility's occupancy rate versus the Pennsylvania average, with its Statewide rank out of 511. Higher occupancy signals strong local demand and financial stability.Click the rank badge to see the full State ranking.Click here to see the full State ranking.
Avg. Length of Stay 121 days
Occupancy rate
92.1% Rank #42 / 511Occupancy rate — State benchmarkedThis home is ranked 42nd out of 511 homes in Pennsylvania. Shows this facility's occupancy rate versus the Pennsylvania average, with its Statewide rank out of 511. Higher occupancy signals strong local demand and financial stability.Click the rank badge to see the full State ranking.Click here to see the full State ranking.
Avg. Length of Stay
121 days
Walk Score
Walk Score: 56 / 100 Rank #237 / 667Walk Score — State benchmarkedThis home is ranked 237th out of 667 homes in Pennsylvania. Shows how walkable this facility's neighborhood is compared to the average Walk Score across Pennsylvania SNFs. Higher scores benefit residents, families, and staff.Click the rank badge to see the full State ranking.Click here to see the full State ranking.
Moderately walkable. Some errands can be accomplished on foot, with a mix of nearby amenities.

About this community

Therapy & Rehabilitation

2 services
Rehabilitation Services
Respite Care

Staffing & Medical

1 service
24-Hour Staffing

Amenities & Lifestyle

Light
Airy Interiors
Quality Furniture
Attractive Décor
Flat-Screen Cable Tv
Bedside Phones
Fitness Activities
Cultural And Educational Programs
Professional Entertainment
Community Trips
Social Gatherings
Arts And Crafts
Study Groups
Games

Dining & Nutrition

Food DescriptionMeals are served three times a day in an elegant dining room, featuring a chef and dietician team for balanced meals.

Contact Chestnut Hill Lodge

Staffing Data

Reporting period: October 1 – December 31, 2025 (Q4 2025). Source: CMS Payroll-Based Journal report.

Total staff 299
Employees 89
Contractors 210
Staff to resident ratio 1.98:1
8% better than Pennsylvania average
Pennsylvania average ratio: 1.83:1 Pennsylvania average ratio: 1.83:1See full Pennsylvania ranking
Avg staff/day 73
Average shift 8.7 hours
12% better than Pennsylvania average
Pennsylvania average: 7.8 hours Pennsylvania average shift: 7.8 hoursSee full Pennsylvania ranking
Total staff hours (quarter) 58,360

Nursing staff breakdown

Q4 2025 · Oct 1 – Dec 31 More info This data comes from the CMS Payroll-Based Journal report covering October 1 – December 31, 2025.
Registered Nurse

Manages medical care and health needs.

RN Staff 17
Average shift length Info Average shift length. Calculated as total hours divided by days worked and average staff per day. 8.3 hours

This role is partially covered by contractors.

Licensed Practical Nurse

Assists with medical care and medications.

LPN Staff 94
Average shift length Info Average shift length. Calculated as total hours divided by days worked and average staff per day. 8.6 hours

This role is partially covered by contractors.

Certified Nursing Assistant

Helps with daily care and mobility.

CNA Staff 160
Average shift length Info Average shift length. Calculated as total hours divided by days worked and average staff per day. 9.1 hours

This role is partially covered by contractors.

Contractor staffing

Q4 2025 · Oct 1 – Dec 31 More info This data comes from the CMS Payroll-Based Journal report covering October 1 – December 31, 2025.

Total hours from contractors

45.7%

26,671 contractor hours this quarter

Certified Nursing Assistant: 126 Licensed Practical Nurse: 74 Registered Nurse: 10

Staff by category

Q4 2025 · Oct 1 – Dec 31 More info This data comes from the CMS Payroll-Based Journal report covering October 1 – December 31, 2025.
Certified Nursing Assistant 34 126 160 30,351 92 100% 9.1
Licensed Practical Nurse 20 74 94 14,844 92 100% 8.6
Registered Nurse 7 10 17 3,995 92 100% 8.3
Other Dietary Services Staff 4 0 4 1,946 92 100% 7.8
Clinical Nurse Specialist 3 0 3 1,411 64 70% 8.5
Physical Therapy Assistant 4 0 4 1,014 67 73% 7.1
RN Director of Nursing 2 0 2 976 64 70% 8
Administrator 1 0 1 512 64 70% 8
Nurse Practitioner 1 0 1 512 64 70% 8
Dietitian 1 0 1 488 61 66% 8
Dental Services Staff 1 0 1 488 61 66% 8
Occupational Therapy Aide 1 0 1 480 60 65% 8
Mental Health Service Worker 1 0 1 472 59 64% 8
Physical Therapy Aide 2 0 2 464 66 72% 7
Qualified Activities Professional 3 0 3 221 52 57% 4.1
Respiratory Therapy Technician 2 0 2 163 29 32% 5.5
Nurse Aide in Training 2 0 2 22 2 2% 7.4
160 Certified Nursing Assistant
% of Days 100%
94 Licensed Practical Nurse
% of Days 100%
17 Registered Nurse
% of Days 100%
4 Other Dietary Services Staff
% of Days 100%
3 Clinical Nurse Specialist
% of Days 70%
4 Physical Therapy Assistant
% of Days 73%
2 RN Director of Nursing
% of Days 70%
1 Administrator
% of Days 70%
1 Nurse Practitioner
% of Days 70%
1 Dietitian
% of Days 66%
1 Dental Services Staff
% of Days 66%
1 Occupational Therapy Aide
% of Days 65%
1 Mental Health Service Worker
% of Days 64%
2 Physical Therapy Aide
% of Days 72%
3 Qualified Activities Professional
% of Days 57%
2 Respiratory Therapy Technician
% of Days 32%
2 Nurse Aide in Training
% of Days 2%

Penalties and fines

Federal penalties imposed by CMS for regulatory violations, including civil money penalties (fines) and denials of payment for new Medicare/Medicaid admissions.

Source: CMS Penalties Database (Data as of Jan 2026)

Total fines amount $16K Rank #169 / 206Federal fines — State benchmarkedThis home is ranked 169th out of 206 homes in Pennsylvania. Shows this facility's cumulative CMS federal fine dollars versus the Pennsylvania average among facilities with fines, and where it ranks among 206 skilled nursing facilities in the pool. Lower total dollars mean a better rank.Click the rank badge to see the full State ranking.Click here to see the full State ranking.
73% lower than Pennsylvania average

Pennsylvania average: $59K

Number of fines 2
In line with Pennsylvania average

Pennsylvania average: 2.1

Payment Denials Info Serious action where Medicare and/or Medicaid temporarily stops payments for new residents until issues are fixed. 0
100% fewer payment denials than Pennsylvania average

Pennsylvania average: 0.2

Fines amount comparison
This facility $16K
Pennsylvania average $59K

No penalties in the past 3 years

No civil money penalties or payment denials were reported in the last 3 years.

Quality of care over time

These measures show how residents usually do over time at this home, based on health outcomes and preventive care.

High-risk clinical events score Info A composite score based on pressure ulcers, falls with injury, weight loss, walking ability decline, and activities of daily living decline. 11.0
In line with Pennsylvania average

Pennsylvania average: 11.0

Functional decline score Info A composite score based on activities of daily living decline, walking ability decline, and incontinence. 21.9
In line with Pennsylvania average

Pennsylvania average: 22.2

Long-stay resident measures
Average Pennsylvania avg: 3.7 Info CMS star rating based on long-stay quality measure performance. 5 stars = significantly above average, 1 star = significantly below average.
Need for Help with Daily Activities Increased Info Percent of long-stay residents whose need for help with daily activities has increased 21.9%
15% worse than Pennsylvania average

Pennsylvania average: 19.0%

Walking Ability Worsened Info Percent of long-stay residents whose ability to move independently worsened 20.4%
In line with Pennsylvania average

Pennsylvania average: 21.1%

Low Risk Residents with Bowel/Bladder Incontinence Info Percent of low risk long-stay residents who lose control of their bowels or bladder 23.6%
12% better than Pennsylvania average

Pennsylvania average: 26.7%

Falls with Major Injury Info Percent of long-stay residents experiencing one or more falls with major injury 0.8%
74% better than Pennsylvania average

Pennsylvania average: 3.2%

High Risk Residents with Pressure Ulcers Info Percent of long-stay high risk residents with pressure ulcers 4.1%
25% better than Pennsylvania average

Pennsylvania average: 5.5%

Urinary Tract Infection Info Percent of long-stay residents with a urinary tract infection 1.2%
32% better than Pennsylvania average

Pennsylvania average: 1.8%

Lost Too Much Weight Info Percent of long-stay residents who lose too much weight 7.6%
15% worse than Pennsylvania average

Pennsylvania average: 6.6%

Depressive Symptoms Info Percent of long-stay residents who have depressive symptoms 2.6%
52% better than Pennsylvania average

Pennsylvania average: 5.5%

Pneumococcal Vaccine Info Percent of long-stay residents assessed and appropriately given the pneumococcal vaccine 59.7%
31% worse than Pennsylvania average

Pennsylvania average: 86.9%

Influenza Vaccine Info Percent of long-stay residents assessed and appropriately given the seasonal influenza vaccine 88.7%
5% worse than Pennsylvania average

Pennsylvania average: 93.5%

Hospitalizations per 1,000 days Info Number of hospitalizations per 1,000 long-stay resident days. 2.15
28% worse than Pennsylvania average

Pennsylvania average: 1.68

ED visits per 1,000 days Info Number of outpatient emergency department visits per 1,000 long-stay resident days. 1.37
14% worse than Pennsylvania average

Pennsylvania average: 1.20

Short-stay resident measures
Significantly below average Pennsylvania avg: 3.2 Info CMS star rating based on short-stay quality measure performance. 5 stars = much above average, 1 star = much below average.
Pneumococcal Vaccine Info Percent of short-stay residents assessed and appropriately given the pneumococcal vaccine 22.6%
67% worse than Pennsylvania average

Pennsylvania average: 68.8%

Antipsychotic medication increase Info Percent of short-stay residents who newly received an antipsychotic medication 3.8%
145% worse than Pennsylvania average

Pennsylvania average: 1.5%

Influenza Vaccine Info Percent of short-stay residents assessed and appropriately given the seasonal influenza vaccine 43.1%
37% worse than Pennsylvania average

Pennsylvania average: 68.7%

Re-hospitalized after SNF stay Info Percentage of short-stay residents who were re-hospitalized after their nursing home admission. 28.2%
22% worse than Pennsylvania average

Pennsylvania average: 23.1%

Emergency department visits Info Percentage of short-stay residents who had an outpatient emergency department visit. 14.8%
51% worse than Pennsylvania average

Pennsylvania average: 9.8%

Falls with major injury Info Percentage of SNF residents who experience falls with major injury during their stay. 1.0%
26% worse than Pennsylvania average

Pennsylvania average: 0.8%

Ability to care for self at discharge Info Percentage of residents at or above expected ability to care for themselves at discharge. 49.3%
8% worse than Pennsylvania average

Pennsylvania average: 53.7%

Successful return to home or community Info Rate of successful return to home or community from a skilled nursing facility. 37.4%
26% worse than Pennsylvania average

Pennsylvania average: 50.6%

Breakdown by payment type

Medicare

25% of new residents, usually for short-term rehab.

Typical stay 27 days

Private pay

32% of new residents, often for short stays.

Typical stay 25 days

Medicaid

44% of new residents, often for long-term daily care.

Typical stay 8 - 9 months

Facility Characteristics

Source: CMS Long-Term Care Facility Characteristics (Data as of Jan 2026)

Total residents 151
Medicare
14
9.3% of residents
Medicaid
137
90.7% of residents
Programs & Services
Residents Group

Residents meet regularly to discuss policies, care quality, and activities

Active Resident Council

Organized group of residents that meets regularly to discuss facility policies, quality of life, and activities.

Finances and operations

Privately-owned community
Operated by a business corporation.
Home revenue
$18.8M
Profit
$647.1K
Privately-owned community Operated by a business corporation.
Home revenue
$18.8M Rank #129 / 205Revenue — State benchmarkedThis home is ranked 129th out of 205 homes in Pennsylvania. Shows this facility's annual revenue compared to the Pennsylvania SNF average. Higher revenue generally means more resources for staffing and capital — read alongside Payroll %.Click the rank badge to see the full State ranking.Click here to see the full State ranking.
Profit
$647.1K
Payroll costs Info The portion of the home's budget spent on staff, including nurses, caregivers, and other employees who support care and operations. Rank #169 / 205Payroll — State benchmarkedThis home is ranked 169th out of 205 homes in Pennsylvania. Shows total annual staff payroll benchmarked to the Pennsylvania average. Higher payroll investment relative to peers often signals better staffing and less reliance on cheaper contract labor.Click the rank badge to see the full State ranking.Click here to see the full State ranking.
$6.2M
32.8% of revenue Rank #186 / 205Payroll % — State benchmarkedThis home is ranked 186th out of 205 homes in Pennsylvania. Shows payroll as a percentage of revenue versus the Pennsylvania average. Well-run Pennsylvania SNFs typically land around 53–61% — the top third Statewide. Below 25% may signal understaffing or heavy agency use — read with Staffing ratings.Click the rank badge to see the full State ranking.Click here to see the full State ranking.
Other operating costs Info All remaining costs needed to run the home, such as food, utilities, building maintenance, supplies and administrative expenses.
$12.0M
Total costs $18.1M

Who this home usually serves

TYPE OF STAY

Mostly long-term care residents

Most residents stay for extended periods and receive ongoing daily care.

Places of interest near Chestnut Hill Lodge

Address 3.1 miles from city center Info Estimated distance in miles from Glenside's city center to Chestnut Hill Lodge's address, calculated via Google Maps. — 0.44 miles to nearest hospital (Chestnut Hill Hospital)

Calculate Travel Distance to Chestnut Hill Lodge

Add your location

Address

Financial Assistance for
Nursing Home in Pennsylvania

Chestnut Hill Lodge is located in Glenside, Pennsylvania.
Here are the financial assistance programs available to residents in Pennsylvania.

Get Financial aid guidance

Community HealthChoices (CHC)

PA Medicaid CHC

Age 65+ or disabled
General Pennsylvania resident, Medicaid-eligible, nursing home-level care need.
Income Limits (2025) ~$2,829/month 300% FBR, individual
Asset Limits $2,000 (individual), $3,000 (couple) (excludes home, car).
PA

Managed care model; high urban demand (e.g., Philadelphia, Pittsburgh).

Benefits
Personal care (5-7 hours/day, e.g., bathing, dressing) Respite care (up to 240 hours/year) Adult day care ($70/day) Home modifications ($1,500 avg.)

Pennsylvania OPTIONS Program

PA OPTIONS

Age 60+
General Pennsylvania resident, at risk of nursing home placement.
Income Limits ~$2,000/month individual, varies by region
Asset Limits $8,000 individual
PA

Cost-sharing required above certain income; rural/urban balance.

Benefits
In-home care (3-5 hours/week) Respite (up to 10 days/year) Adult day care (~$70/day) Transportation (~5 trips/month)

Living Independence for the Elderly (LIFE)

Pennsylvania LIFE (PACE)

Age 55+
General PA resident (specific counties), NFLOC, safe with LIFE support.
Income Limits (2025) ~$2,829/month (Medicaid-eligible); private pay option available.
Asset Limits $2,000 (individual), $3,000 (couple) for Medicaid enrollees.
PA

16 providers in 25 counties (e.g., Allegheny, Luzerne); LIFE branding unique to PA.

Benefits
Personal care (5-7 hours/day) Medical care Meals Transportation Respite Therapies

Medicare Savings Program (MSP)

Pennsylvania Medicare Savings Program

Age 65+ or disabled
General PA resident, Medicare Part A/B.
Income Limits (2025) ~$2,510/month (QMB), ~$3,380/month (SLMB), ~$3,598/month (QI)—individual.
Asset Limits $9,430 (individual), $14,130 (couple).
PA

Three tiers; includes Extra Help for Part D; no waitlist.

Benefits
Covers Part B premiums ($174.70/month) Deductibles ($240/year) Copays (~20%)

Family Caregiver Support Program (FCSP)

Pennsylvania Family Caregiver Support Program

Age
General Caregivers of 60+ needing care or 55+ caregivers of others; PA resident; functional needs (2+ ADLs).
Income Limits (2025) No strict cap; reimbursements up to $600/month if care recipient income < ~$2,322/month 185% FPL
Asset Limits Not assessed; need-based.
PA

High demand; includes grandparent caregivers.

Benefits
Respite (4-6 hours/week or 5 days/year) Adult day care ($60/day) Supplies (~$2,000/year) Caregiver training

VA Aid and Attendance (A&A) and Housebound Benefits

Pennsylvania VA Aid and Attendance/Housebound

Age 65+ or disabled veteran/spouse
General PA resident, wartime service, need for ADL help (A&A) or homebound.
Income Limits (2025) Net income < ~$1,984/month (veteran with dependent, A&A); pension offsets income.
Asset Limits ~$155,356 net worth limit
PA

High veteran population; supports rural/urban care needs.

Benefits
Cash (~$1,433-$2,642/month veteran, ~$951-$1,318 spouse) for care costs (e.g., in-home, assisted living)

Property Tax/Rent Rebate Program (PTRR)

Pennsylvania Property Tax/Rent Rebate Program

Age 65+
General PA resident, homeowner/renter (or widow/er 50+, disabled 18+).
Income Limits (2025) ~$45,000/year individual or couple, excludes half of Social Security
Asset Limits Not assessed; income-focused.
PA

Rebates up to $1,000; ~600,000 eligible annually.

Benefits
Rebates ($250-$1,000 based on income; e.g., $1,000 if income < $8,000)

Senior Farmers’ Market Nutrition Program (SFMNP)

Pennsylvania SFMNP

Age 60+
General PA resident, low-income.
Income Limits (2025) ~$2,322/month individual, 185% FPL
Asset Limits Not assessed.
PA

Vouchers (~$50/season) via 52 AAAs; serves ~200,000 annually.

Benefits
Vouchers (~$50/season) for fresh produce at approved markets

Compare Nursing Home around Bethlehem

The information below is reported by the Pennsylvania Department of Human Services and Department of Health.

4 facilities compared · CMS & PA Dept. of Health data

Filter by care type
Moravian Village of Bethlehem
NH

Nursing Home Licensed facility providing 24/7 skilled nursing care for residents with complex, ongoing medical needs. Staffed by RNs, LPNs, and CNAs. Inspected and star-rated annually by CMS. Accepts Medicare (short-term rehab) and Medicaid (long-term care).

AL

Assisted Living A licensed, long-term care setting for seniors or individuals with disabilities who need help with daily activities — like bathing, dressing, and medication management — but not 24-hour skilled nursing. Offers housing, meals, and around-the-clock support while aiming to maximize resident independence.

IL

Independent Living Lifestyle-focused communities for older adults offering dining, activities, and transportation with minimal personal care. Best for active, independent seniors who want community without medical support.

MC

Memory Care Secured, specialized care for people living with Alzheimer's or dementia. Staff trained in cognitive impairment, with higher staff-to-resident ratios and an environment designed to reduce confusion and wandering risk.

Bethlehem (Central Bethlehem) 250 43.8% -44% 4.61 +24% +11% $0 4 1.3 - 49 - 59 Moravian Village Of Bethlehem, Inc. $20.0M $9.0M 45.2% 396096
Kirkland Village
NH

Nursing Home Licensed facility providing 24/7 skilled nursing care for residents with complex, ongoing medical needs. Staffed by RNs, LPNs, and CNAs. Inspected and star-rated annually by CMS. Accepts Medicare (short-term rehab) and Medicaid (long-term care).

AL

Assisted Living A licensed, long-term care setting for seniors or individuals with disabilities who need help with daily activities — like bathing, dressing, and medication management — but not 24-hour skilled nursing. Offers housing, meals, and around-the-clock support while aiming to maximize resident independence.

IL

Independent Living Lifestyle-focused communities for older adults offering dining, activities, and transportation with minimal personal care. Best for active, independent seniors who want community without medical support.

MC

Memory Care Secured, specialized care for people living with Alzheimer's or dementia. Staff trained in cognitive impairment, with higher staff-to-resident ratios and an environment designed to reduce confusion and wandering risk.

Bethlehem 64 69.0% -12% 4.30 +46% +4% $0 8 4.0 - 41 A+ 12 Presbyterian Homes, Inc. $29.5M $9.2M 31.2% 395916
Country Meadows of Bethlehem V
NH

Nursing Home Licensed facility providing 24/7 skilled nursing care for residents with complex, ongoing medical needs. Staffed by RNs, LPNs, and CNAs. Inspected and star-rated annually by CMS. Accepts Medicare (short-term rehab) and Medicaid (long-term care).

AL

Assisted Living A licensed, long-term care setting for seniors or individuals with disabilities who need help with daily activities — like bathing, dressing, and medication management — but not 24-hour skilled nursing. Offers housing, meals, and around-the-clock support while aiming to maximize resident independence.

Bethlehem 126 77.3% -2% 4.08 -20% -2% $0 6 3.0 - 62 - 5 Leader Holdings, LP $11.7M $7.8M 66.5% 396053
Chestnut Hill Lodge
NH

Nursing Home Licensed facility providing 24/7 skilled nursing care for residents with complex, ongoing medical needs. Staffed by RNs, LPNs, and CNAs. Inspected and star-rated annually by CMS. Accepts Medicare (short-term rehab) and Medicaid (long-term care).

AL

Assisted Living A licensed, long-term care setting for seniors or individuals with disabilities who need help with daily activities — like bathing, dressing, and medication management — but not 24-hour skilled nursing. Offers housing, meals, and around-the-clock support while aiming to maximize resident independence.

Glenside 181 92.1% +17% 4.18 -52% +1% $19.5k 48 5.3 2 162 - 56 Ch Operating Holdings LLC $18.8M $6.2M 32.8% 395334

Frequently Asked Questions about Chestnut Hill Lodge

What neighborhood is Chestnut Hill Lodge in?

Chestnut Hill Lodge is in the Glenside neighborhood.

Is Chestnut Hill Lodge in a walkable area?

Chestnut Hill Lodge has a walk score of 56. Moderately walkable. Some errands can be accomplished on foot, with a mix of nearby amenities.

What is the occupancy rate at Chestnut Hill Lodge?

Chestnut Hill Lodge's occupancy is 92.1%.

Are there photos of Chestnut Hill Lodge?

Yes — there are 6 photos of Chestnut Hill Lodge in the photo gallery on this page.

What is the phone number of Chestnut Hill Lodge?

(215) 836-2100 will put you in contact with the team at Chestnut Hill Lodge.

Is Chestnut Hill Lodge Medicare or Medicaid certified?

Yes — Chestnut Hill Lodge is a CMS-certified provider of Medicare and Medicaid.

Guides for Better Senior Living

Care Cost Calculator: See Prices in Your Area

Nursing Home Data Explorer

Don’t Wait Too Long: 7 Red Flag Signs Your Parent Needs Assisted Living Now

The True Cost of Assisted Living in 2025 – And How Families Are Paying For It

Understanding Senior Living Costs: Pricing Models, Discounts & Financial Assistance

Explore Open Rooms
1 Contact details
2 What type of senior care service are you looking for?
3 What budget do you have in mind for senior care?
4 How soon do you need to find care?
5 Additional details

Thank you for your interest!

Our team will be in touch shortly to help with next steps.