Cimarron Estates
Nursing Home, Assisted Living & Independent Living · Corpus Christi, TX
CMS overall rating Info CMS (the Centers for Medicare & Medicaid Services) is the federal agency that rates nursing home quality. Its Overall Rating runs from 1 to 5 stars, combining health inspections, staffing, and quality measures, with inspections weighted most heavily.

Cimarron Estates

Nursing Home, Assisted Living & Independent Living · Corpus Christi, TX
CMS overall rating Info CMS (the Centers for Medicare & Medicaid Services) is the federal agency that rates nursing home quality. Its Overall Rating runs from 1 to 5 stars, combining health inspections, staffing, and quality measures, with inspections weighted most heavily.
Calculator: See prices in your area
Cimarron Estates accepts Medicare, Medicaid, and private pay.

Overview of Cimarron Estates

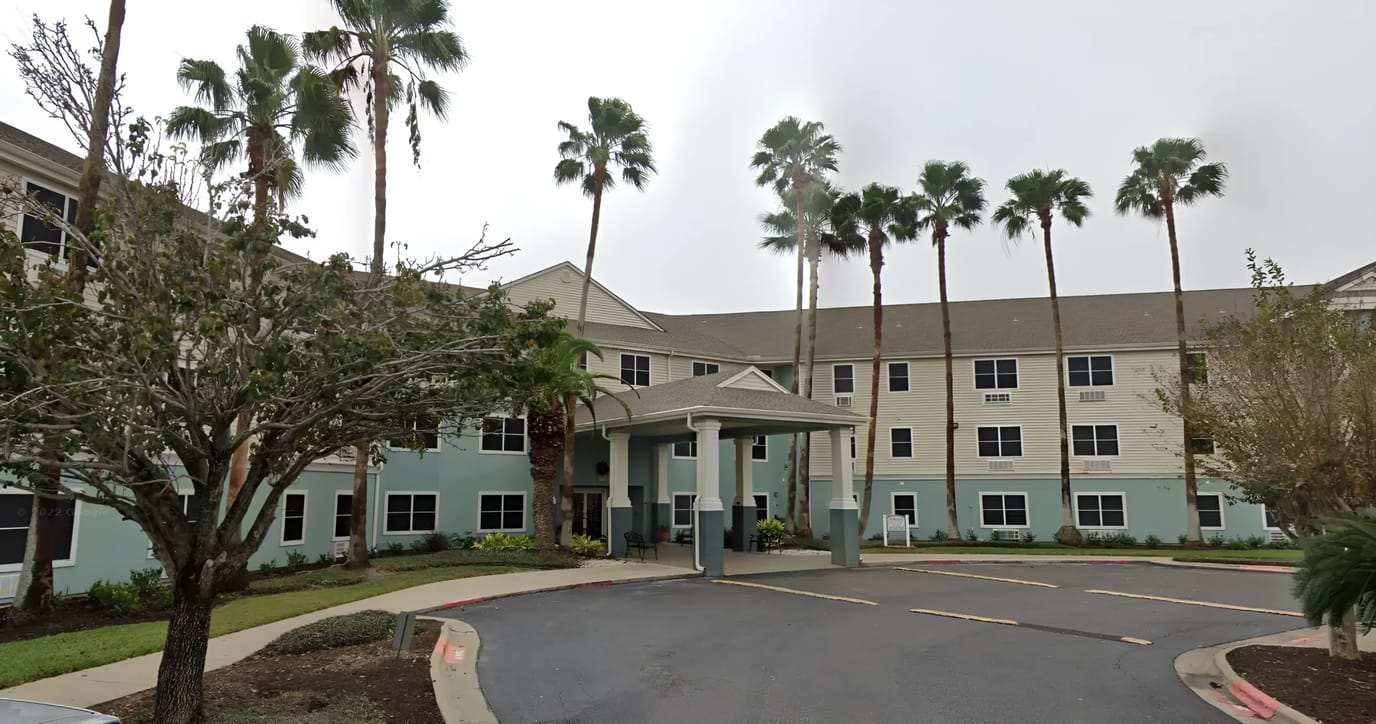
Cimarron Estates is a senior living community located in Corpus Christi, TX, offering accessible homes and amenities for active seniors. They offer generously sized, one-to-two bedroom apartments featuring large kitchen and dining areas and living rooms, walk-in closets, and private bathrooms with tubs. Select floor plans may also include a private outdoor space such as a patio or balcony.

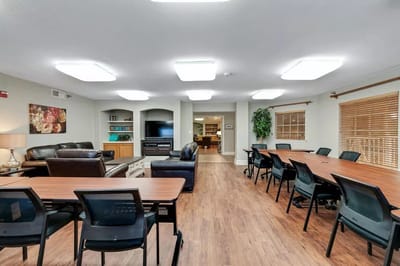
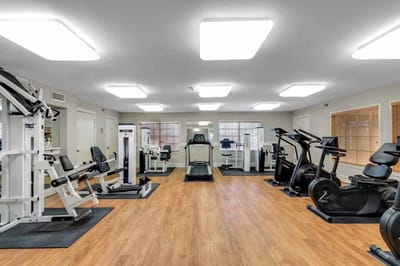
At Cimarron Estates, there are also a rich array of amenities to take advantage of. This smoke-free senior community offers access to the library and clubhouse, as well as a billiards room and fitness center for exercise or socialization. The community is also pet-friendly and offers 24 hour emergency maintenance should anything in the residents’ homes have to be fixed.

(361) 994-9956

Quality ratings

Measured by Centers for Medicare & Medicaid Services (CMS)

Overall rating Info The Overall CMS Rating combines results from health inspections, staffing levels and quality measures. Health inspections carry the most weight. Staffing and quality scores can increase or decrease the final rating based on performance compared to state and national standards.
▲ 78.9% Above TX avg. ▲ 78.9% Above TX avg.TX average: 2.8Click the badge to see the full State ranking.Click here to see the full State ranking.
Health Inspection Info Based on the results of the facility's three most recent standard inspections and any complaint investigations. CMS reviews the number, scope, and severity of deficiencies, with more recent findings weighted more heavily.
▲ 44.7% Above TX avg. ▲ 44.7% Above TX avg.TX average: 2.8Click the badge to see the full State ranking.Click here to see the full State ranking.
Staffing Info Measures average nursing staff hours per resident per day, including Registered Nurses (RNs) and total nursing staff. Ratings are adjusted based on the level of care residents require and are compared to state and national benchmarks.
▼ 5.7% Below TX avg. ▼ 5.7% Below TX avg.TX average: 2.1Click the badge to see the full State ranking.Click here to see the full State ranking.
Quality Measures Info Based on clinical and physical health indicators reported to CMS, such as hospital readmissions, falls, pressure ulcers, and improvements in mobility. These measures reflect how well residents' health needs are being managed.
▲ 33.2% Above TX avg. ▲ 33.2% Above TX avg.TX average: 3.8Click the badge to see the full State ranking.Click here to see the full State ranking.

Staffing hours breakdown

Info Daily nursing hours per resident by staff type, reported to CMS. Higher is generally better — compare this facility to state and national averages to see where staffing stands.

Hours per resident per day — compared to Texas state averages

Total nursing care / resident Info This home is ranked 191st out of 296 homes in Texas for nurse hours. Total adjusted nursing hours per resident per day, combining RN, LPN, and aide time. CMS adjusts this for case-mix so facilities can be fairly compared.
3h 17m per day
Rank #191 / 296Nurse hours — State benchmarkedThis home is ranked 191st out of 296 homes in Texas. Shows adjusted nurse hours per resident per day benchmarked to the Texas average, with a ranking across 296 Texas facilities. More hours mean more direct care. The national average is about 3.5 hrs; below 3.0 is a red flag.Rankings are based only on facilities in Texas that report data for that category. Facilities without available data are excluded from the ranking.Click the rank badge to see the full State ranking.Click here to see the full State ranking.
This facility Texas avg (3h 38m per day)
vs Texas avg
-10%

1 of 6 metrics below state avg

Standout metric Weekend RN is +37% above state avg
Staff typeHours / Day / Residentvs state avg
Registered Nurse (RN) Info RNs hold the highest nursing license and can assess residents, interpret test results, and direct care plans. More RN hours per day often signals stronger clinical oversight and faster response to health changes. 25m per day ■ Avg State avg: 25m per day · National avg: 41m per day
LPN / LVN Info Licensed Practical Nurses (LPNs) or Licensed Vocational Nurses (LVNs) deliver routine hands-on care — medication administration, wound dressing, and monitoring vital signs. They work under RN supervision and make up a large share of daily bedside care. 56m per day ■ Avg State avg: 57m per day · National avg: 52m per day
Nurse Aide Info Certified Nurse Aides (CNAs) provide the most direct day-to-day assistance: bathing, dressing, feeding, and mobility. Nurse aide hours are typically the largest staffing category and directly affect residents' quality of life. 2h 8m per day ▲ 6% State avg: 2h 1m per day · National avg: 2h 20m per day
Weekend Total Nursing Info Combined nursing hours (RN + LPN + Nurse Aide) per resident per day on weekends. Staffing often drops on weekends — this figure reveals whether the facility maintains adequate coverage outside of weekday hours. 3h 7m per day ▲ 4% State avg: 3h 0m per day · National avg: 3h 27m per day
Physical Therapist Info Hours per resident per day provided by licensed Physical Therapists (PTs) or PT Assistants. PT services help residents recover mobility after injury or illness and are especially important for post-acute (short-stay) rehabilitation. 2m per day ▼ 41% State avg: 4m per day · National avg: 4m per day
Weekend RN Info Registered nurse hours specifically on weekends. Facilities sometimes reduce RN presence on Saturdays and Sundays — a low weekend RN figure compared to weekday hours can indicate reduced clinical oversight when most administrative staff are absent. 27m per day ▲ 37% State avg: 20m per day · National avg: 29m per day

Capacity and availability

This home usually has availability

Lower occupancy than the Texas average: 63.5%
Occupancy rate
59.7% Rank #202 / 304Occupancy rate — State benchmarkedThis home is ranked 202nd out of 304 homes in Texas. Shows this facility's occupancy rate versus the Texas average, with its Statewide rank out of 304. Higher occupancy signals strong local demand and financial stability.Rankings are based only on facilities in Texas that report data for that category. Facilities without available data are excluded from the ranking.Click the rank badge to see the full State ranking.Click here to see the full State ranking.
Avg. Length of Stay
68 days
Bed community size
120-bed community Rank #210 / 988Bed count — State benchmarkedThis home is ranked 210th out of 988 homes in Texas. Shows this facility's certified or reported bed count compared to other Texas facilities. Larger communities may offer more amenities, programs, and on-site services for residents and families.Rankings are based only on facilities in Texas that report data for that category. Facilities without available data are excluded from the ranking.Click the rank badge to see the full State ranking.Click here to see the full State ranking.
A larger shared setting that may offer more common spaces and organized community services.
Walk Score
Walk Score: 40 / 100 Rank #734 / 1391Walk Score — State benchmarkedThis home is ranked 734th out of 1391 homes in Texas. Shows how walkable this facility's neighborhood is compared to the average Walk Score across Texas facilities. Higher scores benefit residents, families, and staff.Rankings are based only on facilities in Texas that report data for that category. Facilities without available data are excluded from the ranking.Click the rank badge to see the full State ranking.Click here to see the full State ranking.
Somewhat walkable. A few nearby services may be reachable on foot, but most trips require transportation.

Safety & Compliance

Safety FeaturesSmoke Free, On-site maintenance

Additional Policies & Features

Pets Allowed
Minimum Age62+
Utilities IncludedYes

Amenities & Lifestyle

Fitness Center
Library
Spa
Restaurant
Patio
Billiards
Transportation
Touring HoursMonday 8:30AM-5:30PM; Tuesday 8:30AM-5:30PM; Wednesday 8:30AM-5:30PM; Thursday 8:30AM-5:30PM; Friday 8:30AM-5:30PM; Saturday 10:00AM-5:00PM

Pricing & Financial Information

Starting Price$823 per month

Contact Cimarron Estates

Staffing Data

Reporting period: October 1 – December 31, 2025 (Q4 2025). Source: CMS Payroll-Based Journal report.

Total staff 116
Employees 84
Contractors 32
Staff to resident ratio 1.73 : 1
17% more staff per resident than Texas average
Texas average ratio: 1.48 : 1 Texas average ratio: 1.48 : 1See full Texas ranking
Avg staff/day 41
Average shift 7.5 hours
7% worse than Texas average
Texas average: 8.1 hours Texas average shift: 8.1 hoursSee full Texas ranking
Total staff hours (quarter) 28,168

Nursing staff breakdown

Q4 2025 · Oct 1 – Dec 31 More info This data comes from the CMS Payroll-Based Journal report covering October 1 – December 31, 2025.
Registered Nurse

Manages medical care and health needs.

RN Staff Info All 7 RN Staff are full-time employees. No contractors work on this role. 7
Average shift length Info Average shift length. Calculated as total hours divided by days worked and average staff per day. 8.7 hours
Licensed Practical Nurse

Assists with medical care and medications.

LPN Staff Info All 19 LPN Staff are full-time employees. No contractors work on this role. 19
Average shift length Info Average shift length. Calculated as total hours divided by days worked and average staff per day. 8 hours
Certified Nursing Assistant

Helps with daily care and mobility.

CNA Staff Info All 45 CNA Staff are full-time employees. No contractors work on this role. 45
Average shift length Info Average shift length. Calculated as total hours divided by days worked and average staff per day. 7.5 hours

Contractor staffing

Q4 2025 · Oct 1 – Dec 31 More info This data comes from the CMS Payroll-Based Journal report covering October 1 – December 31, 2025.

Total hours from contractors

11.1%

3,130 contractor hours this quarter

Physical Therapy Aide: 7 Speech Language Pathologist: 6 Respiratory Therapy Technician: 6 Physical Therapy Assistant: 5 Qualified Social Worker: 4 Occupational Therapy Aide: 3 Medical Director: 1

Staff by category

Q4 2025 · Oct 1 – Dec 31 More info This data comes from the CMS Payroll-Based Journal report covering October 1 – December 31, 2025.
Certified Nursing Assistant4504511,93592100%7.5
Licensed Practical Nurse190196,27992100%8
Registered Nurse7072,33592100%8.7
Medication Aide/Technician7072,30792100%9.4
Physical Therapy Aide0778938491%6.3
Speech Language Pathologist0668768896%6
Physical Therapy Assistant0554867683%6.2
Nurse Practitioner1014806470%7.5
Qualified Social Worker0444697076%6.4
Mental Health Service Worker1014656267%7.5
Dietitian1014445762%7.8
Administrator2024135560%7.5
Other Dietary Services Staff1013827278%5.3
Respiratory Therapy Technician0662636267%3.3
Occupational Therapy Aide0331132426%4.7
Medical Director011301213%2.5
45 Certified Nursing Assistant
% of Days 100%
19 Licensed Practical Nurse
% of Days 100%
7 Registered Nurse
% of Days 100%
7 Medication Aide/Technician
% of Days 100%
7 Physical Therapy Aide
% of Days 91%
6 Speech Language Pathologist
% of Days 96%
5 Physical Therapy Assistant
% of Days 83%
1 Nurse Practitioner
% of Days 70%
4 Qualified Social Worker
% of Days 76%
1 Mental Health Service Worker
% of Days 67%
1 Dietitian
% of Days 62%
2 Administrator
% of Days 60%
1 Other Dietary Services Staff
% of Days 78%
6 Respiratory Therapy Technician
% of Days 67%
3 Occupational Therapy Aide
% of Days 26%
1 Medical Director
% of Days 13%

Penalties and fines

Includes penalties issued in 2024

Federal penalties imposed by CMS for regulatory violations, including civil money penalties (fines) and denials of payment for new Medicare/Medicaid admissions.

Source: CMS Penalties Database (Data as of Jan 2026)

Total fines amount $10K Rank #132 / 301Federal fines — State benchmarkedThis home is ranked 132nd out of 301 homes in Texas. Shows this facility's cumulative CMS federal fine dollars versus the Texas average among facilities with fines, and where it ranks among 301 facilities in the pool. Lower total dollars mean a better rank.Rankings are based only on facilities in Texas that report data for that category. Facilities without available data are excluded from the ranking.Click the rank badge to see the full State ranking.Click here to see the full State ranking.
88% lower than Texas average

Texas average: $80K

Number of fines 1
60% fewer fines than Texas average

Texas average: 2.5

Payment Denials Info Serious action where Medicare and/or Medicaid temporarily stops payments for new residents until issues are fixed. 0
100% fewer payment denials than Texas average

Texas average: 0.2

Fines amount comparison
This facility $10K
Texas average $80K
Penalty History

Penalties are imposed by CMS for violations of federal nursing home regulations.

1 penalty in the past 3 years

Jun 27, 2024 · $10K

Civil Money Penalty Info Fines imposed for noncompliance, which can be assessed per day or per instance of violation. Jun 27, 2024
$10K

Last updated: Jan 2026

Quality of care over time

These measures show how residents usually do over time at this home, based on health outcomes and preventive care.

High-risk clinical events score Info A composite score based on pressure ulcers, falls with injury, weight loss, walking ability decline, and activities of daily living decline. 5.9
32% better than Texas average

Texas average: 8.6

Functional decline score Info A composite score based on activities of daily living decline, walking ability decline, and incontinence. 8.5
47% better than Texas average

Texas average: 16.0

Long-stay resident measures
Need for Help with Daily Activities Increased Info Percent of long-stay residents whose need for help with daily activities has increased 3.6%
78% better than Texas average

Texas average: 16.2%

Walking Ability Worsened Info Percent of long-stay residents whose ability to move independently worsened 20.3%
25% worse than Texas average

Texas average: 16.2%

Low Risk Residents with Bowel/Bladder Incontinence Info Percent of low risk long-stay residents who lose control of their bowels or bladder 1.6%
90% better than Texas average

Texas average: 15.7%

Falls with Major Injury Info Percent of long-stay residents experiencing one or more falls with major injury 0.9%
71% better than Texas average

Texas average: 3.2%

High Risk Residents with Pressure Ulcers Info Percent of long-stay high risk residents with pressure ulcers 4.4%
In line with Texas average

Texas average: 4.4%

Urinary Tract Infection Info Percent of long-stay residents with a urinary tract infection 1.0%
21% worse than Texas average

Texas average: 0.8%

Lost Too Much Weight Info Percent of long-stay residents who lose too much weight 0.0%
100% better than Texas average

Texas average: 3.5%

Depressive Symptoms Info Percent of long-stay residents who have depressive symptoms 0.0%
100% better than Texas average

Texas average: 2.9%

Antipsychotic Use Info Percent of long-stay residents who received an antipsychotic medication 1.0%
87% better than Texas average

Texas average: 7.9%

Pneumococcal Vaccine Info Percent of long-stay residents assessed and appropriately given the pneumococcal vaccine 99.5%
In line with Texas average

Texas average: 97.3%

Influenza Vaccine Info Percent of long-stay residents assessed and appropriately given the seasonal influenza vaccine 100.0%
In line with Texas average

Texas average: 97.9%

Short-stay resident measures
Pneumococcal Vaccine Info Percent of short-stay residents assessed and appropriately given the pneumococcal vaccine 75.9%
16% worse than Texas average

Texas average: 90.4%

Antipsychotic medication increase Info Percent of short-stay residents who newly received an antipsychotic medication 0.2%
88% better than Texas average

Texas average: 1.4%

Influenza Vaccine Info Percent of short-stay residents assessed and appropriately given the seasonal influenza vaccine 47.3%
46% worse than Texas average

Texas average: 88.0%

Breakdown by payment type

Medicare

27% of new residents, usually for short-term rehab.

Typical stay 28 days

Private pay

69% of new residents, often for short stays.

Typical stay 27 days

Medicaid

5% of new residents, often for long-term daily care.

Typical stay 2 years

Facility Characteristics

Source: CMS Long-Term Care Facility Characteristics (Data as of Jan 2026)

Total residents 67
Medicare
18
26.9% of residents
Medicaid
40
59.7% of residents
Private pay or other
9
13.4% of residents
Programs & Services
Residents Group

Residents meet regularly to discuss policies, care quality, and activities

Active Resident Council

Organized group of residents that meets regularly to discuss facility policies, quality of life, and activities.

Finances and operations

Based on CMS SNF Cost Report for fiscal year ending in 12/2023.

Privately-owned community
Operated by a single business entity.
Net patient revenue Info Net patient revenue — what the home actually collects for resident care, after contractual allowances, bad debt and discounts are subtracted from its gross charges (CMS cost report, Worksheet G-3). It covers resident care only; money the home earns from other sources is shown separately as "Other income."
$7.2M
Net patient income Info Net patient income: net patient revenue minus the home's total operating expenses. A positive figure means it earns more from resident care than it spends to deliver it; a negative figure means the opposite. It excludes non-operating "other income."
-$590.4K
Privately-owned community Operated by a single business entity.
Net patient revenue Info Net patient revenue — what the home actually collects for resident care, after contractual allowances, bad debt and discounts are subtracted from its gross charges (CMS cost report, Worksheet G-3). It covers resident care only; money the home earns from other sources is shown separately as "Other income."
$7.2M Rank #199 / 304Revenue — State benchmarkedThis home is ranked 199th out of 304 homes in Texas. Shows this facility's annual revenue compared to the Texas average. Higher revenue generally means more resources for staffing and capital — read alongside Payroll %.Rankings are based only on facilities in Texas that report data for that category. Facilities without available data are excluded from the ranking.Click the rank badge to see the full State ranking.Click here to see the full State ranking.
Net patient income Info Net patient income: net patient revenue minus the home's total operating expenses. A positive figure means it earns more from resident care than it spends to deliver it; a negative figure means the opposite. It excludes non-operating "other income."
-$590.4K
Other income Info Money the home earns outside of resident care — such as investments, grants, rentals and other non-operating sources (CMS cost report, Worksheet G-3). It is tracked separately from net patient revenue: it is not part of that figure, and it is not included in net patient income.
$3.7K
Payroll costs Info Staff salaries plus wage-related costs — benefits such as payroll taxes, health insurance and retirement — from the home's own accounting records (CMS cost report, Worksheet A). Contract or agency labor is counted separately, under other operating costs. Rank #239 / 304Payroll — State benchmarkedThis home is ranked 239th out of 304 homes in Texas. Shows total annual staff payroll benchmarked to the Texas average. Higher payroll investment relative to peers often signals better staffing and less reliance on cheaper contract labor.Rankings are based only on facilities in Texas that report data for that category. Facilities without available data are excluded from the ranking.Click the rank badge to see the full State ranking.Click here to see the full State ranking.
$3.0M 41.9% of net patient revenue Info Payroll as a share of revenue: staff salaries and wage-related benefits divided by net patient revenue. A higher figure means more of each revenue dollar goes to staff pay. Rank #237 / 304Payroll % — State benchmarkedThis home is ranked 237th out of 304 homes in Texas. Shows payroll as a percentage of revenue versus the Texas average. Well-run Texas facilities typically land around 51–63% — the top third Statewide. Below 25% may signal understaffing or heavy agency use — read with Staffing ratings.Rankings are based only on facilities in Texas that report data for that category. Facilities without available data are excluded from the ranking.Click the rank badge to see the full State ranking.Click here to see the full State ranking.
Other operating costs Info Everything it costs to run the home apart from payroll — food, utilities, supplies, maintenance, contract labor and administration. Calculated as total operating expense minus payroll (staff salaries and wage-related benefits).
$4.8M
Total costs Info The home's total operating expense for the year — all the costs of running it, salaries included (CMS cost report, Worksheet G-3).
$7.8M

What does this home offer?

Room sizes icon
Room sizes icon

Room Sizes: 624 / 753 sq. ft

Housing options icon

Housing Options: 1 Bed / 2 Bed

Who this home usually serves

TYPE OF STAY

Primarily short stays

Residents typically stay for brief periods, with frequent admissions and discharges throughout the year.

Most new residents arrive under private pay (69% of admissions), and a typical private pay stay runs around 27 days.

Admissions
391 total

Coverage residents most often arrive under.

Medicare 27%
Private pay 69%
Medicaid 5%
Discharges
382 total

Coverage residents most often leave under.

Medicare 20%
Private pay 69%
Medicaid 11%

Places of interest near Cimarron Estates

Address 12.1 miles from city center Info Estimated distance in miles from Corpus Christi's city center to Cimarron Estates's address, calculated via Google Maps. — 0.41 miles to nearest hospital (Corpus Christi Medical Center Bayview)

Calculate Travel Distance to Cimarron Estates

Add your location

Address

Compare Nursing Homes around Corpus Christi

The information below is reported by the Texas Health and Human Services Commission.

4 facilities compared · CMS & TX Dept. of Health data

Cimarron Estates
NH
AL
IL
Corpus Christi (South Side)
120
Facility 120
TX AVG 80
Rank #210 / 988
59.7%
Facility 59.7%
TX AVG 63.5%
Rank #202 / 304
-6%
3.28
Facility 3.28
TX AVG 3.63
Rank #191 / 296
-22%-10%
$19.1k
Facility $19.1k
TX AVG $81.8k
Rank #132 / 301
16
Facility 16
TX AVG 25.9
Rank #76 / 299
2.3
Facility 2.3
TX AVG 3.7
Rank #48 / 299
173-
40
Facility 40
TX AVG 41
Rank #734 / 1391
Cascade Nueces Health Services Ltd
$7.2M
Facility $7.2M
TX AVG $8.4M
Rank #199 / 304
$3.0M
Facility $3.0M
TX AVG $3.5M
Rank #239 / 304
41.9%
Facility 41.9%
TX AVG 47%
Rank #237 / 304
676087
Brookdale Trinity Towers
NH
AL
IL
MC
Corpus Christi
75
Facility 75
TX AVG 80
Rank #496 / 988
78.9%
Facility 78.9%
TX AVG 63.5%
Rank #80 / 304
+24%
4.72
Facility 4.72
TX AVG 3.63
Rank #36 / 296
+11%+30%
$16.4k
Facility $16.4k
TX AVG $81.8k
Rank #122 / 301
13
Facility 13
TX AVG 25.9
Rank #48 / 299
3.3
Facility 3.3
TX AVG 3.7
Rank #152 / 299
148-
50
Facility 50
TX AVG 41
Rank #515 / 1391
Arc Corpus Christi, LLC
$16.1M
Facility $16.1M
TX AVG $8.4M
Rank #160 / 304
$9.8M
Facility $9.8M
TX AVG $3.5M
Rank #26 / 304
60.8%
Facility 60.8%
TX AVG 47%
Rank #2 / 304
675773
Caraday of Corpus Christi Assisted Living
NH
AL
Corpus Christi (Central City)
121
Facility 121
TX AVG 80
Rank #205 / 988
80.2%
Facility 80.2%
TX AVG 63.5%
Rank #70 / 304
+26%
3.38
Facility 3.38
TX AVG 3.63
Rank #174 / 296
-11%-7%
$14.1k
Facility $14.1k
TX AVG $81.8k
Rank #108 / 301
25
Facility 25
TX AVG 25.9
Rank #187 / 299
2.8
Facility 2.8
TX AVG 3.7
Rank #94 / 299
189-
21
Facility 21
TX AVG 41
Rank #1079 / 1391
Stratford Hospital District
$8.3M
Facility $8.3M
TX AVG $8.4M
Rank #191 / 304
$4.6M
Facility $4.6M
TX AVG $3.5M
Rank #181 / 304
55%
Facility 55%
TX AVG 47%
Rank #133 / 304
455697
The Viera Senior Living
NH
AL
IL
MC
Corpus Christi (South Side)
123
Facility 123
TX AVG 80
Rank #189 / 988
77.5%
Facility 77.5%
TX AVG 63.5%
Rank #89 / 304
+22%
3.33
Facility 3.33
TX AVG 3.63
Rank #191 / 296
-63%-8%
$21.7k
Facility $21.7k
TX AVG $81.8k
Rank #143 / 301
32
Facility 32
TX AVG 25.9
Rank #230 / 299
4.0
Facility 4.0
TX AVG 3.7
Rank #215 / 299
294-
33
Facility 33
TX AVG 41
Rank #884 / 1391
Port Lavaca Nh LLC
$10.0M
Facility $10.0M
TX AVG $8.4M
Rank #138 / 304
$5.9M
Facility $5.9M
TX AVG $3.5M
Rank #103 / 304
58.9%
Facility 58.9%
TX AVG 47%
Rank #85 / 304
676481

Financial Assistance for
Nursing Home in Texas

Cimarron Estates is located in Corpus Christi, Texas.
Here are the financial assistance programs available to residents in Texas.

Get Financial aid guidance

Community Care for the Aged and Disabled (CCAD)

TX Medicaid CCAD

Age 65+ or disabled
General Texas resident, Medicaid-eligible, care need (not always nursing home level).
Income Limits (2025) ~$2,829/month 300% FBR, individual
Asset Limits $2,000 (individual), $3,000 (couple).
TX

Large state; rural access challenges.

Benefits
Personal care (5-7 hours/day) Respite (240 hours/year) Adult day care (~$60/day) Home aides

Texas Community Care Services

TX CCS

Age 60+
General Texas resident, at risk of decline.
Income Limits ~$2,000/month individual, varies
Asset Limits $5,000 individual
TX

Limited funding; high demand in urban areas.

Benefits
In-home care (3-5 hours/week) Respite (up to 10 days/year) Transportation (~5 trips/month)

Area Agency on Aging (AAA) Services

Texas AAA Services

Age 60+
General TX resident; no income/asset limits.
Income Limits (2025) None; donations encouraged.
Asset Limits Not assessed.
TX

28 AAAs; includes Meals on Wheels in some areas.

Benefits
Meals (~$5-$7/meal) Transportation Homemaker services (~4 hours/week) Respite (~5 days/year) Legal aid

Medicare Savings Program (MSP)

Texas Medicare Savings Program

Age 65+ or disabled
General TX resident, Medicare Part A/B.
Income Limits (2025) ~$2,510/month (QMB), ~$3,380/month (SLMB), ~$3,598/month (QI)—individual.
Asset Limits $9,430 (individual), $14,130 (couple).
TX

Includes Extra Help for Part D; no waitlist.

Benefits
Covers Part B premiums ($174.70/month) Deductibles ($240/year) Copays (~20%)

Family Caregiver Support Program (FCSP)

Texas Family Caregiver Support Program

Age
General Caregivers of 60+ needing care or 55+ caregivers of others; TX resident; 2+ ADLs.
Income Limits (2025) No strict cap; prioritizes low-income ~$24,980/year
Asset Limits Not assessed.
TX

High rural demand; includes grandparent caregivers.

Benefits
Respite (4-6 hours/week or 5 days/year) Adult day care ($60/day) Training Supplies (~$500/year)

VA Aid and Attendance (A&A) and Housebound Benefits

Texas VA Aid and Attendance/Housebound

Age 65+ or disabled veteran/spouse
General TX resident, wartime service, ADL help (A&A) or homebound.
Income Limits (2025) Net income < ~$1,984/month (veteran with dependent, A&A); pension offsets income.
Asset Limits ~$155,356 net worth
TX

High veteran population; supports rural/urban needs.

Benefits
Cash (~$1,433-$2,642/month veteran, ~$951-$1,318 spouse) for care costs

Property Tax Exemption for Seniors

Texas Senior Property Tax Exemption

Age 65+
General TX resident, homeowner (homestead).
Income Limits (2025) None; tax-based eligibility.
Asset Limits Not assessed.
TX

$25,000+ exemption; optional freeze in some counties; saves ~$500-$1,000/year.

Benefits
Tax exemption or freeze (~$500-$1,000/year savings)

Senior Farmers’ Market Nutrition Program (SFMNP)

Texas SFMNP

Age 60+
General TX resident, low-income.
Income Limits (2025) ~$2,322/month 185% FPL
Asset Limits Not assessed.
TX

Vouchers (~$50/season); serves ~20,000 via 28 AAAs.

Benefits
Vouchers (~$50/season) for produce at farmers’ markets

Frequently Asked Questions about Cimarron Estates

What neighborhood is Cimarron Estates in?

Cimarron Estates is in the South Side neighborhood.

Is Cimarron Estates in a walkable area?

Cimarron Estates has a walk score of 40. Somewhat walkable. A few nearby services may be reachable on foot, but most trips require transportation.

What is the occupancy rate at Cimarron Estates?

Cimarron Estates's occupancy is 59.7%.

Are there photos of Cimarron Estates?

Yes — there are 8 photos of Cimarron Estates in the photo gallery on this page.

What is the address of Cimarron Estates?

Cimarron Estates is located at 2802 Cimarron Blvd, Corpus Christi, TX 78414.

What is the phone number of Cimarron Estates?

(361) 994-9956 will put you in contact with the team at Cimarron Estates.

Is Cimarron Estates Medicare or Medicaid certified?

Yes — Cimarron Estates is a CMS-certified provider of Medicare and Medicaid.

Guides for Better Senior Living

Care Cost Calculator: See Prices in Your Area

Nursing Home Data Explorer

Don’t Wait Too Long: 7 Red Flag Signs Your Parent Needs Assisted Living Now

The True Cost of Assisted Living in 2025 – And How Families Are Paying For It

Understanding Senior Living Costs: Pricing Models, Discounts & Financial Assistance