Explore Open Rooms

1 Contact details
2 What type of senior care service are you looking for?
3 What budget do you have in mind for senior care?
4 How soon do you need to find care?
5 Additional details

Thank you for your interest!

Our team will be in touch shortly to help with next steps.

Nursing Home in Bourbonnais

CMS overall rating Info The Overall CMS Rating combines results from health inspections, staffing levels and quality measures. Health inspections carry the most weight. Staffing and quality scores can increase or decrease the final rating based on performance compared to state and national standards.

Citadel of Bourbonnais

20 Briarcliff Ln, Bourbonnais, IL 60914 View map
Overview of Citadel of Bourbonnais

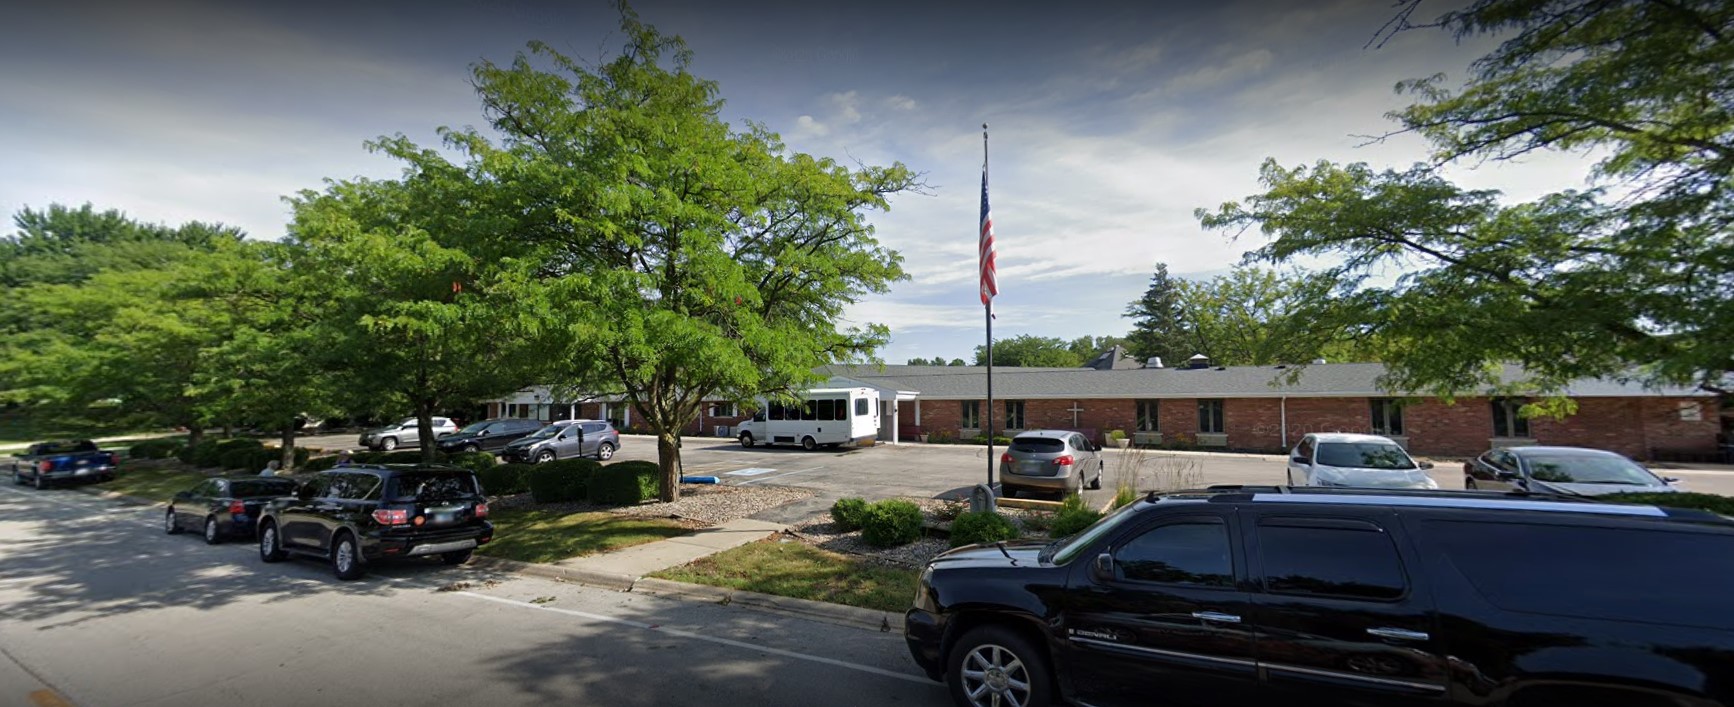
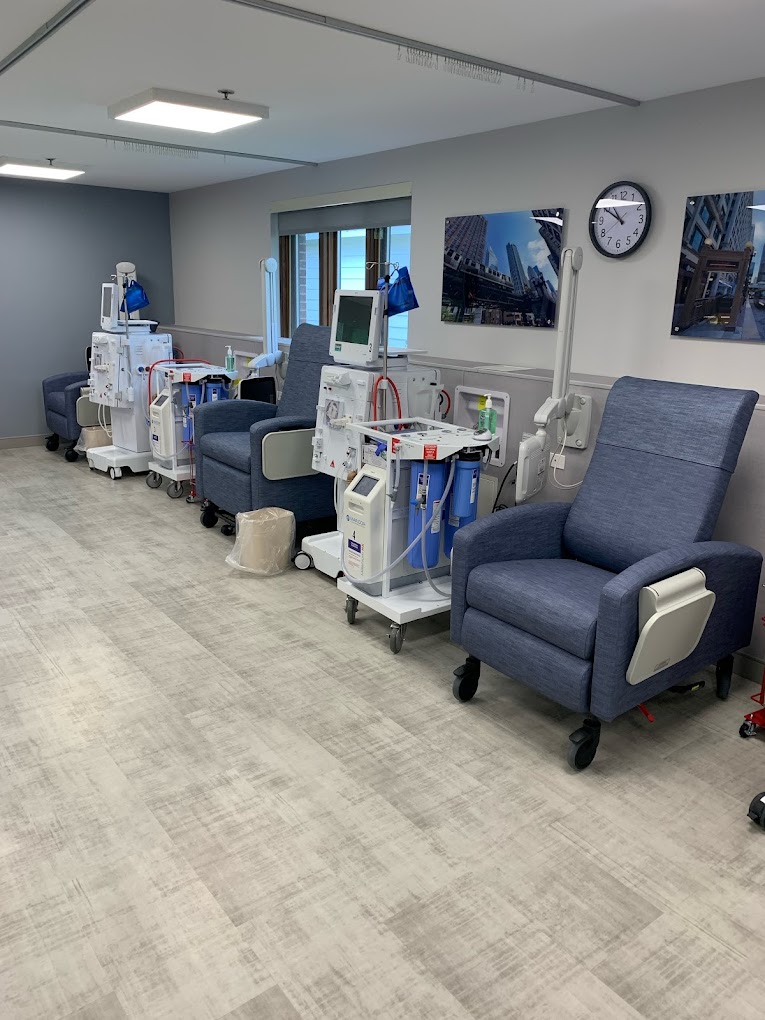
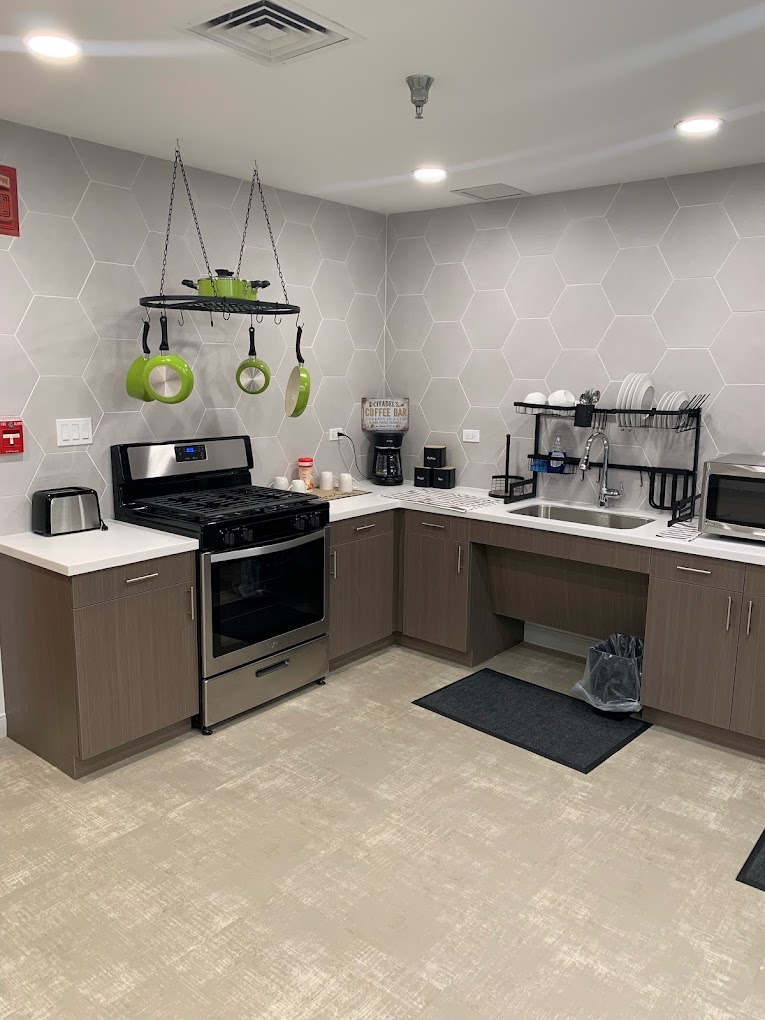
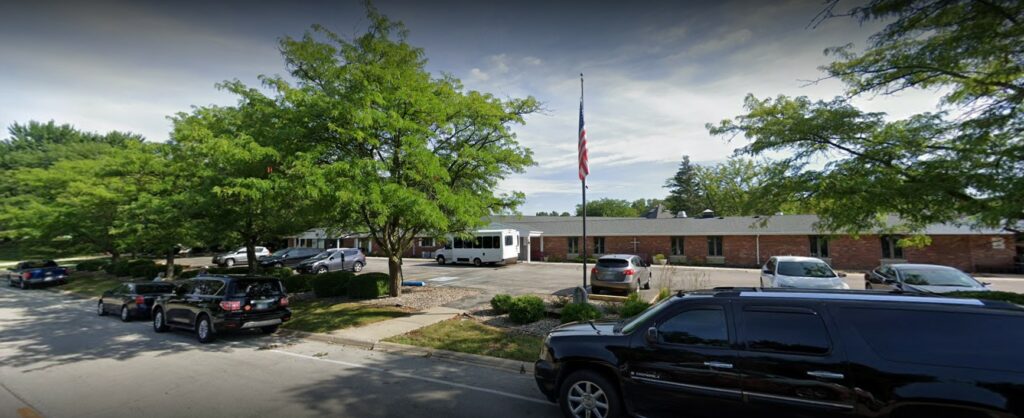
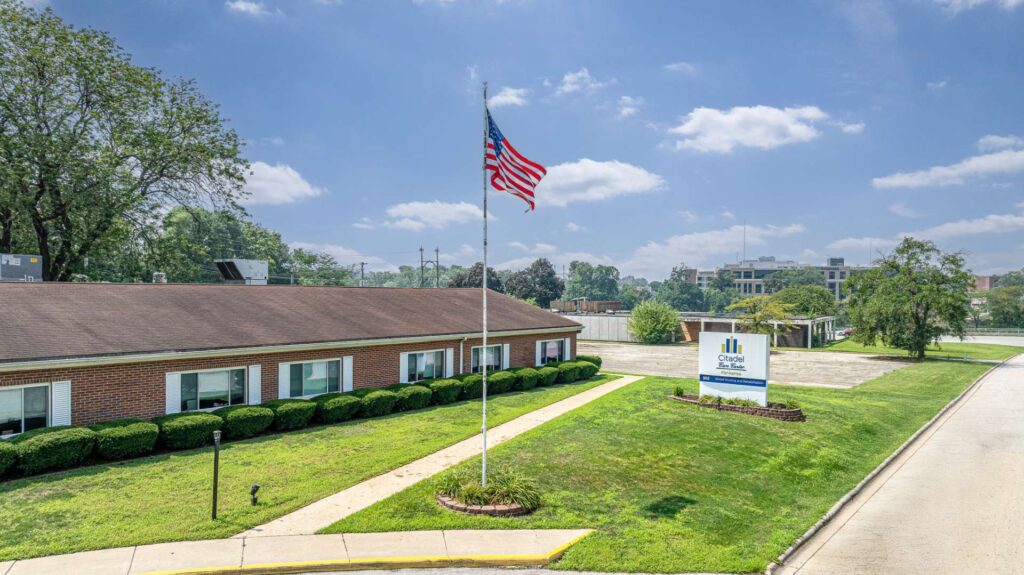
Based in a welcoming area in Bourbonnais, IL, Citadel of Bourbonnais is a reliable senior care provider, offering skilled nursing, therapy, and rehabilitation services. The community also offers other services, such as hospice care, palliative care, long-term care, and respite stays, preventing residents’ need to transfer for other care needs. Residents are offered an array of private semi-private suites to give them a comfortable healing environment that fosters quick recovery.

With 24-hour nursing care, residents can rest easy and comfortably focus on their well-being knowing that someone is always available to cater to their needs and emergencies. Residents are also offered the convenience of having housekeeping, laundry, and linen services, lessening their stress and worries further. Full-service dining options are available as well to complete residents’ experience, making sure they stay nourished and healthy throughout their recovery journey.

(847) 462-0885

Quality ratings

Measured by Centers for Medicare & Medicaid Services (CMS)

Overall rating Info The Overall CMS Rating combines results from health inspections, staffing levels and quality measures. Health inspections carry the most weight. Staffing and quality scores can increase or decrease the final rating based on performance compared to state and national standards.
4/5
Illinois average: 2.5/5
Health Inspection Info Based on the results of the facility's three most recent standard inspections and any complaint investigations. CMS reviews the number, scope, and severity of deficiencies, with more recent findings weighted more heavily.
4/5
Illinois average: 2.8/5
Staffing Info Measures average nursing staff hours per resident per day, including Registered Nurses (RNs) and total nursing staff. Ratings are adjusted based on the level of care residents require and are compared to state and national benchmarks.
2/5
Illinois average: 2.1/5
Quality Measures Info Based on clinical and physical health indicators reported to CMS, such as hospital readmissions, falls, pressure ulcers, and improvements in mobility. These measures reflect how well residents' health needs are being managed.
2/5
Illinois average: 2.8/5

Nursing care per resident

Info This shows how many total hours of nursing staff time are available per resident each day. Higher numbers usually mean more staff support.
2h 34m per day

This home provides 17% less nursing time per resident than the Illinois average.

Illinois average: 3h 6m per day

Staffing hours breakdown

Info Hours of care per resident per day, broken down by staff type. Data from CMS Medicare.
Staff type Facility State avg National avg
Registered Nurse (RN) Info Registered nurse hours per resident per day. 46m per day 44m per day 41m per day
Nurse Aide Info Nurse aide hours per resident per day. 1h 57m per day 2h 8m per day 2h 21m per day
Total Nursing (Weekend) Info Total number of nurse staff hours per resident per day on weekends. 3h 1m per day 3h 5m per day 3h 26m per day
Physical Therapist Info Physical therapist staff hours per resident per day. 3m per day 3m per day 4m per day
RN (Weekend) Info Registered nurse hours per resident per day on weekends. 35m per day 34m per day 29m per day

Capacity and availability

Medium-capacity home

Offers a balance of services and community atmosphere.

Total beds 107

This home usually has availability

Lower occupancy suggests more openings may be available.

Lower demand than the Illinois average
Occupancy rate 84.2%
Residents per day (avg) 95
Occupancy rate
84.2%
Residents per day (avg)
95

Who this home usually serves

TYPE OF STAY

Mostly short-term rehab stays

Most residents typically stay for a few weeks or months before returning home or moving on.

Might be optimal for
Short stays Recovery Medicare-covered care

Breakdown by payment type

Medicare

72% of new residents, usually for short-term rehab.

Typical stay 16 days

Private pay

24% of new residents, often for short stays.

Typical stay 10 months

Medicaid

4% of new residents, often for long-term daily care.

Typical stay 1 - 2 years

Finances and operations

Privately-owned community
Home revenue
$16.1M
Profit
$648.8K
Privately-owned community
Home revenue
$16,096,464.00
Profit
$648,771.00
Payroll costs Info The portion of the home's budget spent on staff, including nurses, caregivers, and other employees who support care and operations.
$4.6M
28.6% of revenue
Other operating costs Info All remaining costs needed to run the home, such as food, utilities, building maintenance, supplies and administrative expenses.
$10.8M
Total costs $15.4M

What does this home offer?

Accepts Medicaid icon

Accept Medicaid: Yes

Total residents icon

Total Residents: 107

Building type icon
Building type icon

Building Type: Single-story

Types of Care at Citadel of Bourbonnais

Nursing Home
Contact Citadel of Bourbonnais

Health Inspection History

Inspections
Total health inspections 6

Illinois average 10.4


Last Health inspection on Oct 2025

Total health citations 22

Illinois average 36.8

Citations per inspection
3.67

Illinois average 3.68


Health citations are formal notices following inspections when they fail to comply with safety and care standards.

19 of 22 citations resulted from standard inspections; and 3 of 22 resulted from complaint investigations.

Breakdown of citation severity (last 3 years)
Critical Health citations More info 0
100% better than Illinois average

Illinois average: 0.7


Serious Health citations More info 2
44% better than Illinois average

Illinois average: 3.6

0 critical citations More info Illinois average: 0.7

2 serious citations More info Illinois average: 3.6

19 moderate citations More info Illinois average: 32

1 minor citation More info Illinois average: 0.5
Citations history (last 3 years)
Quality of Care serious citation Info Issues related to how well residents receive appropriate treatment and support for their medical and daily care needs. Oct 07, 2025
Corrected

Infection Control moderate citation Info Issues related to preventing and controlling infections, including hygiene practices and safety protocols. Sep 27, 2024
Corrected

Nursing Services minor citation Info Issues related to the availability and quality of nursing staff and the care they provide. Sep 27, 2024
Corrected

Nutrition moderate citation Info Issues related to food quality, meal service, and resident's nutritional needs. Sep 27, 2024
Corrected

Compare Nursing Homes around Bourbonnais The information below is reported by the Illinois Department of Public Health, Office of Health Care Regulation.

3 facilities compared · CMS & IL Dept. of Health data · Updated Apr 2026

Filter by care type
Citadel of Bourbonnais
AL

Assisted Living A licensed, long-term care setting for seniors or individuals with disabilities who need help with daily activities — like bathing, dressing, and medication management — but not 24-hour skilled nursing. Offers housing, meals, and around-the-clock support while aiming to maximize resident independence.

IL

Independent Living Lifestyle-focused communities for older adults offering dining, activities, and transportation with minimal personal care. Best for active, independent seniors who want community without medical support.

MC

Memory Care Secured, specialized care for people living with Alzheimer's or dementia. Staff trained in cognitive impairment, with higher staff-to-resident ratios and an environment designed to reduce confusion and wandering risk.

NH

Nursing Home Licensed facility providing 24/7 skilled nursing care for residents with complex, ongoing medical needs. Staffed by RNs, LPNs, and CNAs. Inspected and star-rated annually by CMS. Accepts Medicare (short-term rehab) and Medicaid (long-term care).

Bourbonnais
107
84.2%
+22%
2.56
-32%
-17%
1
22
3.7
2
95
46
Berger Family Trust U/A/D 06/25/14
$15.7M
$4.6M
29.4%
145536
-
Citadel of Kankakee
-
HC

Home Care Professional care delivered in the person's own home — from companionship and errands to skilled nursing and therapy. Allows seniors to age in place. Medicare covers skilled home health when medically necessary.

MC

Memory Care Secured, specialized care for people living with Alzheimer's or dementia. Staff trained in cognitive impairment, with higher staff-to-resident ratios and an environment designed to reduce confusion and wandering risk.

NH

Nursing Home Licensed facility providing 24/7 skilled nursing care for residents with complex, ongoing medical needs. Staffed by RNs, LPNs, and CNAs. Inspected and star-rated annually by CMS. Accepts Medicare (short-term rehab) and Medicaid (long-term care).

RC

Respite Care Short-term temporary care — days to weeks — to give family caregivers a break. Full care provided during the stay. Often used after hospitalization or to trial a facility before a permanent placement decision.

Kankakee
-
-
-
-
-
-
-
-
-
0
0
0.0
0
-
-
-
-
-
-
-
Private/Semi-Private Rooms
The Arc at Bradley
-
MC

Memory Care Secured, specialized care for people living with Alzheimer's or dementia. Staff trained in cognitive impairment, with higher staff-to-resident ratios and an environment designed to reduce confusion and wandering risk.

NH

Nursing Home Licensed facility providing 24/7 skilled nursing care for residents with complex, ongoing medical needs. Staffed by RNs, LPNs, and CNAs. Inspected and star-rated annually by CMS. Accepts Medicare (short-term rehab) and Medicaid (long-term care).

RC

Respite Care Short-term temporary care — days to weeks — to give family caregivers a break. Full care provided during the stay. Often used after hospitalization or to trial a facility before a permanent placement decision.

Bradley
-
-
-
-
-
-
-
-
-
0
0
0.0
0
-
-
-
-
-
-
-
Private Rooms

Places of interest near Citadel of Bourbonnais

Address 2.5 miles from city center

Address 20 Briarcliff Ln, Bourbonnais, IL 60914

Calculate Travel Distance to Citadel of Bourbonnais

Add your location

Address

Staffing Data (Q2 2025)

This data corresponds to Q2 2025 and is based on CMS Payroll-Based Journal.

Total staff 211
Employees 102
Contractors 109
Staff to resident ratio 2.34:1
23% better than Illinois average

Illinois average ratio: 1.90:1

Avg staff/day 45
Average shift 8.4 hours
11% better than Illinois average

Illinois average: 7.6 hours

Total staff hours (quarter) 34,478
Nursing staff breakdown
Registered Nurse

Manages medical care and health needs.

Total count 20
Average shift length Info Average shift length. Calculated as total hours divided by days worked and average staff per day. 9.4 hours

This role is partially covered by contractors.

Licensed Practical Nurse

Assists with medical care and medications.

Total count 37
Average shift length Info Average shift length. Calculated as total hours divided by days worked and average staff per day. 9 hours

This role is partially covered by contractors.

Certified Nursing Assistant

Helps with daily care and mobility.

Total count 125
Average shift length Info Average shift length. Calculated as total hours divided by days worked and average staff per day. 8.8 hours

This role is partially covered by contractors.

Contractor staffing

Total hours from contractors

20.1%

6,918 contractor hours this quarter

Certified Nursing Assistant: 74 Licensed Practical Nurse: 18 Occupational Therapy Assistant: 5 Physical Therapy Aide: 3 Physical Therapy Assistant: 2 Speech Language Pathologist: 2 Respiratory Therapy Technician: 2 Registered Nurse: 1 Qualified Social Worker: 1 Medical Director: 1
Staff by category
Certified Nursing Assistant517412516,88491100%8.8
Licensed Practical Nurse1918375,96191100%9
Registered Nurse191205,22591100%9.4
Speech Language Pathologist0229246571%7.3
Clinical Nurse Specialist3037986066%8
Other Dietary Services Staff4047408998%7.1
Administrator1014966268%8
Physical Therapy Aide0334576673%6.2
RN Director of Nursing1014325459%8
Dental Services Staff1014325459%8
Occupational Therapy Aide1014165257%8
Respiratory Therapy Technician0224106571%6.3
Dietitian1014085156%8
Physical Therapy Assistant0223617481%4.9
Nurse Practitioner1012202831%7.8
Qualified Social Worker0112135055%4.3
Occupational Therapy Assistant055534044%1.1
Medical Director01150910%5.6
125 Certified Nursing Assistant
% of Days 100%
37 Licensed Practical Nurse
% of Days 100%
20 Registered Nurse
% of Days 100%
2 Speech Language Pathologist
% of Days 71%
3 Clinical Nurse Specialist
% of Days 66%
4 Other Dietary Services Staff
% of Days 98%
1 Administrator
% of Days 68%
3 Physical Therapy Aide
% of Days 73%
1 RN Director of Nursing
% of Days 59%
1 Dental Services Staff
% of Days 59%
1 Occupational Therapy Aide
% of Days 57%
2 Respiratory Therapy Technician
% of Days 71%
1 Dietitian
% of Days 56%
2 Physical Therapy Assistant
% of Days 81%
1 Nurse Practitioner
% of Days 31%
1 Qualified Social Worker
% of Days 55%
5 Occupational Therapy Assistant
% of Days 44%
1 Medical Director
% of Days 10%

Facility Characteristics

Source: CMS Long-Term Care Facility Characteristics (Data as of Jan 2026)

Total census
90 residents
Residents by payment source
Medicare
14 residents (15.6%)
Medicaid
66 residents (73.3%)
Private pay or other
10 residents (11.1%)
Programs & Services
Residents' Group

Residents meet regularly to discuss policies, care quality, and activities

Active Resident Council

Organized group of residents that meets regularly to discuss facility policies, quality of life, and activities.

Quality of care over time

These measures show how residents usually do over time at this home, based on health outcomes and preventive care.

High-risk clinical events score Info A composite score based on pressure ulcers, falls with injury, weight loss, walking ability decline, and activities of daily living decline. 6.7
31% better than Illinois average

Illinois average: 9.7

Functional decline score Info A composite score based on activities of daily living decline, walking ability decline, and incontinence. 12.3
34% better than Illinois average

Illinois average: 18.6

Long-stay resident measures
Above average Illinois avg: 3.6 Info CMS star rating based on long-stay quality measure performance. 5 stars = significantly above average, 1 star = significantly below average.
Need for Help with Daily Activities Increased Info Percent of long-stay residents whose need for help with daily activities has increased 4.0%
74% better than Illinois average

Illinois average: 15.5%

Walking Ability Worsened Info Percent of long-stay residents whose ability to move independently worsened 7.8%
58% better than Illinois average

Illinois average: 18.4%

Low Risk Residents with Bowel/Bladder Incontinence Info Percent of low risk long-stay residents who lose control of their bowels or bladder 25.2%
17% worse than Illinois average

Illinois average: 21.6%

Falls with Major Injury Info Percent of long-stay residents experiencing one or more falls with major injury 3.8%
12% worse than Illinois average

Illinois average: 3.4%

High Risk Residents with Pressure Ulcers Info Percent of long-stay high risk residents with pressure ulcers 5.7%
7% worse than Illinois average

Illinois average: 5.3%

Urinary Tract Infection Info Percent of long-stay residents with a urinary tract infection 0.0%
100% better than Illinois average

Illinois average: 1.8%

Lost Too Much Weight Info Percent of long-stay residents who lose too much weight 12.5%
91% worse than Illinois average

Illinois average: 6.5%

Depressive Symptoms Info Percent of long-stay residents who have depressive symptoms 98.7%
105% worse than Illinois average

Illinois average: 48.1%

Antipsychotic Use Info Percent of long-stay residents who received an antipsychotic medication 19.4%
In line with Illinois average

Illinois average: 20.2%

Pneumococcal Vaccine Info Percent of long-stay residents assessed and appropriately given the pneumococcal vaccine 80.0%
10% worse than Illinois average

Illinois average: 89.2%

Influenza Vaccine Info Percent of long-stay residents assessed and appropriately given the seasonal influenza vaccine 90.5%
In line with Illinois average

Illinois average: 91.6%

Hospitalizations per 1,000 days Info Number of hospitalizations per 1,000 long-stay resident days. 2.24
9% worse than Illinois average

Illinois average: 2.05

ED visits per 1,000 days Info Number of outpatient emergency department visits per 1,000 long-stay resident days. 2.01
11% better than Illinois average

Illinois average: 2.25

Short-stay resident measures
Significantly below average Illinois avg: 2.0 Info CMS star rating based on short-stay quality measure performance. 5 stars = much above average, 1 star = much below average.
Pneumococcal Vaccine Info Percent of short-stay residents assessed and appropriately given the pneumococcal vaccine 54.3%
21% worse than Illinois average

Illinois average: 68.3%

Antipsychotic medication increase Info Percent of short-stay residents who newly received an antipsychotic medication 0.8%
67% better than Illinois average

Illinois average: 2.3%

Influenza Vaccine Info Percent of short-stay residents assessed and appropriately given the seasonal influenza vaccine 56.3%
11% worse than Illinois average

Illinois average: 63.0%

Re-hospitalized after SNF stay Info Percentage of short-stay residents who were re-hospitalized after their nursing home admission. 36.1%
38% worse than Illinois average

Illinois average: 26.2%

Emergency department visits Info Percentage of short-stay residents who had an outpatient emergency department visit. 16.3%
16% worse than Illinois average

Illinois average: 14.0%

Falls with major injury Info Percentage of SNF residents who experience falls with major injury during their stay. 0.0%
100% better than Illinois average

Illinois average: 0.8%

Ability to care for self at discharge Info Percentage of residents at or above expected ability to care for themselves at discharge. 9.9%
82% worse than Illinois average

Illinois average: 53.7%

Successful return to home or community Info Rate of successful return to home or community from a skilled nursing facility. 43.9%
13% worse than Illinois average

Illinois average: 50.6%

Guides for Better Senior Living

Care Cost Calculator: See Prices in Your Area

Nursing Home Data Explorer

Don’t Wait Too Long: 7 Red Flag Signs Your Parent Needs Assisted Living Now

The True Cost of Assisted Living in 2025 – And How Families Are Paying For It

Understanding Senior Living Costs: Pricing Models, Discounts & Financial Assistance

Financial Aid for Illinois Seniors

Get financial aid guidance

Community Care Program

Illinois CCP

Age 60+, Illinois resident, at risk of nursing home placement.

~$1,215/month (individual).

$17,500 (individual, excludes home, car).

High demand in urban areas; waitlists possible.

Illinois Respite Program

IL Respite (via NFCSP)

Caregiver of someone 60+ (or with dementia), Illinois resident.

No strict limit; prioritizes low-income.

Not applicable.

Limited slots; urban/rural balance.

Supportive Living Program (SLP)

Illinois Medicaid Supportive Living Program

Age 65+ or 22-64 with disability, Illinois resident, Medicaid-eligible, needs moderate assistance (not nursing home-level).

~$2,829/month (300% FBR, individual); QIT allowed.

$2,000 (individual), $3,000 (couple) (excludes home, car).

~200 SLP sites statewide; room/board not covered.

Persons Who Are Elderly Waiver

Illinois Medicaid Elderly Waiver

Age 65+, Illinois resident, Medicaid-eligible, nursing home-level care need.

~$2,829/month (300% FBR, individual).

$2,000 (individual), $3,000 (couple).

Part of HealthChoice Illinois; consumer-directed options available.

Medicare Savings Program (MSP)

Illinois Medicare Savings Program

Age 65+ or disabled, Illinois resident, Medicare Part A/B.

~$2,510/month (QMB), ~$3,380/month (SLMB), ~$3,598/month (QI)—individual.

$9,430 (individual), $14,130 (couple).

Three tiers; no waitlist.

Senior Community Service Employment Program (SCSEP)

Illinois SCSEP

Age 55+, unemployed, low-income, Illinois resident.

~$1,983/month (125% FPL).

Not specified; income-focused.

Priority for veterans, rural residents.

Optional State Supplementation (OSS)

Illinois Optional State Supplementation

Age 65+ or disabled, Illinois resident, in approved facility, SSI recipient or low-income.

~$1,004/month (including SSI).

$2,000 (individual), $3,000 (couple).

~$50-$500/month based on facility type.

VA Aid and Attendance (A&A) and Housebound Benefits

Illinois VA Aid and Attendance/Housebound

Age 65+ or disabled veteran/spouse, Illinois resident, wartime service, need for ADL help (A&A) or homebound.

Net income < ~$1,984/month (veteran with dependent, A&A); pension offsets income.

~$155,356 (net worth limit).

High veteran demand in urban/rural areas.

Tour Icon
Planning a tour? Check our touring checklist.
Chat Icon
Thinking of living here? We can help you speak to a current resident