


Total staff
194
Employees
174
Contractors
20
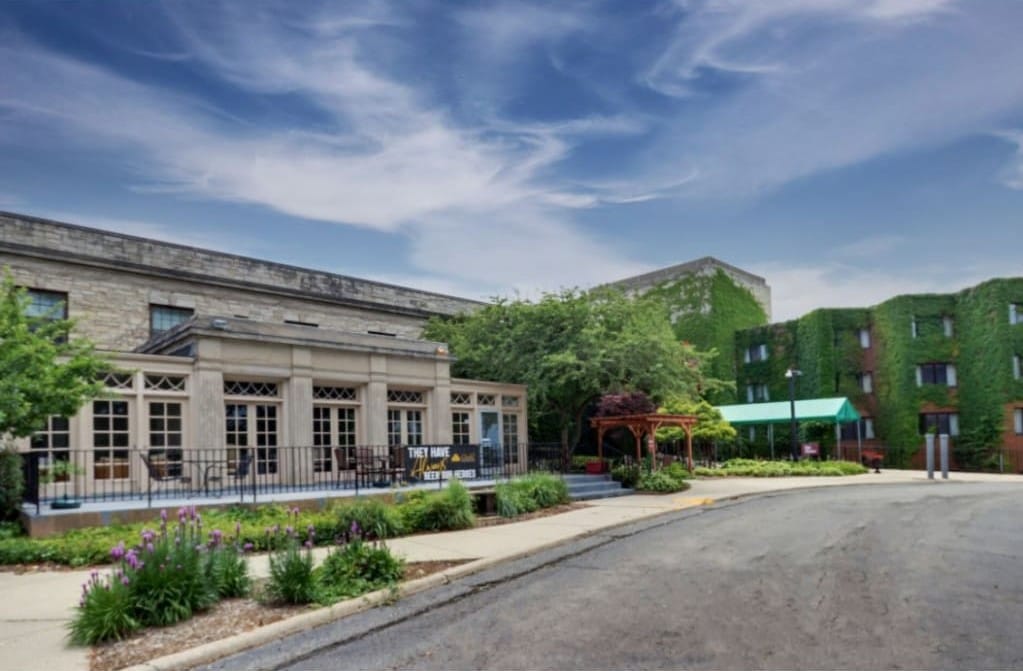


Citadel PA Peterson operates as a 158-bed skilled nursing facility at 1311 Parkview Ave in Rockford, Illinois, serving residents in Winnebago County. The community is privately owned and CMS-certified, offering independent living, assisted living, and skilled nursing tracks. It accepts Medicare, Medicaid, and private pay admissions.
The facility sits approximately 3.3 miles from downtown Rockford and 1.39 miles from UW Health SwedishAmerican Hospital.
CMS ratings underscore significant performance gaps.
Overall rating is 1-star, 60.3% below Illinois average. Health inspection, staffing, and quality measures all earned 1-star ratings, with staffing deficiency most pronounced at 53.2% below state average.
Nursing hours run 2h 42m per resident per day, below the Illinois average of 3h 6m. A $21,000 CMS federal fine in July 2024 reflects regulatory violations. Staff-to-resident ratio is 1.60:1, 11% worse than the Illinois average. Payroll comprises 34.5% of revenue, significantly below the well-run facility benchmark of 54–67%.
Long-stay quality outcomes present a stark picture. Functional decline occurs in a composite measure at 28.8, 55% worse than Illinois average.
Of particular concern: 95.4% of long-stay residents report depressive symptoms; 98% worse than the state average of 48.1%.
Pressure ulcers in high-risk residents reach 10.4% (97% worse than state average). Unintended weight loss affects 13.0% of residents (99% worse). Walking ability declines in 33.8% of long-stay residents (84% worse).
Despite these systemic weaknesses, the facility operates specialized rehabilitation programs for stroke recovery, pulmonary care, cardiac recovery, and orthopedic rehabilitation. Services include dialysis, palliative care, and hospice.
Amenities encompass full-service dining, gardens and courtyards, activity areas, iPad and laptop access, and pet therapy.
Occupancy at 85.5% (rank #57/199 Illinois) reflects demand, yet current census composition is heavily Medicaid (71.1% long-stay) against admission patterns favoring Medicare short-stay (76% of admissions).
Short-stay post-acute rehabilitation outcomes perform modestly better. Re-hospitalization and emergency department visit rates run 8–36% better than the state average. However, long-stay residents dominate facility composition and outcomes.
Citadel PA Peterson functions as a post-acute short-term rehabilitation facility, with clear acknowledgment that 1-star status and long-stay resident outcome deterioration present significant placement considerations.
| Staff type | Hours / Day / Resident | vs state avg |
|---|---|---|
|
Registered Nurse (RN)
| 36m per day | ▼ 17% State avg: 44m per day · National avg: 41m per day |
|
LPN / LVN
| 47m per day | ▲ 24% State avg: 38m per day · National avg: 52m per day |
|
Nurse Aide
| 2h 12m per day | ▲ 3% State avg: 2h 8m per day · National avg: 2h 21m per day |
|
Weekend Total Nursing
| 3h 22m per day | ▲ 9% State avg: 3h 5m per day · National avg: 3h 26m per day |
|
Physical Therapist
| 4m per day | ▲ 20% State avg: 3m per day · National avg: 4m per day |
|
Weekend RN
| 23m per day | ▼ 32% State avg: 34m per day · National avg: 29m per day |
Reporting period: October 1 – December 31, 2025 (Q4 2025). Source: CMS Payroll-Based Journal report.
Manages medical care and health needs.
Assists with medical care and medications.
Helps with daily care and mobility.
Total hours from contractors
3,955 contractor hours this quarter
| Certified Nursing Assistant | 114 | 0 | 114 | 25,062 | 92 | 100% | 7.1 |
| Licensed Practical Nurse | 29 | 0 | 29 | 8,964 | 92 | 100% | 8.7 |
| Registered Nurse | 19 | 2 | 21 | 5,997 | 92 | 100% | 9.1 |
| Other Dietary Services Staff | 5 | 0 | 5 | 1,181 | 91 | 99% | 7.3 |
| Dental Services Staff | 3 | 0 | 3 | 1,160 | 69 | 75% | 6.6 |
| Speech Language Pathologist | 0 | 3 | 3 | 999 | 66 | 72% | 7.1 |
| Physical Therapy Aide | 0 | 4 | 4 | 888 | 77 | 84% | 6.9 |
| Respiratory Therapy Technician | 0 | 3 | 3 | 686 | 92 | 100% | 5.1 |
| Dietitian | 1 | 0 | 1 | 488 | 61 | 66% | 8 |
| Nurse Practitioner | 1 | 0 | 1 | 463 | 59 | 64% | 7.8 |
| Administrator | 1 | 0 | 1 | 456 | 57 | 62% | 8 |
| Clinical Nurse Specialist | 1 | 0 | 1 | 441 | 56 | 61% | 7.9 |
| Qualified Social Worker | 0 | 2 | 2 | 418 | 62 | 67% | 6.1 |
| Physical Therapy Assistant | 0 | 4 | 4 | 385 | 61 | 66% | 5.8 |
| Medical Director | 0 | 2 | 2 | 157 | 20 | 22% | 7.9 |
Includes penalties issued in 2024
Federal penalties imposed by CMS for regulatory violations, including civil money penalties (fines) and denials of payment for new Medicare/Medicaid admissions.
Source: CMS Penalties Database (Data as of Jan 2026)
Illinois average: $143K
Illinois average: 3.0
Illinois average: 1.1
Penalties are imposed by CMS for violations of federal nursing home regulations.
1 penalty in the past 3 years
Jul 10, 2024 · $21K
Last updated: Jan 2026
These measures show how residents usually do over time at this home, based on health outcomes and preventive care.
Illinois average: 9.7
Illinois average: 18.6
Illinois average: 15.5%
Illinois average: 18.4%
Illinois average: 21.6%
Illinois average: 3.4%
Illinois average: 5.3%
Illinois average: 1.8%
Illinois average: 6.5%
Illinois average: 48.1%
Illinois average: 20.2%
Illinois average: 89.2%
Illinois average: 91.6%
Illinois average: 2.05
Illinois average: 2.25
Illinois average: 68.3%
Illinois average: 2.3%
Illinois average: 63.0%
Illinois average: 26.2%
Illinois average: 14.0%
Illinois average: 0.8%
Illinois average: 53.7%
Illinois average: 50.6%
Quality measures are calculated from Minimum Data Set (MDS) assessments. For most measures, lower percentages indicate better care quality.
76% of new residents, usually for short-term rehab.
19% of new residents, often for short stays.
5% of new residents, often for long-term daily care.
Source: CMS Long-Term Care Facility Characteristics (Data as of Jan 2026)
Residents meet regularly to discuss policies, care quality, and activities
Part of a Continuing Care Retirement Community offering multiple care levels
Organized group of residents that meets regularly to discuss facility policies, quality of life, and activities.
Data sourced from CMS Long-Term Care Facility Characteristics quarterly report. Payer mix reflects the current resident census by primary payment source.
Historical financial and operational data for Citadel PA Peterson from 2012–2023, based on CMS SNF Cost Reports.
Key figures below are for fiscal year ending in 12/2023.
Based on CMS SNF Cost Report for fiscal year ending in 12/2023.
No pets allowed
Housing Options: Studio / 1 Bed
Building Type: Two-story
Fitness and Recreation
Most residents typically stay for a few weeks or months before returning home or moving on.
Most new residents arrive under Medicare (76% of admissions), and a typical Medicare stay runs around 13 days.
Coverage residents most often arrive under.
Coverage residents most often leave under.
![]() 1.8 miles from city center
1.8 miles from city center
![]() Estimated distance in miles from Rockford's city center to Citadel PA Peterson's address, calculated via Google Maps.
— 1.39 miles to nearest hospital (UW Health SwedishAmerican Hospital)
Estimated distance in miles from Rockford's city center to Citadel PA Peterson's address, calculated via Google Maps.
— 1.39 miles to nearest hospital (UW Health SwedishAmerican Hospital)
Add your location
Info below is compiled from CMS reports & the IL Dept. of Public Health (IDPH), senior community websites & trusted data sources such as Walk Score & BBB.
Communities are listed from highest to lowest based on our ranking methodology.
| Amberwood Care Centre | NH HOS MC PC RC SNF | Rockford (North Rockton Avenue) | 135
Facility
135
IL AVG
85
Rank
#61 / 419 |
92.7%
Facility
92.7%
IL AVG
73
Rank
#21 / 157 | +27% | 2.61
Facility
2.61
IL AVG
3.10
Rank
#109 / 155 | -40% | -16% | $0
Facility
$0
IL AVG
$151.3k
Rank
#1 / 155 | 43
Facility
43
IL AVG
36.8
Rank
#108 / 155 | 3.1
Facility
3.1
IL AVG
3.7
Rank
#49 / 155 | - | 125 | - |
47
Facility
47
IL AVG
51
Rank
#356 / 648 | Todd Stern 2015 Trust | $12.8MFiscal year ending 12/2023
Facility
$12.8MFiscal year ending 12/2023
IL AVG
$12.2M
Rank
#85 / 154 | $6.8MFiscal year ending 12/2023
Facility
$6.8MFiscal year ending 12/2023
IL AVG
$4.8M
Rank
#82 / 154 | 53.2%Fiscal year ending 12/2023
Facility
53.2%Fiscal year ending 12/2023
IL AVG
44.3%
Rank
#71 / 154 | 145908 | ||||
| River Bluff Nursing Home | NH HOS MC PC SNF | Rockford (Ruby) | 304
Facility
304
IL AVG
85
Rank
#1 / 419 |
49.9%
Facility
49.9%
IL AVG
73
Rank
#141 / 157 | -32% | 4.13
Facility
4.13
IL AVG
3.10
Rank
#39 / 155 | -33% | +33% | $10.2k
Facility
$10.2k
IL AVG
$151.3k
Rank
#70 / 155 | 30
Facility
30
IL AVG
36.8
Rank
#73 / 155 | 3.0
Facility
3.0
IL AVG
3.7
Rank
#40 / 155 | 2 | 152 | - |
33
Facility
33
IL AVG
51
Rank
#470 / 648 | County Of Winnebago | $12.7MFiscal year ending 09/2023
Facility
$12.7MFiscal year ending 09/2023
IL AVG
$12.2M
Rank
#58 / 154 | $9.3MFiscal year ending 09/2023
Facility
$9.3MFiscal year ending 09/2023
IL AVG
$4.8M
Rank
#11 / 154 | 72.7%Fiscal year ending 09/2023
Facility
72.7%Fiscal year ending 09/2023
IL AVG
44.3%
Rank
#6 / 154 | 145771 | ||||
| Alden Park Strathmoor | NH HOS MC RC SNF | Rockford (Strathmoor Drive) | 189
Facility
189
IL AVG
85
Rank
#33 / 419 |
77.9%
Facility
77.9%
IL AVG
73
Rank
#76 / 157 | +7% | 2.48
Facility
2.48
IL AVG
3.10
Rank
#122 / 155 | +18% | -20% | $115.3k
Facility
$115.3k
IL AVG
$151.3k
Rank
#119 / 155 | 28
Facility
28
IL AVG
36.8
Rank
#65 / 155 | 3.5
Facility
3.5
IL AVG
3.7
Rank
#72 / 155 | 4 | 147 | - |
33
Facility
33
IL AVG
51
Rank
#470 / 648 | Nikolina Kuljanin | $14.9MFiscal year ending 12/2023
Facility
$14.9MFiscal year ending 12/2023
IL AVG
$12.2M
Rank
#78 / 154 | $6.9MFiscal year ending 12/2023
Facility
$6.9MFiscal year ending 12/2023
IL AVG
$4.8M
Rank
#85 / 154 | 46.5%Fiscal year ending 12/2023
Facility
46.5%Fiscal year ending 12/2023
IL AVG
44.3%
Rank
#82 / 154 | 145259 | ||||
| Citadel PA Peterson | NH HOS MC PC RC SNF | Rockford | 129
Facility
129
IL AVG
85
Rank
#68 / 419 |
96.1%
Facility
96.1%
IL AVG
73
Rank
#8 / 157 | +32% | 2.70
Facility
2.70
IL AVG
3.10
Rank
#98 / 155 | -24% | -13% | $21.2k
Facility
$21.2k
IL AVG
$151.3k
Rank
#80 / 155 | 63
Facility
63
IL AVG
36.8
Rank
#135 / 155 | 2.6
Facility
2.6
IL AVG
3.7
Rank
#25 / 155 | 4 | 124 | - |
31
Facility
31
IL AVG
51
Rank
#487 / 648 | - | $14.4MFiscal year ending 12/2023
Facility
$14.4MFiscal year ending 12/2023
IL AVG
$12.2M
Rank
#46 / 154 | $7.1MFiscal year ending 12/2023
Facility
$7.1MFiscal year ending 12/2023
IL AVG
$4.8M
Rank
#73 / 154 | 49.2%Fiscal year ending 12/2023
Facility
49.2%Fiscal year ending 12/2023
IL AVG
44.3%
Rank
#131 / 154 | 145751 | ||||
| Rock River Healthcare | NH HOS MC RC SNF | Rockford (West Riverside Boulevard) | 130
Facility
130
IL AVG
85
Rank
#67 / 419 |
56.9%
Facility
56.9%
IL AVG
73
Rank
#135 / 157 | -22% | 2.01
Facility
2.01
IL AVG
3.10
Rank
#144 / 155 | +9% | -35% | $72.3k
Facility
$72.3k
IL AVG
$151.3k
Rank
#112 / 155 | 44
Facility
44
IL AVG
36.8
Rank
#111 / 155 | 2.4
Facility
2.4
IL AVG
3.7
Rank
#20 / 155 | 4 | 74 | - |
60
Facility
60
IL AVG
51
Rank
#233 / 648 | Smf Healthcare LLC | $6.3MFiscal year ending 12/2023
Facility
$6.3MFiscal year ending 12/2023
IL AVG
$12.2M
Rank
#144 / 154 | $3.0MFiscal year ending 12/2023
Facility
$3.0MFiscal year ending 12/2023
IL AVG
$4.8M
Rank
#147 / 154 | 47.8%Fiscal year ending 12/2023
Facility
47.8%Fiscal year ending 12/2023
IL AVG
44.3%
Rank
#67 / 154 | 145818 |
Citadel PA Peterson is located in Rockford, Illinois.
Here are the financial assistance programs available to residents in Illinois.
Citadel PA Peterson has a walk score of 31. Somewhat walkable. A few nearby services may be reachable on foot, but most trips require transportation.
Citadel PA Peterson's occupancy is 85.5%.
No, Citadel PA Peterson has a no-pet policy.
Citadel PA Peterson is registered as a for-profit.
Yes — there are 5 photos of Citadel PA Peterson in the photo gallery on this page.
Citadel PA Peterson is located at 1311 Parkview Ave, Rockford, IL 61107.
(815) 399-8832 will put you in contact with the team at Citadel PA Peterson.
Care Cost Calculator: See Prices in Your Area
Nursing Home Data Explorer
Don’t Wait Too Long: 7 Red Flag Signs Your Parent Needs Assisted Living Now
The True Cost of Assisted Living in 2025 – And How Families Are Paying For It
Understanding Senior Living Costs: Pricing Models, Discounts & Financial Assistance


