CityView Healthcare & Rehabilitation
Nursing Home, Hospice Care, Memory Care & Palliative Care · Cleveland, OH
CMS overall rating Info CMS (the Centers for Medicare & Medicaid Services) is the federal agency that rates nursing home quality. Its Overall Rating runs from 1 to 5 stars, combining health inspections, staffing, and quality measures, with inspections weighted most heavily.

CityView Healthcare & Rehabilitation

Nursing Home, Hospice Care, Memory Care & Palliative Care · Cleveland, OH
CMS overall rating Info CMS (the Centers for Medicare & Medicaid Services) is the federal agency that rates nursing home quality. Its Overall Rating runs from 1 to 5 stars, combining health inspections, staffing, and quality measures, with inspections weighted most heavily.
Calculator: See prices in your area
CityView Healthcare & Rehabilitation accepts Medicare, Medicaid, and private pay.

Overview of Cityview Healthcare & Rehabilitation

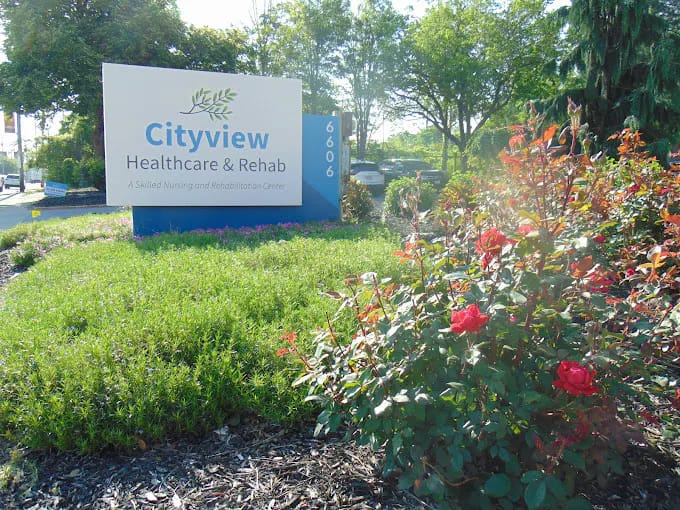
Throughout Ohio, Certus Healthcare operates 17 skilled nursing and 2 assisted living communities– one of which is CityView Healthcare & Rehabilitation located in Cleveland. CityView boasts a 150-bed long-term care facility that accepts insurance plans from Medicare and Medicaid. With an attentive management team, the residents not only recover but thrive in a comfortable and secure environment in this home.
An exclusive feature offered by the Certus Healthcare Community is the Connections Program which provides support for individuals suffering from various mental health disorders. They boast their highly qualified staff who have received specialized training for rehabilitation and various techniques for mental health support.

Quality ratings

Measured by Centers for Medicare & Medicaid Services (CMS)

Overall rating Info The Overall CMS Rating combines results from health inspections, staffing levels and quality measures. Health inspections carry the most weight. Staffing and quality scores can increase or decrease the final rating based on performance compared to state and national standards.
▼ 37.1% Below OH avg. ▼ 37.1% Below OH avg.OH average: 3.2Click the badge to see the full State ranking.Click here to see the full State ranking.
Health Inspection Info Based on the results of the facility's three most recent standard inspections and any complaint investigations. CMS reviews the number, scope, and severity of deficiencies, with more recent findings weighted more heavily.
▼ 64.3% Below OH avg. ▼ 64.3% Below OH avg.OH average: 2.8Click the badge to see the full State ranking.Click here to see the full State ranking.
Staffing Info Measures average nursing staff hours per resident per day, including Registered Nurses (RNs) and total nursing staff. Ratings are adjusted based on the level of care residents require and are compared to state and national benchmarks.
▼ 59.1% Below OH avg. ▼ 59.1% Below OH avg.OH average: 2.4Click the badge to see the full State ranking.Click here to see the full State ranking.
Quality Measures Info Based on clinical and physical health indicators reported to CMS, such as hospital readmissions, falls, pressure ulcers, and improvements in mobility. These measures reflect how well residents' health needs are being managed.
▲ 14.7% Above OH avg. ▲ 14.7% Above OH avg.OH average: 4.4Click the badge to see the full State ranking.Click here to see the full State ranking.

Staffing hours breakdown

Info Daily nursing hours per resident by staff type, reported to CMS. Higher is generally better — compare this facility to state and national averages to see where staffing stands.

Hours per resident per day — compared to Ohio state averages

Total nursing care / resident Info This home is ranked 190th out of 210 homes in Ohio for nurse hours. Total adjusted nursing hours per resident per day, combining RN, LPN, and aide time. CMS adjusts this for case-mix so facilities can be fairly compared.
2h 54m per day
Rank #190 / 210Nurse hours — State benchmarkedThis home is ranked 190th out of 210 homes in Ohio. Shows adjusted nurse hours per resident per day benchmarked to the Ohio average, with a ranking across 210 Ohio facilities. More hours mean more direct care. The national average is about 3.5 hrs; below 3.0 is a red flag.Rankings are based only on facilities in Ohio that report data for that category. Facilities without available data are excluded from the ranking.Click the rank badge to see the full State ranking.Click here to see the full State ranking.
This facility Ohio avg (3h 32m per day)
vs Ohio avg
-18%

6 of 6 metrics below state avg

Staff typeHours / Day / Residentvs state avg
Registered Nurse (RN) Info RNs hold the highest nursing license and can assess residents, interpret test results, and direct care plans. More RN hours per day often signals stronger clinical oversight and faster response to health changes. 21m per day ▼ 44% State avg: 38m per day · National avg: 41m per day
LPN / LVN Info Licensed Practical Nurses (LPNs) or Licensed Vocational Nurses (LVNs) deliver routine hands-on care — medication administration, wound dressing, and monitoring vital signs. They work under RN supervision and make up a large share of daily bedside care. 52m per day ▼ 10% State avg: 58m per day · National avg: 52m per day
Nurse Aide Info Certified Nurse Aides (CNAs) provide the most direct day-to-day assistance: bathing, dressing, feeding, and mobility. Nurse aide hours are typically the largest staffing category and directly affect residents' quality of life. 1h 55m per day ▼ 11% State avg: 2h 8m per day · National avg: 2h 21m per day
Weekend Total Nursing Info Combined nursing hours (RN + LPN + Nurse Aide) per resident per day on weekends. Staffing often drops on weekends — this figure reveals whether the facility maintains adequate coverage outside of weekday hours. 2h 47m per day ▼ 15% State avg: 3h 17m per day · National avg: 3h 26m per day
Physical Therapist Info Hours per resident per day provided by licensed Physical Therapists (PTs) or PT Assistants. PT services help residents recover mobility after injury or illness and are especially important for post-acute (short-stay) rehabilitation. 0m per day ▼ 86% State avg: 3m per day · National avg: 4m per day
Weekend RN Info Registered nurse hours specifically on weekends. Facilities sometimes reduce RN presence on Saturdays and Sundays — a low weekend RN figure compared to weekday hours can indicate reduced clinical oversight when most administrative staff are absent. 11m per day ▼ 57% State avg: 25m per day · National avg: 29m per day

Capacity and availability

This home usually has availability

Lower occupancy than the Ohio average: 78.7%
Occupancy rate
70% Rank #166 / 211Occupancy rate — State benchmarkedThis home is ranked 166th out of 211 homes in Ohio. Shows this facility's occupancy rate versus the Ohio average, with its Statewide rank out of 211. Higher occupancy signals strong local demand and financial stability.Rankings are based only on facilities in Ohio that report data for that category. Facilities without available data are excluded from the ranking.Click the rank badge to see the full State ranking.Click here to see the full State ranking.
Avg. Length of Stay
189 days
Bed community size
146-bed community Rank #25 / 323Bed count — State benchmarkedThis home is ranked 25th out of 323 homes in Ohio. Shows this facility's certified or reported bed count compared to other Ohio facilities. Larger communities may offer more amenities, programs, and on-site services for residents and families.Rankings are based only on facilities in Ohio that report data for that category. Facilities without available data are excluded from the ranking.Click the rank badge to see the full State ranking.Click here to see the full State ranking.
A larger shared setting that may offer more common spaces and organized community services.
Walk Score
Walk Score: 60 / 100 Rank #153 / 705Walk Score — State benchmarkedThis home is ranked 153rd out of 705 homes in Ohio. Shows how walkable this facility's neighborhood is compared to the average Walk Score across Ohio facilities. Higher scores benefit residents, families, and staff.Rankings are based only on facilities in Ohio that report data for that category. Facilities without available data are excluded from the ranking.Click the rank badge to see the full State ranking.Click here to see the full State ranking.
Moderately walkable. Some errands can be accomplished on foot, with a mix of nearby amenities.

Contact CityView Healthcare & Rehabilitation

Staffing Data

Reporting period: October 1 – December 31, 2025 (Q4 2025). Source: CMS Payroll-Based Journal report.

Total staff 114
Employees 107
Contractors 7
Staff to resident ratio 1.19 : 1
42% fewer staff per resident than Ohio average
Ohio average ratio: 2.04 : 1 Ohio average ratio: 2.04 : 1See full Ohio ranking
Avg staff/day 46
Average shift 7.1 hours
12% worse than Ohio average
Ohio average: 8.1 hours Ohio average shift: 8.1 hoursSee full Ohio ranking
Total staff hours (quarter) 30,013

Nursing staff breakdown

Q4 2025 · Oct 1 – Dec 31 More info This data comes from the CMS Payroll-Based Journal report covering October 1 – December 31, 2025.
Registered Nurse

Manages medical care and health needs.

RN Staff Info All 8 RN Staff are full-time employees. No contractors work on this role. 8
Average shift length Info Average shift length. Calculated as total hours divided by days worked and average staff per day. 7.5 hours
Licensed Practical Nurse

Assists with medical care and medications.

LPN Staff Info All 19 LPN Staff are full-time employees. No contractors work on this role. 19
Average shift length Info Average shift length. Calculated as total hours divided by days worked and average staff per day. 7.8 hours
Certified Nursing Assistant

Helps with daily care and mobility.

CNA Staff Info All 54 CNA Staff are full-time employees. No contractors work on this role. 54
Average shift length Info Average shift length. Calculated as total hours divided by days worked and average staff per day. 7 hours

Contractor staffing

Q4 2025 · Oct 1 – Dec 31 More info This data comes from the CMS Payroll-Based Journal report covering October 1 – December 31, 2025.

Total hours from contractors

1.9%

558 contractor hours this quarter

Feeding Assistant: 4 Occupational Therapy Aide: 1 Medical Director: 1 Other Physician: 1

Staff by category

Q4 2025 · Oct 1 – Dec 31 More info This data comes from the CMS Payroll-Based Journal report covering October 1 – December 31, 2025.
Certified Nursing Assistant5405415,09592100%7
Licensed Practical Nurse190195,96492100%7.8
Other Dietary Services Staff6062,00492100%6.9
Registered Nurse8081,5339098%7.5
RN Director of Nursing2029386773%7.5
Clinical Nurse Specialist2028856368%7.5
Administrator2024355863%7.5
Mental Health Service Worker1014285762%7.5
Physical Therapy Aide1014224953%8.6
Feeding Assistant0444115358%4.4
Nurse Practitioner1013985358%7.5
Dietitian3033634953%7.4
Speech Language Pathologist2023615054%7.2
Dental Services Staff1012904145%7.1
Qualified Social Worker3031783639%4.2
Respiratory Therapist1011052628%4
Medical Director011753134%2.4
Occupational Therapy Aide011691314%5.3
Respiratory Therapy Technician101571314%4.4
Other Physician011311%3
54 Certified Nursing Assistant
% of Days 100%
19 Licensed Practical Nurse
% of Days 100%
6 Other Dietary Services Staff
% of Days 100%
8 Registered Nurse
% of Days 98%
2 RN Director of Nursing
% of Days 73%
2 Clinical Nurse Specialist
% of Days 68%
2 Administrator
% of Days 63%
1 Mental Health Service Worker
% of Days 62%
1 Physical Therapy Aide
% of Days 53%
4 Feeding Assistant
% of Days 58%
1 Nurse Practitioner
% of Days 58%
3 Dietitian
% of Days 53%
2 Speech Language Pathologist
% of Days 54%
1 Dental Services Staff
% of Days 45%
3 Qualified Social Worker
% of Days 39%
1 Respiratory Therapist
% of Days 28%
1 Medical Director
% of Days 34%
1 Occupational Therapy Aide
% of Days 14%
1 Respiratory Therapy Technician
% of Days 14%
1 Other Physician
% of Days 1%

Penalties and fines

Includes penalties issued in 2023-2025

Federal penalties imposed by CMS for regulatory violations, including civil money penalties (fines) and denials of payment for new Medicare/Medicaid admissions.

Source: CMS Penalties Database (Data as of Jan 2026)

Total fines amount $166K Rank #202 / 211Federal fines — State benchmarkedThis home is ranked 202nd out of 211 homes in Ohio. Shows this facility's cumulative CMS federal fine dollars versus the Ohio average among facilities with fines, and where it ranks among 211 facilities in the pool. Lower total dollars mean a better rank.Rankings are based only on facilities in Ohio that report data for that category. Facilities without available data are excluded from the ranking.Click the rank badge to see the full State ranking.Click here to see the full State ranking.
142% higher than Ohio average

Ohio average: $69K

Number of fines 4
116% more fines than Ohio average

Ohio average: 1.9

Payment Denials Info Serious action where Medicare and/or Medicaid temporarily stops payments for new residents until issues are fixed. 0
100% fewer payment denials than Ohio average

Ohio average: 0.5

Fines amount comparison
This facility $166K
Ohio average $69K
Penalty History

Penalties are imposed by CMS for violations of federal nursing home regulations.

4 penalties in the past 3 years

Multiple penalties were reported in the last 3 years.

Civil Money Penalty Info Fines imposed for noncompliance, which can be assessed per day or per instance of violation. Feb 13, 2025
$18K
Civil Money Penalty Info Fines imposed for noncompliance, which can be assessed per day or per instance of violation. Nov 19, 2024
$17K
Civil Money Penalty Info Fines imposed for noncompliance, which can be assessed per day or per instance of violation. Sep 18, 2023
$63K
Civil Money Penalty Info Fines imposed for noncompliance, which can be assessed per day or per instance of violation. Aug 9, 2023
$68K

Last updated: Jan 2026

Quality of care over time

These measures show how residents usually do over time at this home, based on health outcomes and preventive care.

High-risk clinical events score Info A composite score based on pressure ulcers, falls with injury, weight loss, walking ability decline, and activities of daily living decline. 4.0
32% better than Ohio average

Ohio average: 5.8

Functional decline score Info A composite score based on activities of daily living decline, walking ability decline, and incontinence. 9.1
28% better than Ohio average

Ohio average: 12.7

Long-stay resident measures
Significantly above average Ohio avg: 4.7 Info CMS star rating based on long-stay quality measure performance. 5 stars = significantly above average, 1 star = significantly below average.
Need for Help with Daily Activities Increased Info Percent of long-stay residents whose need for help with daily activities has increased 3.0%
56% better than Ohio average

Ohio average: 6.8%

Walking Ability Worsened Info Percent of long-stay residents whose ability to move independently worsened 2.3%
74% better than Ohio average

Ohio average: 8.9%

Low Risk Residents with Bowel/Bladder Incontinence Info Percent of low risk long-stay residents who lose control of their bowels or bladder 22.1%
In line with Ohio average

Ohio average: 22.0%

Falls with Major Injury Info Percent of long-stay residents experiencing one or more falls with major injury 1.4%
60% better than Ohio average

Ohio average: 3.4%

High Risk Residents with Pressure Ulcers Info Percent of long-stay high risk residents with pressure ulcers 5.0%
28% worse than Ohio average

Ohio average: 3.9%

Urinary Tract Infection Info Percent of long-stay residents with a urinary tract infection 0.3%
50% better than Ohio average

Ohio average: 0.5%

Lost Too Much Weight Info Percent of long-stay residents who lose too much weight 8.1%
31% worse than Ohio average

Ohio average: 6.2%

Depressive Symptoms Info Percent of long-stay residents who have depressive symptoms 4.4%
82% better than Ohio average

Ohio average: 24.0%

Antipsychotic Use Info Percent of long-stay residents who received an antipsychotic medication 5.1%
39% better than Ohio average

Ohio average: 8.4%

Pneumococcal Vaccine Info Percent of long-stay residents assessed and appropriately given the pneumococcal vaccine 99.2%
7% better than Ohio average

Ohio average: 92.4%

Influenza Vaccine Info Percent of long-stay residents assessed and appropriately given the seasonal influenza vaccine 95.1%
In line with Ohio average

Ohio average: 94.5%

Short-stay resident measures
Pneumococcal Vaccine Info Percent of short-stay residents assessed and appropriately given the pneumococcal vaccine 69.1%
12% worse than Ohio average

Ohio average: 78.0%

Antipsychotic medication increase Info Percent of short-stay residents who newly received an antipsychotic medication 4.1%
221% worse than Ohio average

Ohio average: 1.3%

Influenza Vaccine Info Percent of short-stay residents assessed and appropriately given the seasonal influenza vaccine 59.0%
22% worse than Ohio average

Ohio average: 75.6%

Breakdown by payment type

Medicare

3% of new residents, usually for short-term rehab.

Typical stay 1 - 2 months

Private pay

74% of new residents, often for short stays.

Typical stay 1 - 2 months

Medicaid

23% of new residents, often for long-term daily care.

Typical stay 4 - 5 years

Facility Characteristics

Source: CMS Long-Term Care Facility Characteristics (Data as of Jan 2026)

Total residents 96
Medicaid
87
90.6% of residents
Private pay or other
9
9.4% of residents
Programs & Services
Residents Group

Residents meet regularly to discuss policies, care quality, and activities

Active Resident Council

Organized group of residents that meets regularly to discuss facility policies, quality of life, and activities.

Finances and operations

Based on CMS SNF Cost Report for fiscal year ending in 12/2023.

For-profit
Corporation
Net patient revenue Info Net patient revenue — what the home actually collects for resident care, after contractual allowances, bad debt and discounts are subtracted from its gross charges (CMS cost report, Worksheet G-3). It covers resident care only; money the home earns from other sources is shown separately as "Other income."
$10.3M
Net patient income Info Net patient income: net patient revenue minus the home's total operating expenses. A positive figure means it earns more from resident care than it spends to deliver it; a negative figure means the opposite. It excludes non-operating "other income."
$569.2K
For-profit Corporation
Net patient revenue Info Net patient revenue — what the home actually collects for resident care, after contractual allowances, bad debt and discounts are subtracted from its gross charges (CMS cost report, Worksheet G-3). It covers resident care only; money the home earns from other sources is shown separately as "Other income."
$10.3M Rank #62 / 210Revenue — State benchmarkedThis home is ranked 62nd out of 210 homes in Ohio. Shows this facility's annual revenue compared to the Ohio average. Higher revenue generally means more resources for staffing and capital — read alongside Payroll %.Rankings are based only on facilities in Ohio that report data for that category. Facilities without available data are excluded from the ranking.Click the rank badge to see the full State ranking.Click here to see the full State ranking.
Net patient income Info Net patient income: net patient revenue minus the home's total operating expenses. A positive figure means it earns more from resident care than it spends to deliver it; a negative figure means the opposite. It excludes non-operating "other income."
$569.2K
Other income Info Money the home earns outside of resident care — such as investments, grants, rentals and other non-operating sources (CMS cost report, Worksheet G-3). It is tracked separately from net patient revenue: it is not part of that figure, and it is not included in net patient income.
$960.3K
Payroll costs Info Staff salaries plus wage-related costs — benefits such as payroll taxes, health insurance and retirement — from the home's own accounting records (CMS cost report, Worksheet A). Contract or agency labor is counted separately, under other operating costs. Rank #92 / 210Payroll — State benchmarkedThis home is ranked 92nd out of 210 homes in Ohio. Shows total annual staff payroll benchmarked to the Ohio average. Higher payroll investment relative to peers often signals better staffing and less reliance on cheaper contract labor.Rankings are based only on facilities in Ohio that report data for that category. Facilities without available data are excluded from the ranking.Click the rank badge to see the full State ranking.Click here to see the full State ranking.
$5.8M 56.3% of net patient revenue Info Payroll as a share of revenue: staff salaries and wage-related benefits divided by net patient revenue. A higher figure means more of each revenue dollar goes to staff pay. Rank #186 / 210Payroll % — State benchmarkedThis home is ranked 186th out of 210 homes in Ohio. Shows payroll as a percentage of revenue versus the Ohio average. Well-run Ohio facilities typically land around 54–64% — the top third Statewide. Below 25% may signal understaffing or heavy agency use — read with Staffing ratings.Rankings are based only on facilities in Ohio that report data for that category. Facilities without available data are excluded from the ranking.Click the rank badge to see the full State ranking.Click here to see the full State ranking.
Other operating costs Info Everything it costs to run the home apart from payroll — food, utilities, supplies, maintenance, contract labor and administration. Calculated as total operating expense minus payroll (staff salaries and wage-related benefits).
$4.0M
Total costs Info The home's total operating expense for the year — all the costs of running it, salaries included (CMS cost report, Worksheet G-3).
$9.8M

Who this home usually serves

TYPE OF STAY

Primarily long-term care, limited rehab

Most residents stay long-term, while a smaller portion are admitted for short-term rehab.

Most new residents arrive under private pay (74% of admissions), and a typical private pay stay runs around 1 - 2 months.

Admissions
91 total

Coverage residents most often arrive under.

Medicare 3%
Private pay 74%
Medicaid 23%
Discharges
199 total

Coverage residents most often leave under.

Medicare 2%
Private pay 36%
Medicaid 62%

Places of interest near CityView Healthcare & Rehabilitation

Address 2.6 miles from city center Info Estimated distance in miles from Cleveland's city center to CityView Healthcare & Rehabilitation's address, calculated via Google Maps.

Calculate Travel Distance to CityView Healthcare & Rehabilitation

Add your location

Address

Compare Nursing Homes around Cleveland

The information below is reported by the Ohio Department of Health, Bureau of Survey and Certification.

5 facilities compared · CMS & OH Dept. of Health data

Algart Health Care
NH
AL
HC
MC
RC
Cleveland (Edgewater)
36
Facility 36
OH AVG 78
Rank #273 / 323
100.0%
Facility 100.0%
OH AVG 78.7%
Rank #1 / 211
+27%
4.17
Facility 4.17
OH AVG 3.54
Rank #35 / 210
-44%+18%
$0
Facility $0
OH AVG $74.0k
Rank #1 / 211
11
Facility 11
OH AVG 30.9
Rank #29 / 210
5.5
Facility 5.5
OH AVG 4.6
Rank #167 / 210
-67-
62
Facility 62
OH AVG 40
Rank #136 / 705
Garth Ireland
$7.0M
Facility $7.0M
OH AVG $10.1M
Rank #109 / 210
$3.1M
Facility $3.1M
OH AVG $3.9M
Rank #171 / 210
44.1%
Facility 44.1%
OH AVG 40.2%
Rank #205 / 210
366308
O‘Neill Healthcare Fairview Park
NH
HC
Fairview Park
118
Facility 118
OH AVG 78
Rank #54 / 323
77.1%
Facility 77.1%
OH AVG 78.7%
Rank #139 / 211
-2%
3.20
Facility 3.20
OH AVG 3.54
Rank #150 / 210
-22%-10%
$0
Facility $0
OH AVG $74.0k
Rank #1 / 211
11
Facility 11
OH AVG 30.9
Rank #29 / 210
1.8
Facility 1.8
OH AVG 4.6
Rank #9 / 210
-99A+
66
Facility 66
OH AVG 40
Rank #94 / 705
Jenna Elliott
$11.7M
Facility $11.7M
OH AVG $10.1M
Rank #58 / 210
$5.3M
Facility $5.3M
OH AVG $3.9M
Rank #109 / 210
45%
Facility 45%
OH AVG 40.2%
Rank #198 / 210
366428
Mcgregor at Overlook
NH
AL
HC
IL
NC
RC
East Cleveland
148
Facility 148
OH AVG 78
Rank #20 / 323
93.2%
Facility 93.2%
OH AVG 78.7%
Rank #46 / 211
+18%
4.17
Facility 4.17
OH AVG 3.54
Rank #35 / 210
-75%+18%
$15.7k
Facility $15.7k
OH AVG $74.0k
Rank #161 / 211
15
Facility 15
OH AVG 30.9
Rank #48 / 210
3.0
Facility 3.0
OH AVG 4.6
Rank #45 / 210
1137-
52
Facility 52
OH AVG 40
Rank #229 / 705
Susan Althans
$15.7M
Facility $15.7M
OH AVG $10.1M
Rank #3 / 210
$12.0M
Facility $12.0M
OH AVG $3.9M
Rank #8 / 210
76.3%
Facility 76.3%
OH AVG 40.2%
Rank #206 / 210
366350
Franklin Plaza Extended Care
NH
AL
HC
MC
RC
Cleveland (Ohio City)
178
Facility 178
OH AVG 78
Rank #5 / 323
92.7%
Facility 92.7%
OH AVG 78.7%
Rank #51 / 211
+18%
3.10
Facility 3.10
OH AVG 3.54
Rank #165 / 210
+4%-13%
$0
Facility $0
OH AVG $74.0k
Rank #1 / 211
31
Facility 31
OH AVG 30.9
Rank #117 / 210
3.4
Facility 3.4
OH AVG 4.6
Rank #64 / 210
-163-
87
Facility 87
OH AVG 40
Rank #5 / 705
-
$14.9M
Facility $14.9M
OH AVG $10.1M
Rank #25 / 210
$8.6M
Facility $8.6M
OH AVG $3.9M
Rank #28 / 210
57.6%
Facility 57.6%
OH AVG 40.2%
Rank #115 / 210
365388
CityView Healthcare & Rehabilitation
NH
HC
MC
PC
Cleveland (Central)
146
Facility 146
OH AVG 78
Rank #25 / 323
70.0%
Facility 70.0%
OH AVG 78.7%
Rank #166 / 211
-11%
2.91
Facility 2.91
OH AVG 3.54
Rank #190 / 210
-24%-18%
$166.4k
Facility $166.4k
OH AVG $74.0k
Rank #202 / 211
47
Facility 47
OH AVG 30.9
Rank #171 / 210
3.6
Facility 3.6
OH AVG 4.6
Rank #74 / 210
586-
60
Facility 60
OH AVG 40
Rank #153 / 705
-
$10.3M
Facility $10.3M
OH AVG $10.1M
Rank #62 / 210
$5.8M
Facility $5.8M
OH AVG $3.9M
Rank #92 / 210
56.3%
Facility 56.3%
OH AVG 40.2%
Rank #186 / 210
365879

Financial Assistance for
Nursing Home in Ohio

CityView Healthcare & Rehabilitation is located in Cleveland, Ohio.
Here are the financial assistance programs available to residents in Ohio.

Get Financial aid guidance

PASSPORT Waiver

Ohio Medicaid PASSPORT

Age 60+
General Ohio resident, Medicaid-eligible, nursing home-level care need.
Income Limits (2025) ~$2,829/month 300% FBR, individual
Asset Limits $2,000 (individual), $3,000 (couple).
OH

Administered through regional agencies; waitlists possible.

Benefits
Personal care (5-7 hours/day) Respite (240 hours/year) Adult day care ($65/day) Home modifications ($1,500 avg.)

Ohio Home Care Program (non-Medicaid)

OH HCP

Age 60+
General Ohio resident, at risk of decline.
Income Limits ~$2,000/month individual, varies
Asset Limits $5,000 individual
OH

Limited funding; regional variation.

Benefits
In-home care (3-5 hours/week) Respite (up to 10 days/year) Transportation (~5 trips/month)

Assisted Living Waiver (ALW)

Ohio Assisted Living Waiver

Age 21+ (65+ prioritized)
General OH resident, Medicaid-eligible, NFLOC.
Income Limits (2025) ~$2,829/month (individual); QIT required.
Asset Limits $2,000 (individual), $3,000 (couple).
OH

Covers ~300 facilities; room/board not included (separate cost).

Benefits
Personal care Meals Medication management Transportation (~$3,000-$4,000/month value)

Program of All-Inclusive Care for the Elderly (PACE)

Ohio PACE (e.g., McGregor PACE)

Age 55+
General OH resident (specific counties), NFLOC, safe with PACE support.
Income Limits (2025) ~$2,829/month (Medicaid-eligible); private pay option available.
Asset Limits $2,000 (individual), $3,000 (couple) for Medicaid enrollees.
OH

Available in 9 counties (e.g., Cuyahoga, Franklin); expanding via Healthy Aging Grants.

Benefits
Personal care (5-7 hours/day) Medical care Meals Transportation Respite Therapies

Medicare Savings Program (MSP)

Ohio Medicare Savings Program

Age 65+ or disabled
General OH resident, Medicare Part A/B.
Income Limits (2025) ~$2,510/month (QMB), ~$3,380/month (SLMB), ~$3,598/month (QI)—individual.
Asset Limits $9,430 (individual), $14,130 (couple).
OH

Three tiers; includes Extra Help for Part D; no waitlist.

Benefits
Covers Part B premiums ($174.70/month) Deductibles ($240/year) Copays (~20%)

Home Energy Assistance Program (HEAP)

Ohio HEAP

Age 60+ prioritized
General OH resident, low-income household.
Income Limits (2025) ~$3,970/month individual, 185% FPL
Asset Limits Not assessed; income-focused.
OH

Covers gas, electric, oil; emergency aid via Winter/Summer Crisis Programs.

Benefits
Heating/cooling aid ($300-$1,000/season) Emergency aid ($500 max)

Family Caregiver Support Program (FCSP)

Ohio Family Caregiver Support Program

Age
General Caregivers of 60+ needing care or 55+ caregivers of others; OH resident; functional needs (2+ ADLs).
Income Limits (2025) Prioritizes ~$24,980/year (individual); no strict cap.
Asset Limits Not assessed; need-based.
OH

12 AAAs; rural/low-income priority; volunteer respite option.

Benefits
Respite (4-6 hours/week or 5 days/year) Adult day care ($60/day) Training Supplies (~$500/year)

VA Aid and Attendance (A&A) and Housebound Benefits

Ohio VA Aid and Attendance/Housebound

Age 65+ or disabled veteran/spouse
General OH resident, wartime service, need for ADL help (A&A) or homebound.
Income Limits (2025) Net income < ~$1,984/month (veteran with dependent, A&A); pension offsets income.
Asset Limits ~$155,356 net worth limit
OH

High veteran demand; supports care in multiple settings.

Benefits
Cash (~$1,433-$2,642/month veteran, ~$951-$1,318 spouse) for care costs (e.g., in-home, assisted living)

Homestead Exemption

Ohio Homestead Exemption

Age 65+ (or disabled)
General OH resident, homeowner, low-income.
Income Limits (2025) ~$38,500/year individual, adjusted annually
Asset Limits Not assessed; home ownership required.
OH

Reduces taxable value by $25,000; applies to primary residence.

Benefits
Tax reduction (~$400-$800/year avg., varies by county)

Save the Dream Ohio (Homeowner Assistance Fund)

Ohio Save the Dream

Age 60+ prioritized
General OH resident, homeowner, hardship post-Jan 21, 2020.
Income Limits (2025) ~$147,600/year family of 4, 150% AMI; varies by county
Asset Limits Not assessed; hardship-focused.
OH

Covers delinquent mortgages, utilities, taxes; max $25,000 mortgage aid.

Benefits
Mortgage aid ($25,000 max) Utility/property tax aid ($5,000 avg.)

Frequently Asked Questions about CityView Healthcare & Rehabilitation

What neighborhood is CityView Healthcare & Rehabilitation in?

CityView Healthcare & Rehabilitation is in the Central neighborhood.

Is CityView Healthcare & Rehabilitation in a walkable area?

CityView Healthcare & Rehabilitation has a walk score of 60. Moderately walkable. Some errands can be accomplished on foot, with a mix of nearby amenities.

What is the occupancy rate at CityView Healthcare & Rehabilitation?

CityView Healthcare & Rehabilitation's occupancy is 70.0%.

Does CityView Healthcare & Rehabilitation operate as a for-profit or non-profit?

CityView Healthcare & Rehabilitation is registered as a for-profit.

Are there photos of CityView Healthcare & Rehabilitation?

Yes — there is 1 photo of CityView Healthcare & Rehabilitation in the photo gallery on this page.

What is the address of CityView Healthcare & Rehabilitation?

CityView Healthcare & Rehabilitation is located at 6606 Carnegie Ave, Cleveland, OH 44103.

What is the phone number of CityView Healthcare & Rehabilitation?

(216) 361-1414 will put you in contact with the team at CityView Healthcare & Rehabilitation.

Guides for Better Senior Living

Care Cost Calculator: See Prices in Your Area

Nursing Home Data Explorer

Don’t Wait Too Long: 7 Red Flag Signs Your Parent Needs Assisted Living Now

The True Cost of Assisted Living in 2025 – And How Families Are Paying For It

Understanding Senior Living Costs: Pricing Models, Discounts & Financial Assistance