Cloverdale Healthcare Center

Nursing Home · Sonoma County, CA
CMS overall rating Info The Overall CMS Rating is scored from 1 to 5 stars and combines results from health inspections, staffing levels, and quality measures. Health inspections carry the most weight. Staffing and quality scores can increase or decrease the final rating based on performance compared to state and national standards.
Cloverdale Healthcare Center

Nursing Home in Sonoma County

CMS overall rating Info The Overall CMS Rating is scored from 1 to 5 stars and combines results from health inspections, staffing levels, and quality measures. Health inspections carry the most weight. Staffing and quality scores can increase or decrease the final rating based on performance compared to state and national standards.
Calculator: See prices in your area
Cloverdale Healthcare Center accepts Medicare, Medicaid, and private pay.

Overview of Cloverdale Healthcare Center

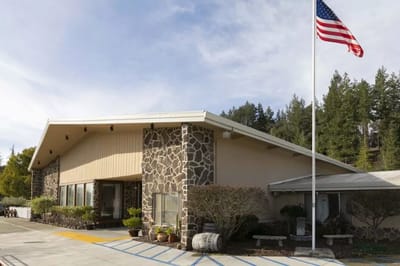
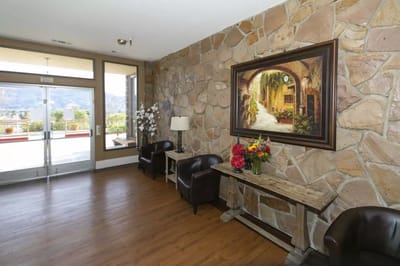
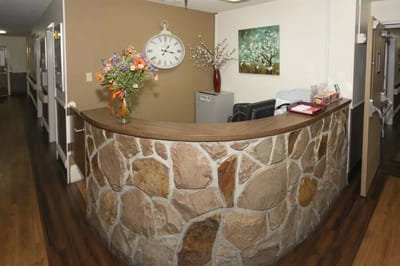
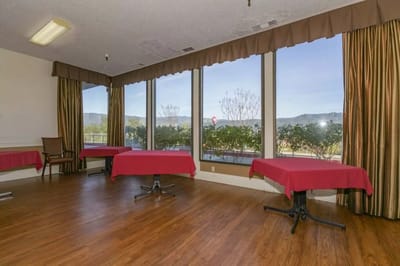
Cloverdale Healthcare Center is where residents thrive; they provide quality caregiving for long-term skilled nursing and short-term rehabilitation services. It offers a warm and welcoming atmosphere where residents and staff are encouraged to create friendships and build mutual trust that helps with an effective recovery and engaging experience. Families can rest easy knowing their loved ones are in good hands because of the dedicated team of professionals. Cloverdale is ideal for seniors looking for a homelike setting in a nurturing environment.
The nursing home aims to enhance the quality of life for its residents by ensuring that seniors can satisfy their holistic wellness and continue to maintain an active lifestyle. They house state-of-the-art technologies balanced with a comprehensive care plan that helps recover a range of medical conditions– wound care, neurological recovery, lymphedema, and pulmonary programs, as well as physical, occupational, and speech therapy.

Quality ratings

Measured by Centers for Medicare & Medicaid Services (CMS)

Overall rating Info The Overall CMS Rating combines results from health inspections, staffing levels and quality measures. Health inspections carry the most weight. Staffing and quality scores can increase or decrease the final rating based on performance compared to state and national standards.
▲ 38.9% Above CA avg.
Health Inspection Info Based on the results of the facility's three most recent standard inspections and any complaint investigations. CMS reviews the number, scope, and severity of deficiencies, with more recent findings weighted more heavily.
▲ 58.7% Above CA avg.
Staffing Info Measures average nursing staff hours per resident per day, including Registered Nurses (RNs) and total nursing staff. Ratings are adjusted based on the level of care residents require and are compared to state and national benchmarks.
▼ 13.0% Below CA avg.
Quality Measures Info Based on clinical and physical health indicators reported to CMS, such as hospital readmissions, falls, pressure ulcers, and improvements in mobility. These measures reflect how well residents' health needs are being managed.
▲ 17.4% Above CA avg.

Staffing hours breakdown

Info Daily nursing hours per resident by staff type, reported to CMS. Higher is generally better — compare this facility to state and national averages to see where staffing stands.

Hours per resident per day — compared to California state averages

Total nursing care / resident Info This home is ranked 88th out of 271 homes in California.

Total adjusted nursing hours per resident per day, combining RN, LPN, and aide time. CMS adjusts this for case-mix so facilities can be fairly compared.
4h 25m per day
Rank #88 / 271Nurse hours — state benchmarkedThis home is ranked 88th out of 271 homes in California.Shows adjusted nurse hours per resident per day benchmarked to the California average, with a ranking across 271 California SNFs. More hours mean more direct care. The national average is about 3.5 hrs; below 3.0 is a red flag.
This facility California avg (4h 23m per day)
vs California avg
+1%

3 of 6 metrics below state avg

Standout metric Physical Therapist is +20% above state avg
Staff typeHours / dayvs state avg
Registered Nurse (RN) Info RNs hold the highest nursing license and can assess residents, interpret test results, and direct care plans. More RN hours per day often signals stronger clinical oversight and faster response to health changes. 26m per day ▼ 33% State avg: 39m per day · National avg: 41m per day
LPN / LVN Info Licensed Practical Nurses (LPNs) or Licensed Vocational Nurses (LVNs) deliver routine hands-on care — medication administration, wound dressing, and monitoring vital signs. They work under RN supervision and make up a large share of daily bedside care. 1h 16m per day ▲ 4% State avg: 1h 13m per day · National avg: 52m per day
Nurse Aide Info Certified Nurse Aides (CNAs) provide the most direct day-to-day assistance: bathing, dressing, feeding, and mobility. Nurse aide hours are typically the largest staffing category and directly affect residents' quality of life. 2h 42m per day ■ Avg State avg: 2h 39m per day · National avg: 2h 21m per day
Total Nursing (Weekend) Info Combined nursing hours (RN + LPN + Nurse Aide) per resident per day on weekends. Staffing often drops on weekends — this figure reveals whether the facility maintains adequate coverage outside of weekday hours. 3h 51m per day ▼ 6% State avg: 4h 5m per day · National avg: 3h 26m per day
Physical Therapist Info Hours per resident per day provided by licensed Physical Therapists (PTs) or PT Assistants. PT services help residents recover mobility after injury or illness and are especially important for post-acute (short-stay) rehabilitation. 6m per day ▲ 20% State avg: 5m per day · National avg: 4m per day
RN (Weekend) Info Registered nurse hours specifically on weekends. Facilities sometimes reduce RN presence on Saturdays and Sundays — a low weekend RN figure compared to weekday hours can indicate reduced clinical oversight when most administrative staff are absent. 19m per day ▼ 37% State avg: 30m per day · National avg: 29m per day

Capacity and availability

This home usually has availability

Occupancy lower than 85% suggests more openings may be available.

Lower occupancy than the California average: 84.7%
Occupancy rate 59.6% Rank #254 / 277Occupancy rate — state benchmarkedThis home is ranked 254th out of 277 homes in California.Shows this facility's occupancy rate versus the California average, with its statewide rank out of 277. Higher occupancy signals strong local demand and financial stability.
Avg. Length of Stay 84 days
Occupancy rate
59.6% Rank #254 / 277Occupancy rate — state benchmarkedThis home is ranked 254th out of 277 homes in California.Shows this facility's occupancy rate versus the California average, with its statewide rank out of 277. Higher occupancy signals strong local demand and financial stability.
Avg. Length of Stay
84 days

Who this home usually serves

TYPE OF STAY

Mostly short-term rehab stays

Most residents typically stay for a few weeks or months before returning home or moving on.

Breakdown by payment type

Medicare

75% of new residents, usually for short-term rehab.

Typical stay 1 - 2 months

Private pay

15% of new residents, often for short stays.

Typical stay 1 - 2 months

Medicaid

10% of new residents, often for long-term daily care.

Typical stay 1 - 2 years

Finances and operations

Privately-owned community
Operated by a business corporation.
Home revenue
$8.8M
Profit
$961.5K
Privately-owned community Operated by a business corporation.
Home revenue
$8.8M Rank #219 / 275Revenue — state benchmarkedThis home is ranked 219th out of 275 homes in California.Shows this facility's annual revenue compared to the California SNF average. Higher revenue generally means more resources for staffing and capital — read alongside Payroll %.
Profit
$961.5K
Payroll costs Info The portion of the home's budget spent on staff, including nurses, caregivers, and other employees who support care and operations. Rank #209 / 275Payroll — state benchmarkedThis home is ranked 209th out of 275 homes in California.Shows total annual staff payroll benchmarked to the California average. Higher payroll investment relative to peers often signals better staffing and less reliance on cheaper contract labor.
$5.3M
60.4% of revenue Rank #65 / 275Payroll % — state benchmarkedThis home is ranked 65th out of 275 homes in California.Shows payroll as a percentage of revenue versus the California average. Well-run SNFs often land around 55–65%. Below 25% may signal understaffing or heavy agency use — read with Staffing ratings.
Other operating costs Info All remaining costs needed to run the home, such as food, utilities, building maintenance, supplies and administrative expenses.
$2.5M
Total costs $7.9M
Walk Score
Walk Score: 46 / 100 Rank #182 / 229Walk Score — state benchmarkedThis home is ranked 182nd out of 229 homes in California.Shows how walkable this facility's neighborhood is compared to the average Walk Score across California SNFs. Higher scores benefit residents, families, and staff.
Somewhat walkable. A few nearby services may be reachable on foot, but most trips require transportation.
BBB Rating
BBB Rating: A (Not Accredited)
An independent rating from the Better Business Bureau based on factors such as complaint history, transparency, and business practices.
How BBB ratings work

About this community

Therapy & Rehabilitation

1 service
Rehabilitation Services

Staffing & Medical

2 services
Doctor on Staff
24-Hour Staffing

Amenities & Lifestyle

Specific ProgramsIn-House Therapy, Stay Active

Types of Care at Cloverdale Healthcare Center

Nursing Home

Contact Cloverdale Healthcare Center

Inspection History

In California, the Department of Social Services (for assisted living facilities) and the Department of Public Health (for nursing homes) conduct inspections to ensure resident safety and regulatory compliance.

The data displayed corresponds to the last 5 years.

Inspection Scorecard Info This scorecard compares key inspection, citation, and complaint metrics at this facility against the California state average. Metrics worse than average are highlighted in red; those better than average are highlighted in green.

Since 2022 vs. California state average
Overall vs. California average 0 Worse No metrics in this bucket. 3 Better Metrics better than California average:
• Total visits (100% below)
• Complaint visits (100% below)
• Other visits (100% below)
Latest Inspection December 19, 2025 Annual Inspection

Inspections & Visits Info Regulatory visits include scheduled inspections, complaint investigations, and other on-site visits by state regulators.

MetricThis FacilityCalifornia Averagevs. California Avg
Total visits Info Combined count of complaint visits, other regulatory visits, and official scheduled inspections. 016 This facility has 100% fewer total visits than a typical California facility (0 vs. California avg 16).↓ 100% better
Complaint visits Info On-site visits triggered by formal complaints filed by residents, families, or staff. Fewer complaint visits generally indicate fewer reported concerns. 013 This facility has 100% fewer complaint visits than a typical California facility (0 vs. California avg 13).↓ 100% better
Other visits Info Regulatory visits that are neither routine inspections nor complaint investigations — administrative check-ins, follow-up reviews, licensing-related visits. 07 This facility has 100% fewer other visits than a typical California facility (0 vs. California avg 7).↓ 100% better

Inspection Reports Summary Info An editor-reviewed summary of the themes and findings across this facility's recent inspection reports.

This facility’s inspection record is mixed, with recurring issues in medication management, communication, and environmental safety. The most recent inspection on December 19, 2025, cited eight deficiencies including expired medications, missing physician orders, and drug count discrepancies. Earlier inspections flagged failures to notify families after falls, inadequate room sizes, and ongoing food safety and environmental hazards, showing inconsistent compliance over time.

Read the full state inspection reports, including specific deficiencies and facility responses.

Show Inspection Reports

Health Inspection History

Inspections
Total health inspections 4

California average 12.5


Last Health inspection on Mar 2025

Total health citations
13 Rank #13 / 275Health citations — state benchmarkedThis home is ranked 13th out of 275 homes in California.Shows this facility's total health deficiency citations benchmarked to the California state average, with a ranking across all 275 CA SNFs. Lower citation counts earn a better rank.

California average 50.2

Citations per inspection
3.25 Rank #62 / 275Citations per inspection — state benchmarkedThis home is ranked 62nd out of 275 homes in California.Shows average deficiency citations per CMS inspection for this facility versus the California mean across 275 SNFs with citation data. Lower is better.

California average 4.65


Health citations are formal notices following inspections when they fail to comply with safety and care standards.

12 of 13 citations resulted from standard inspections; and 1 of 13 resulted from complaint investigations.

Breakdown of citation severity (last 7 years)
Critical Health citations More info
0
100% better than California average

California average: 0.4


Serious Health citations More info 0
100% better than California average

California average: 1

0 critical citations More info California average: 0.4

0 serious citations More info California average: 1

12 moderate citations More info California average: 47.2

1 minor citation More info California average: 1.5
Citations history (last 7 years)
Resident Rights moderate citation Info Issues related to resident's rights, including dignity, privacy, and the ability to make decisions about their care. Mar 05, 2025
Corrected

Environmental minor citation Info Issues related to building safety, cleanliness, maintenance, and overall living conditions. Jan 09, 2025
Corrected

Nutrition moderate citation Info Issues related to food quality, meal service, and resident's nutritional needs. Oct 21, 2022
Corrected

Nutrition moderate citation Info Issues related to food quality, meal service, and resident's nutritional needs. Oct 21, 2022
Corrected

Financial Assistance for
Nursing Home in California

Cloverdale Healthcare Center is located in Cloverdale, California.
Here are the financial assistance programs available to residents in California.

Get Financial aid guidance

Multipurpose Senior Services Program

MSSP (Medi-Cal Waiver)

Age 65+
General California resident, Medi-Cal eligible, nursing home risk.
Income Limits (2025) ~$2,829/month 300% FBR, individual
Asset Limits $2,000 (individual), $3,000 (couple).
CA

County-managed; waitlists possible.

Benefits
In-home support (4-6 hours/day) Respite care (14 days/year) Meals (~$6/meal) Transportation (8 trips/month) Care management

In-Home Supportive Services (IHSS)

California IHSS

Age 65+
General California resident, Medicaid-eligible or low-income.
Income Limits ~$1,732/month individual, Medi-Cal threshold
Asset Limits $2,000 individual
CA

Can hire family as caregivers.

Benefits
Personal care (up to 283 hours/month) Homemaker services Respite (varies)

Multipurpose Senior Services Program (MSSP)

CA MSSP

Age 65+
General California resident, Medi-Cal-eligible, nursing home-eligible but community-capable.
Income Limits ~$2,829/month 300% FBR, individual
Asset Limits $2,000 individual
CA

Available in 38 counties; waitlists common.

Benefits
Case management Respite care (up to 10 days/year) Minor home mods (avg. $500) Adult day care (~$50/day)

Property Tax Postponement Program (PTP)

CA PTP

Age 62+
General California resident, own and live in home, 40% equity.
Income Limits (2025) ~$51,500/year household, adjusted annually
Asset Limits Equity-based; no strict asset cap.
CA

Deferred taxes accrue interest (5% as of 2024); repaid upon sale/death.

Benefits
Property tax deferral (avg. $1,000-$3,000/year, varies by county)

Assisted Living Waiver (ALW)

CA ALW

Age 65+ or disabled
General California resident, Medi-Cal-eligible, nursing home-eligible.
Income Limits ~$2,829/month 300% FBR, individual
Asset Limits $2,000 individual
CA

Available in 15 counties (e.g., LA, Sacramento); waitlists common.

Benefits
Personal care in ALFs (5-7 hours/day) Medication management Social services

California CARES Program

CA CARES

Age
General Caregivers of California residents 60+ needing help with 3+ daily activities; no caregiver age limit.
Income Limits No strict limit; cost-sharing above ~$2,500/month threshold.
Asset Limits Not applicable; need-based.
CA

High demand in urban areas; complements IHSS respite.

Benefits
Respite care (up to 10 days/year) Counseling (4-6 sessions/year) Training (2-3 workshops/year) Supplies (~$200/year)

Low-Income Home Energy Assistance Program (LIHEAP)

CA LIHEAP

Age 60+ priority
General California resident, low-income, utility/heating need.
Income Limits (2025) ~$2,510/month 200% of poverty level, individual
Asset Limits Not applicable; income-focused.
CA

High demand in inland/coastal extremes; weatherization capped at $5,000/home.

Benefits
Utility payments (avg. $500-$1,000/year) Weatherization (e.g., insulation, avg. $1,000-$3,000 savings)

Places of interest near Cloverdale Healthcare Center

Address 42.5 miles from city center Info Estimated distance in miles from Cloverdale's city center to Cloverdale Healthcare Center's address, calculated via Google Maps. — 15.03 miles to nearest hospital (Healdsburg Hospital, Providence)

Calculate Travel Distance to Cloverdale Healthcare Center

Add your location

Address

Staffing Data (Q2 2025)

This data corresponds to Q2 2025 and is based on CMS Payroll-Based Journal.

Total staff 111
Employees 79
Contractors 32
Staff to resident ratio 2.13:1
2134515% better than California average

California average ratio: 0.00:1

Avg staff/day 31
Average shift 8.8 hours
14% better than California average

California average: 7.7 hours

Total staff hours (quarter) 24,833
Nursing staff breakdown
Registered Nurse

Manages medical care and health needs.

Total count 6
Average shift length Info Average shift length. Calculated as total hours divided by days worked and average staff per day. 9.2 hours

No contractors work on this role.

Licensed Practical Nurse

Assists with medical care and medications.

Total count 29
Average shift length Info Average shift length. Calculated as total hours divided by days worked and average staff per day. 9.7 hours

This role is partially covered by contractors.

Certified Nursing Assistant

Helps with daily care and mobility.

Total count 56
Average shift length Info Average shift length. Calculated as total hours divided by days worked and average staff per day. 9.6 hours

This role is partially covered by contractors.

Contractor staffing

Total hours from contractors

5.2%

1,291 contractor hours this quarter

Certified Nursing Assistant: 20 Licensed Practical Nurse: 11 Medical Director: 1
Staff by category
Certified Nursing Assistant36205611,69491100%9.6
Licensed Practical Nurse1811295,14591100%9.7
Physical Therapy Assistant3031,0817582%7.3
RN Director of Nursing2021,0726571%8.6
Dental Services Staff2029206673%7.9
Speech Language Pathologist2028236673%7.3
Nurse Practitioner1015706571%8.8
Registered Nurse6065705662%9.2
Administrator1015206571%8
Respiratory Therapy Technician2024696268%7.6
Physical Therapy Aide1014325459%8
Therapeutic Recreation Specialist1014185662%7.5
Other Social Services Staff1013985156%7.8
Other Dietary Services Staff1013735662%6.7
Qualified Social Worker2022945965%4.7
Medical Director011544044%1.4
56 Certified Nursing Assistant
% of Days 100%
29 Licensed Practical Nurse
% of Days 100%
3 Physical Therapy Assistant
% of Days 82%
2 RN Director of Nursing
% of Days 71%
2 Dental Services Staff
% of Days 73%
2 Speech Language Pathologist
% of Days 73%
1 Nurse Practitioner
% of Days 71%
6 Registered Nurse
% of Days 62%
1 Administrator
% of Days 71%
2 Respiratory Therapy Technician
% of Days 68%
1 Physical Therapy Aide
% of Days 59%
1 Therapeutic Recreation Specialist
% of Days 62%
1 Other Social Services Staff
% of Days 56%
1 Other Dietary Services Staff
% of Days 62%
2 Qualified Social Worker
% of Days 65%
1 Medical Director
% of Days 44%

Facility Characteristics

Source: CMS Long-Term Care Facility Characteristics (Data as of Jan 2026)

Total residents 52
Medicare
18
34.6% of residents
Medicaid
27
51.9% of residents
Private pay or other
7
13.5% of residents

Quality of care over time

These measures show how residents usually do over time at this home, based on health outcomes and preventive care.

High-risk clinical events score Info A composite score based on pressure ulcers, falls with injury, weight loss, walking ability decline, and activities of daily living decline. 1.7
74% better than California average

California average: 6.6

Functional decline score Info A composite score based on activities of daily living decline, walking ability decline, and incontinence. 7.9
31% better than California average

California average: 11.3

Long-stay resident measures
Significantly above average California avg: 4.2 Info CMS star rating based on long-stay quality measure performance. 5 stars = significantly above average, 1 star = significantly below average.
Need for Help with Daily Activities Increased Info Percent of long-stay residents whose need for help with daily activities has increased 0.9%
92% better than California average

California average: 11.1%

Walking Ability Worsened Info Percent of long-stay residents whose ability to move independently worsened 6.2%
48% better than California average

California average: 12.0%

Low Risk Residents with Bowel/Bladder Incontinence Info Percent of low risk long-stay residents who lose control of their bowels or bladder 16.4%
45% worse than California average

California average: 11.3%

Falls with Major Injury Info Percent of long-stay residents experiencing one or more falls with major injury 1.5%
8% better than California average

California average: 1.7%

High Risk Residents with Pressure Ulcers Info Percent of long-stay high risk residents with pressure ulcers 0.0%
100% better than California average

California average: 5.0%

Urinary Tract Infection Info Percent of long-stay residents with a urinary tract infection 0.0%
100% better than California average

California average: 1.2%

Lost Too Much Weight Info Percent of long-stay residents who lose too much weight 0.0%
100% better than California average

California average: 4.2%

Depressive Symptoms Info Percent of long-stay residents who have depressive symptoms 15.9%
137% worse than California average

California average: 6.7%

Antipsychotic Use Info Percent of long-stay residents who received an antipsychotic medication 8.8%
13% better than California average

California average: 10.1%

Pneumococcal Vaccine Info Percent of long-stay residents assessed and appropriately given the pneumococcal vaccine 100.0%
In line with California average

California average: 98.5%

Influenza Vaccine Info Percent of long-stay residents assessed and appropriately given the seasonal influenza vaccine 97.4%
In line with California average

California average: 98.2%

Hospitalizations per 1,000 days Info Number of hospitalizations per 1,000 long-stay resident days. 0.12
95% better than California average

California average: 2.25

ED visits per 1,000 days Info Number of outpatient emergency department visits per 1,000 long-stay resident days. 0.99
38% better than California average

California average: 1.59

Short-stay resident measures
Significantly above average California avg: 3.5 Info CMS star rating based on short-stay quality measure performance. 5 stars = much above average, 1 star = much below average.
Pneumococcal Vaccine Info Percent of short-stay residents assessed and appropriately given the pneumococcal vaccine 100.0%
6% better than California average

California average: 94.0%

Antipsychotic medication increase Info Percent of short-stay residents who newly received an antipsychotic medication 0.0%
100% better than California average

California average: 1.5%

Influenza Vaccine Info Percent of short-stay residents assessed and appropriately given the seasonal influenza vaccine 98.9%
6% better than California average

California average: 93.2%

Re-hospitalized after SNF stay Info Percentage of short-stay residents who were re-hospitalized after their nursing home admission. 12.4%
47% better than California average

California average: 23.2%

Emergency department visits Info Percentage of short-stay residents who had an outpatient emergency department visit. 11.9%
6% worse than California average

California average: 11.2%

Falls with major injury Info Percentage of SNF residents who experience falls with major injury during their stay. 0.0%
100% better than California average

California average: 0.8%

Ability to care for self at discharge Info Percentage of residents at or above expected ability to care for themselves at discharge. 64.5%
20% better than California average

California average: 53.7%

Successful return to home or community Info Rate of successful return to home or community from a skilled nursing facility. 68.4%
35% better than California average

California average: 50.6%

Penalties and fines

Federal penalties imposed by CMS for regulatory violations, including civil money penalties (fines) and denials of payment for new Medicare/Medicaid admissions.

Source: CMS Penalties Database

No penalties in the past 3 years

No civil money penalties or payment denials were reported in the last 3 years.

Guides for Better Senior Living

Care Cost Calculator: See Prices in Your Area

Nursing Home Data Explorer

Don’t Wait Too Long: 7 Red Flag Signs Your Parent Needs Assisted Living Now

The True Cost of Assisted Living in 2025 – And How Families Are Paying For It

Understanding Senior Living Costs: Pricing Models, Discounts & Financial Assistance

Frequently Asked Questions about Cloverdale Healthcare Center

What neighborhood is Cloverdale Healthcare Center in?

Cloverdale Healthcare Center is in the Cherry Creek neighborhood of Cloverdale.

Is Cloverdale Healthcare Center in a walkable area?

Cloverdale Healthcare Center has a walk score of 46. Somewhat walkable. A few nearby services may be reachable on foot, but most trips require transportation.

What is the phone number of Cloverdale Healthcare Center?

(707) 894-5201 will put you in contact with the team at Cloverdale Healthcare Center.

Is Cloverdale Healthcare Center Medicare or Medicaid certified?

Yes — Cloverdale Healthcare Center is a CMS-certified provider of Medicare and Medicaid.

Explore Open Rooms
1 Contact details
2 What type of senior care service are you looking for?
3 What budget do you have in mind for senior care?
4 How soon do you need to find care?
5 Additional details

Thank you for your interest!

Our team will be in touch shortly to help with next steps.