Concordia Village of Tampa
Nursing Home & Independent Living · Tampa, FL
CMS overall rating Info CMS (the Centers for Medicare & Medicaid Services) is the federal agency that rates nursing home quality. Its Overall Rating runs from 1 to 5 stars, combining health inspections, staffing, and quality measures, with inspections weighted most heavily.

Concordia Village of Tampa

Nursing Home & Independent Living · Tampa, FL
CMS overall rating Info CMS (the Centers for Medicare & Medicaid Services) is the federal agency that rates nursing home quality. Its Overall Rating runs from 1 to 5 stars, combining health inspections, staffing, and quality measures, with inspections weighted most heavily.
Calculator: See prices in your area
Concordia Village of Tampa accepts Insurance and/or HMO, Medicaid, Veteran Affairs Benefits, Medicare, and private pay.

Overview of Concordia Village of Tampa

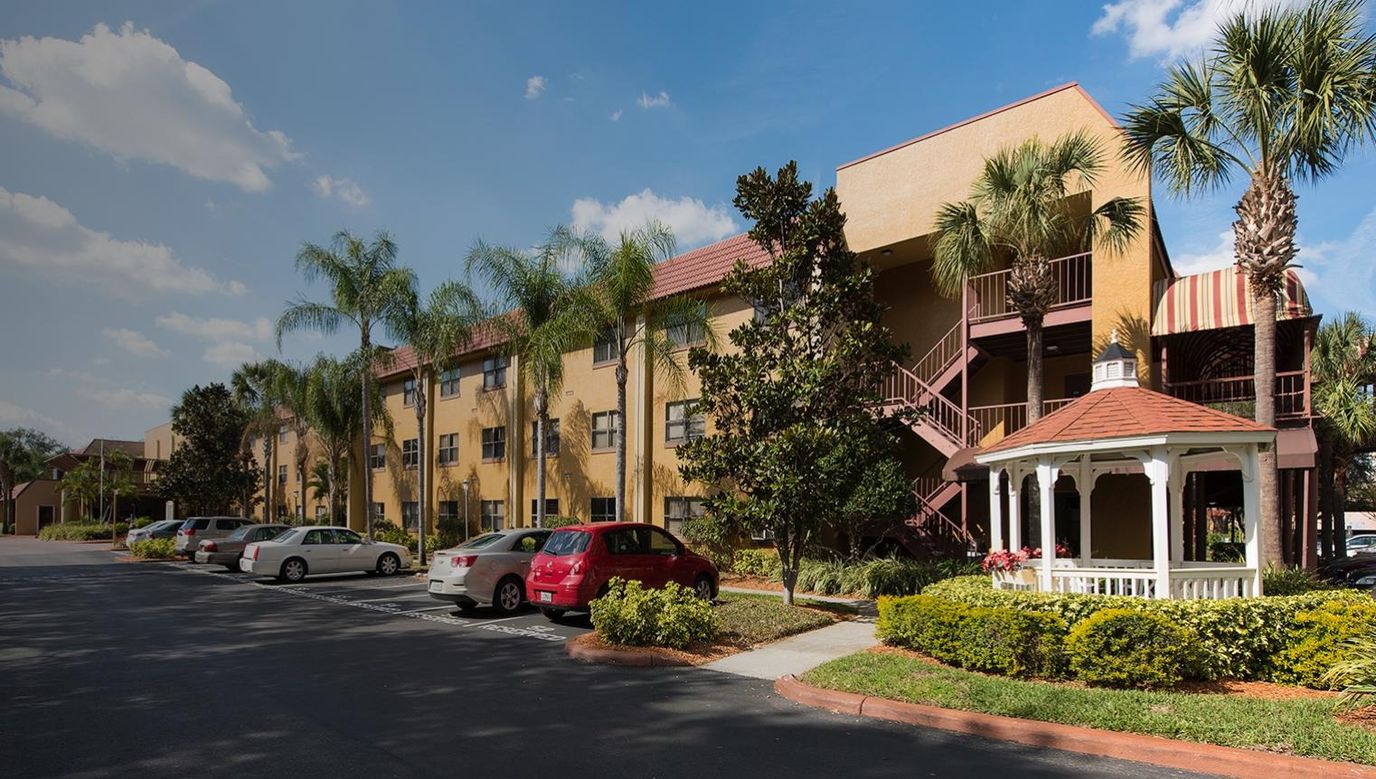
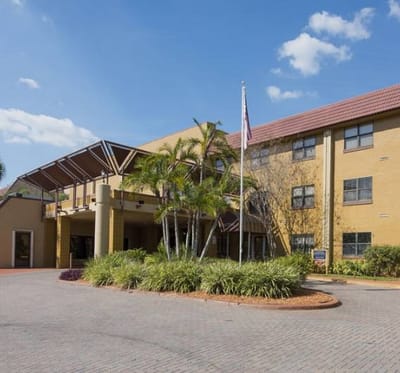
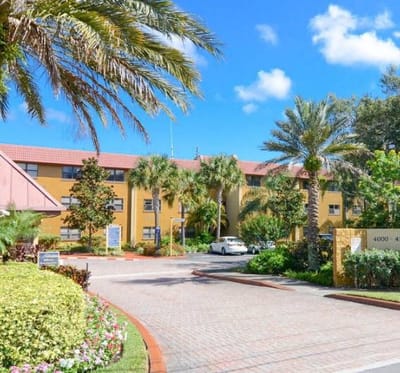
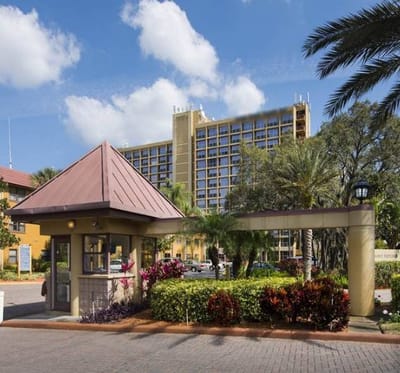
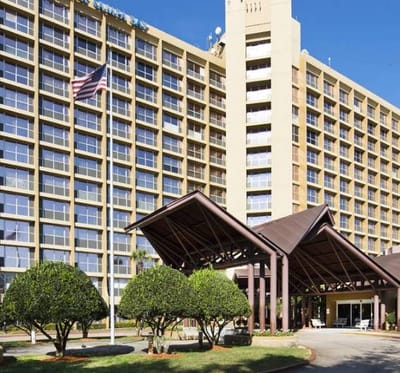
Conveniently located in the thriving neighborhood of Tampa, FL, Concordia Village of Tampa is a blissful haven that offers independent living. The community features cozy and thoughtfully designed studio to two-bedroom floor plans, dedicated to residents’ comfort and well-being. Residents enjoy a convenient lifestyle with routine maintenance, 24-hour security, and concierge services.

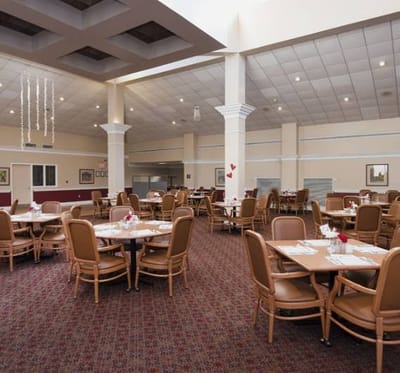
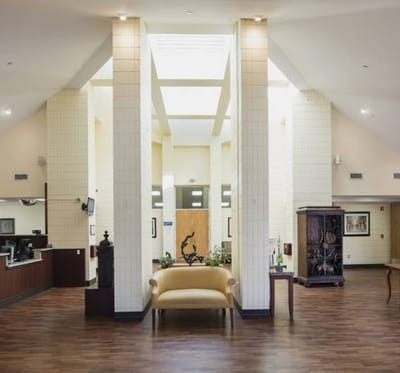
Engaging activities and enriching programs are conducted, promoting an active and vibrant lifestyle. Delectable and well-balanced meals are served to satisfy residents’ dietary needs and preferences. Transportation services are also provided for residents’ convenience and safety. The community has plenty of amenities, including a swimming pool, a movie theater, a billiards room, a beauty salon, a fitness center, game courts, a library, a computer center, and cozy communal spaces.

Quality ratings

Measured by Centers for Medicare & Medicaid Services (CMS)

Overall rating Info The Overall CMS Rating combines results from health inspections, staffing levels and quality measures. Health inspections carry the most weight. Staffing and quality scores can increase or decrease the final rating based on performance compared to state and national standards.
▼ 5.5% Below FL avg. ▼ 5.5% Below FL avg.FL average: 3.2Click the badge to see the full State ranking.Click here to see the full State ranking.
Health Inspection Info Based on the results of the facility's three most recent standard inspections and any complaint investigations. CMS reviews the number, scope, and severity of deficiencies, with more recent findings weighted more heavily.
▼ 28.9% Below FL avg. ▼ 28.9% Below FL avg.FL average: 2.8Click the badge to see the full State ranking.Click here to see the full State ranking.
Staffing Info Measures average nursing staff hours per resident per day, including Registered Nurses (RNs) and total nursing staff. Ratings are adjusted based on the level of care residents require and are compared to state and national benchmarks.
▼ 40.9% Below FL avg. ▼ 40.9% Below FL avg.FL average: 3.4Click the badge to see the full State ranking.Click here to see the full State ranking.
Quality Measures Info Based on clinical and physical health indicators reported to CMS, such as hospital readmissions, falls, pressure ulcers, and improvements in mobility. These measures reflect how well residents' health needs are being managed.
▲ 23.2% Above FL avg. ▲ 23.2% Above FL avg.FL average: 4.1Click the badge to see the full State ranking.Click here to see the full State ranking.

Staffing hours breakdown

Info Daily nursing hours per resident by staff type, reported to CMS. Higher is generally better — compare this facility to state and national averages to see where staffing stands.

Hours per resident per day — compared to Florida state averages

Total nursing care / resident Info This home is ranked 175th out of 253 homes in Florida for nurse hours. Total adjusted nursing hours per resident per day, combining RN, LPN, and aide time. CMS adjusts this for case-mix so facilities can be fairly compared.
3h 43m per day
Rank #175 / 253Nurse hours — State benchmarkedThis home is ranked 175th out of 253 homes in Florida. Shows adjusted nurse hours per resident per day benchmarked to the Florida average, with a ranking across 253 Florida facilities. More hours mean more direct care. The national average is about 3.5 hrs; below 3.0 is a red flag.Rankings are based only on facilities in Florida that report data for that category. Facilities without available data are excluded from the ranking.Click the rank badge to see the full State ranking.Click here to see the full State ranking.
This facility Florida avg (4h 2m per day)
vs Florida avg
-8%

5 of 6 metrics below state avg

Standout metric LPN / LVN is +27% above state avg
Staff typeHours / Day / Residentvs state avg
Registered Nurse (RN) Info RNs hold the highest nursing license and can assess residents, interpret test results, and direct care plans. More RN hours per day often signals stronger clinical oversight and faster response to health changes. 25m per day ▼ 42% State avg: 44m per day · National avg: 41m per day
LPN / LVN Info Licensed Practical Nurses (LPNs) or Licensed Vocational Nurses (LVNs) deliver routine hands-on care — medication administration, wound dressing, and monitoring vital signs. They work under RN supervision and make up a large share of daily bedside care. 1h 0m per day ▲ 27% State avg: 47m per day · National avg: 52m per day
Nurse Aide Info Certified Nurse Aides (CNAs) provide the most direct day-to-day assistance: bathing, dressing, feeding, and mobility. Nurse aide hours are typically the largest staffing category and directly affect residents' quality of life. 2h 8m per day ▼ 9% State avg: 2h 20m per day · National avg: 2h 20m per day
Weekend Total Nursing Info Combined nursing hours (RN + LPN + Nurse Aide) per resident per day on weekends. Staffing often drops on weekends — this figure reveals whether the facility maintains adequate coverage outside of weekday hours. 3h 14m per day ▼ 8% State avg: 3h 32m per day · National avg: 3h 27m per day
Physical Therapist Info Hours per resident per day provided by licensed Physical Therapists (PTs) or PT Assistants. PT services help residents recover mobility after injury or illness and are especially important for post-acute (short-stay) rehabilitation. 4m per day ▼ 36% State avg: 6m per day · National avg: 4m per day
Weekend RN Info Registered nurse hours specifically on weekends. Facilities sometimes reduce RN presence on Saturdays and Sundays — a low weekend RN figure compared to weekday hours can indicate reduced clinical oversight when most administrative staff are absent. 18m per day ▼ 43% State avg: 32m per day · National avg: 29m per day

Capacity and availability

Avg. Length of Stay
55 days
Bed community size
175-bed community Rank #84 / 1074Bed count — State benchmarkedThis home is ranked 84th out of 1074 homes in Florida. Shows this facility's certified or reported bed count compared to other Florida facilities. Larger communities may offer more amenities, programs, and on-site services for residents and families.Rankings are based only on facilities in Florida that report data for that category. Facilities without available data are excluded from the ranking.Click the rank badge to see the full State ranking.Click here to see the full State ranking.
A large-scale community that may provide a wide range of amenities, services, and structured programs.
Years in operation
8 years in operation
An established community with some operational experience and growing routines.
Walk Score
Walk Score: 23 / 100 Rank #1034 / 1486Walk Score — State benchmarkedThis home is ranked 1034th out of 1486 homes in Florida. Shows how walkable this facility's neighborhood is compared to the average Walk Score across Florida facilities. Higher scores benefit residents, families, and staff.Rankings are based only on facilities in Florida that report data for that category. Facilities without available data are excluded from the ranking.Click the rank badge to see the full State ranking.Click here to see the full State ranking.
Car-dependent. Most errands require a car, with limited nearby walkable options.

About this community

Occupancy

Occupancy rate
45%
Rank #250 / 258Occupancy rate — State benchmarkedThis home is ranked 250th out of 258 homes in Florida. Shows this facility's occupancy rate versus the Florida average, with its Statewide rank out of 258. Higher occupancy signals strong local demand and financial stability.Rankings are based only on facilities in Florida that report data for that category. Facilities without available data are excluded from the ranking.Click the rank badge to see the full State ranking.Click here to see the full State ranking.
Lower than the Florida average: 84.3%
Occupied beds
78 / 175
Average occupied beds in Florida homes 108 beds

License Details

Facility TypeAssisted Living Facility
StatusProvisional
IssuanceAugust 8, 2025
ExpirationJuly 8, 2026 Expires in 12 days
CountyHillsborough
License Number4110
CMS Certification Number105351

Ownership & Operating Entity

Concordia Village of Tampa is legally operated by Fletcher Fl Al, Llc, and administered by Tracy Lynn Johnson.

Profit StatusNonprofit

Type Of Units

Private
175 units
Total beds
175 units

Staffing

Key information about the people who lead and staff this community.

Leadership

ContactMr. Keith Frndak, President/Director

Therapy & Rehabilitation

3 services
Rehabilitation Services
Respite Care
Short-Term Rehab

Staffing & Medical

1 service
24-Hour Staffing

Additional Policies & Features

Continuing Care Retirement Community (CCRC)

Amenities & Lifestyle

Specific ProgramsRetirement Living, Long-Term Nursing Care, Inpatient Hospice Services, Outpatient Therapy, Adult Day Services, Home & Community Services

Contact Concordia Village of Tampa

Inspection History

In Florida, the Agency for Health Care Administration (AHCA) is the primary authority that conducts unannounced inspections and completes official health quality reports for all healthcare facilities.

Since 2012 · 14 years of data 55 citations 44 inspections 3 fines $8.0K fined
Inspection Score Info A composite 0–100 score combining this facility's inspections, citations, complaints, and enforcement actions relative to the Florida state average. The score below shows how many points this facility sits above or below the typical Florida nursing home score (the benchmark); higher is better.

5 points below the Florida average for nursing homes (83/100)

Rank #613 / 876 in Florida Inspection Score — State benchmarked This home is ranked 613th out of 876 homes in Florida. Shows this facility's inspection score compared to the Florida average among 876 comparable communities in the ranking pool. Rankings are based only on facilities in Florida that report data for that category. Facilities without available data are excluded from the ranking. Inspection score: 78 out of 100. Letter grade C+. 5 points below the Florida average for nursing homes (83/100)

Inspection Scorecard Info This scorecard compares key inspection, citation, and complaint metrics at this facility against the Florida state average. Metrics rated ≥15% worse than average are highlighted in red; those ≥15% better are highlighted in green.

Since 2012 vs. Florida state average
Overall vs. FL average 4 Worse Metrics worse than Florida average:
• Total citations (67% above)
• Citations per year (63% above)
• Total inspections (69% above)
• Inspections with citations (25% above)
1 At Avg Metrics at Florida average:
• Citations per inspection (at FL avg)
1 Better Metrics better than Florida average:
• Inspection citation rate (27% below)
Latest Inspection August 5, 2025 Complaint

Citations Info Citations are formal regulatory issues recorded during state inspections.

This FacilityFL Averagevs. FL Avg
Total citations Info Formal regulatory issues recorded by inspectors across all inspection types. 5533 This facility has 67% more total citations than a typical Florida nursing home (55 vs. FL avg 33).↑ 67% worse Rank #758 / 919 Total citations — State benchmarked This home is ranked 758th out of 919 homes in Florida. Shows this facility's total citations compared to the Florida average among 919 comparable communities in the ranking pool. Rankings are based only on facilities in Florida that report data for that category. Facilities without available data are excluded from the ranking.
Citations per year Info Average citations per year since 2012. 3.92.4 This facility has 63% more citations per year than a typical Florida nursing home (3.9 vs. FL avg 2.4).↑ 63% worse
Citations per inspection Info Average citations per inspection. 1.31.3 This facility has citations per inspection in line with the Florida average (1.3 vs. FL avg 1.3).— At avg Rank #557 / 919 Citations per inspection — State benchmarked This home is ranked 557th out of 919 homes in Florida. Shows this facility's citations per inspection compared to the Florida average among 919 comparable communities in the ranking pool. Rankings are based only on facilities in Florida that report data for that category. Facilities without available data are excluded from the ranking.

Inspections Info State inspections evaluate whether the facility meets health and safety standards.

This FacilityFL Averagevs. FL Avg
Total inspections Info Combined count of all routine and focused inspections. Excludes complaint investigations. 4426 This facility has 69% more total inspections than a typical Florida nursing home (44 vs. FL avg 26).↑ 69% worse
Inspections with citations Info Inspections that resulted in at least one regulatory citation. 2016 This facility has 25% more inspections with citations than a typical Florida nursing home (20 vs. FL avg 16).↑ 25% worse
Inspection citation rate Info Percentage of inspections that resulted in at least one citation. 45%62% This facility has 17 percentage points lower inspection citation rate than a typical Florida nursing home (45% vs. FL avg 62%).↓ 17% better Rank #301 / 919 Inspection citation rate — State benchmarked This home is ranked 301st out of 919 homes in Florida. Shows this facility's % of inspections with citations compared to the Florida average among 919 comparable communities in the ranking pool. Rankings are based only on facilities in Florida that report data for that category. Facilities without available data are excluded from the ranking.

Inspection Reports Summary Info An editor-reviewed summary of the themes and findings across this facility's recent inspection reports.

  • The most recent inspection on August 5, 2025, found no deficiencies during the complaint investigation.
  • The March 25, 2024 annual inspection cited six Class 3 deficiencies involving medication assistance, staffing, training, and Alzheimer’s disease/dementia care.
  • Deficiencies related to training on first aid, medication self-administration, and Alzheimer’s disease/dementia recurred in June 17, 2024 complaint inspection.

Health Inspection History

Inspections since 2020
Total health inspections 4

Florida average 4.3


Last Health inspection on Jun 2024

Total health citations
36 Rank #238 / 252Health citations — State benchmarkedThis home is ranked 238th out of 252 homes in Florida. Shows this facility's total health deficiency citations benchmarked to the Florida State average, with a ranking across all 252 FL facilities. Lower citation counts earn a better rank.Rankings are based only on facilities in Florida that report data for that category. Facilities without available data are excluded from the ranking.Click the rank badge to see the full State ranking.Click here to see the full State ranking.

Florida average 19.7

Citations per inspection
9 Rank #245 / 252Citations per inspection — State benchmarkedThis home is ranked 245th out of 252 homes in Florida. Shows average deficiency citations per CMS inspection for this facility versus the Florida mean across 252 facilities with citation data. Lower is better.Rankings are based only on facilities in Florida that report data for that category. Facilities without available data are excluded from the ranking.Click the rank badge to see the full State ranking.Click here to see the full State ranking.

Florida average 4.48


Health citations are formal notices following inspections when they fail to comply with safety and care standards.

32 of 36 citations resulted from standard inspections; 2 of 36 resulted from complaint investigations; and 2 of 36 came from combined inspections (standard and complaint).

Breakdown of citation severity (last 6 years)
Critical health citations
0
100% better than Florida average

Florida average: 0.8


Serious health citations
1
150% worse than Florida average

Florida average: 0.4

0 critical citations Florida average: 0.8

1 serious citation Florida average: 0.4

35 moderate citations Florida average: 18.4

0 minor citations Florida average: 0.2
Citations history (last 6 years)
Abuse/Neglect moderate citation Jun 19, 2024
Corrected

Abuse/Neglect moderate citation Apr 10, 2024
Corrected

Administration moderate citation Apr 10, 2024
Corrected

Environmental moderate citation Apr 10, 2024
Corrected

Staffing Data

Reporting period: October 1 – December 31, 2025 (Q4 2025). Source: CMS Payroll-Based Journal report.

Total staff 209
Employees 206
Contractors 3
Staff to resident ratio 3.87 : 1
163% more staff per resident than Florida average
Florida average ratio: 1.47 : 1 Florida average ratio: 1.47 : 1See full Florida ranking
Avg staff/day 72
Average shift 7.2 hours
9% worse than Florida average
Florida average: 7.9 hours Florida average shift: 7.9 hoursSee full Florida ranking
Total staff hours (quarter) 47,484

Nursing staff breakdown

Q4 2025 · Oct 1 – Dec 31 More info This data comes from the CMS Payroll-Based Journal report covering October 1 – December 31, 2025.
Registered Nurse

Manages medical care and health needs.

RN Staff Info All 17 RN Staff are full-time employees. No contractors work on this role. 17
Average shift length Info Average shift length. Calculated as total hours divided by days worked and average staff per day. 7.5 hours
Licensed Practical Nurse

Assists with medical care and medications.

LPN Staff Info All 41 LPN Staff are full-time employees. No contractors work on this role. 41
Average shift length Info Average shift length. Calculated as total hours divided by days worked and average staff per day. 7.7 hours
Certified Nursing Assistant

Helps with daily care and mobility.

CNA Staff Info All 86 CNA Staff are full-time employees. No contractors work on this role. 86
Average shift length Info Average shift length. Calculated as total hours divided by days worked and average staff per day. 7 hours

Contractor staffing

Q4 2025 · Oct 1 – Dec 31 More info This data comes from the CMS Payroll-Based Journal report covering October 1 – December 31, 2025.

Total hours from contractors

1.4%

665 contractor hours this quarter

Medical Director: 1 Clinical Nurse Specialist: 1 Occupational Therapy Assistant: 1

Staff by category

Q4 2025 · Oct 1 – Dec 31 More info This data comes from the CMS Payroll-Based Journal report covering October 1 – December 31, 2025.
Certified Nursing Assistant8608622,68392100%7
Licensed Practical Nurse410418,79092100%7.7
Registered Nurse170172,82392100%7.5
Dietitian5052,0989098%7.2
Speech Language Pathologist100102,0758289%7
Physical Therapy Aide110111,9737379%6.8
RN Director of Nursing7071,8407177%7.9
Clinical Nurse Specialist3141,0966975%7.8
Physical Therapy Assistant6068308390%5.9
Mental Health Service Worker4047176672%8
Respiratory Therapy Technician5056498289%5.5
Qualified Social Worker7075966065%7.2
Nurse Practitioner1015587076%8
Administrator1014886166%8
Occupational Therapy Aide2021342729%5
Medical Director011961820%5.3
Occupational Therapy Assistant011413134%1.3
86 Certified Nursing Assistant
% of Days 100%
41 Licensed Practical Nurse
% of Days 100%
17 Registered Nurse
% of Days 100%
5 Dietitian
% of Days 98%
10 Speech Language Pathologist
% of Days 89%
11 Physical Therapy Aide
% of Days 79%
7 RN Director of Nursing
% of Days 77%
4 Clinical Nurse Specialist
% of Days 75%
6 Physical Therapy Assistant
% of Days 90%
4 Mental Health Service Worker
% of Days 72%
5 Respiratory Therapy Technician
% of Days 89%
7 Qualified Social Worker
% of Days 65%
1 Nurse Practitioner
% of Days 76%
1 Administrator
% of Days 66%
2 Occupational Therapy Aide
% of Days 29%
1 Medical Director
% of Days 20%
1 Occupational Therapy Assistant
% of Days 34%

Penalties and fines

Includes penalties issued in 2024

Federal penalties imposed by CMS for regulatory violations, including civil money penalties (fines) and denials of payment for new Medicare/Medicaid admissions.

Source: CMS Penalties Database (Data as of Jan 2026)

Total fines amount $17K Rank #195 / 258Federal fines — State benchmarkedThis home is ranked 195th out of 258 homes in Florida. Shows this facility's cumulative CMS federal fine dollars versus the Florida average among facilities with fines, and where it ranks among 258 facilities in the pool. Lower total dollars mean a better rank.Rankings are based only on facilities in Florida that report data for that category. Facilities without available data are excluded from the ranking.Click the rank badge to see the full State ranking.Click here to see the full State ranking.
77% lower than Florida average

Florida average: $72K

Number of fines 2
24% fewer fines than Florida average

Florida average: 2.6

Payment Denials Info Serious action where Medicare and/or Medicaid temporarily stops payments for new residents until issues are fixed. 0
100% fewer payment denials than Florida average

Florida average: 0.1

Fines amount comparison
This facility $17K
Florida average $72K
Penalty History

Penalties are imposed by CMS for violations of federal nursing home regulations.

2 penalties in the past 3 years

Multiple penalties were reported in the last 3 years.

Civil Money Penalty Info Fines imposed for noncompliance, which can be assessed per day or per instance of violation. Apr 10, 2024
$4K
Civil Money Penalty Info Fines imposed for noncompliance, which can be assessed per day or per instance of violation. Apr 10, 2024
$13K

Last updated: Jan 2026

Quality of care over time

These measures show how residents usually do over time at this home, based on health outcomes and preventive care.

High-risk clinical events score Info A composite score based on pressure ulcers, falls with injury, weight loss, walking ability decline, and activities of daily living decline. 13.9
87% worse than Florida average

Florida average: 7.4

Functional decline score Info A composite score based on activities of daily living decline, walking ability decline, and incontinence. 20.1
62% worse than Florida average

Florida average: 12.4

Long-stay resident measures
Need for Help with Daily Activities Increased Info Percent of long-stay residents whose need for help with daily activities has increased 16.7%
59% worse than Florida average

Florida average: 10.5%

Walking Ability Worsened Info Percent of long-stay residents whose ability to move independently worsened 36.8%
184% worse than Florida average

Florida average: 12.9%

Low Risk Residents with Bowel/Bladder Incontinence Info Percent of low risk long-stay residents who lose control of their bowels or bladder 6.8%
50% better than Florida average

Florida average: 13.5%

Falls with Major Injury Info Percent of long-stay residents experiencing one or more falls with major injury 1.9%
30% better than Florida average

Florida average: 2.6%

High Risk Residents with Pressure Ulcers Info Percent of long-stay high risk residents with pressure ulcers 2.2%
59% better than Florida average

Florida average: 5.4%

Urinary Tract Infection Info Percent of long-stay residents with a urinary tract infection 1.3%
47% worse than Florida average

Florida average: 0.9%

Lost Too Much Weight Info Percent of long-stay residents who lose too much weight 11.9%
98% worse than Florida average

Florida average: 6.0%

Depressive Symptoms Info Percent of long-stay residents who have depressive symptoms 2.9%
14% better than Florida average

Florida average: 3.3%

Antipsychotic Use Info Percent of long-stay residents who received an antipsychotic medication 1.3%
84% better than Florida average

Florida average: 8.0%

Pneumococcal Vaccine Info Percent of long-stay residents assessed and appropriately given the pneumococcal vaccine 97.5%
In line with Florida average

Florida average: 97.7%

Influenza Vaccine Info Percent of long-stay residents assessed and appropriately given the seasonal influenza vaccine 100.0%
In line with Florida average

Florida average: 99.2%

Short-stay resident measures
Pneumococcal Vaccine Info Percent of short-stay residents assessed and appropriately given the pneumococcal vaccine 89.2%
5% worse than Florida average

Florida average: 94.0%

Antipsychotic medication increase Info Percent of short-stay residents who newly received an antipsychotic medication 1.3%
13% better than Florida average

Florida average: 1.5%

Influenza Vaccine Info Percent of short-stay residents assessed and appropriately given the seasonal influenza vaccine 96.5%
In line with Florida average

Florida average: 94.7%

Breakdown by payment type

Medicare

33% of new residents, usually for short-term rehab.

Typical stay 26 days

Private pay

59% of new residents, often for short stays.

Typical stay 5 - 6 months

Medicaid

8% of new residents, often for long-term daily care.

Typical stay 1 years

Facility Characteristics

Source: CMS Long-Term Care Facility Characteristics (Data as of Jan 2026)

Total residents 54
Medicare
8
14.8% of residents
Medicaid
33
61.1% of residents
Private pay or other
13
24.1% of residents
Programs & Services
Residents Group

Residents meet regularly to discuss policies, care quality, and activities

CCRC

Part of a Continuing Care Retirement Community offering multiple care levels

Active Resident Council

Organized group of residents that meets regularly to discuss facility policies, quality of life, and activities.

Finances and operations

Based on CMS SNF Cost Report for fiscal year ending in 06/2024.

Nonprofit
Church Related
Net patient revenue Info Net patient revenue — what the home actually collects for resident care, after contractual allowances, bad debt and discounts are subtracted from its gross charges (CMS cost report, Worksheet G-3). It covers resident care only; money the home earns from other sources is shown separately as "Other income."
$18.6M
Net patient income Info Net patient income: net patient revenue minus the home's total operating expenses. A positive figure means it earns more from resident care than it spends to deliver it; a negative figure means the opposite. It excludes non-operating "other income."
-$2.6M
Nonprofit Church Related
Net patient revenue Info Net patient revenue — what the home actually collects for resident care, after contractual allowances, bad debt and discounts are subtracted from its gross charges (CMS cost report, Worksheet G-3). It covers resident care only; money the home earns from other sources is shown separately as "Other income."
$18.6M Rank #80 / 257Revenue — State benchmarkedThis home is ranked 80th out of 257 homes in Florida. Shows this facility's annual revenue compared to the Florida average. Higher revenue generally means more resources for staffing and capital — read alongside Payroll %.Rankings are based only on facilities in Florida that report data for that category. Facilities without available data are excluded from the ranking.Click the rank badge to see the full State ranking.Click here to see the full State ranking.
Net patient income Info Net patient income: net patient revenue minus the home's total operating expenses. A positive figure means it earns more from resident care than it spends to deliver it; a negative figure means the opposite. It excludes non-operating "other income."
-$2.6M
Other income Info Money the home earns outside of resident care — such as investments, grants, rentals and other non-operating sources (CMS cost report, Worksheet G-3). It is tracked separately from net patient revenue: it is not part of that figure, and it is not included in net patient income.
$2.1M
Payroll costs Info Staff salaries plus wage-related costs — benefits such as payroll taxes, health insurance and retirement — from the home's own accounting records (CMS cost report, Worksheet A). Contract or agency labor is counted separately, under other operating costs. Rank #66 / 257Payroll — State benchmarkedThis home is ranked 66th out of 257 homes in Florida. Shows total annual staff payroll benchmarked to the Florida average. Higher payroll investment relative to peers often signals better staffing and less reliance on cheaper contract labor.Rankings are based only on facilities in Florida that report data for that category. Facilities without available data are excluded from the ranking.Click the rank badge to see the full State ranking.Click here to see the full State ranking.
$10.3M 55.2% of net patient revenue Info Payroll as a share of revenue: staff salaries and wage-related benefits divided by net patient revenue. A higher figure means more of each revenue dollar goes to staff pay. Rank #140 / 257Payroll % — State benchmarkedThis home is ranked 140th out of 257 homes in Florida. Shows payroll as a percentage of revenue versus the Florida average. Well-run Florida facilities typically land around 49–56% — the top third Statewide. Below 25% may signal understaffing or heavy agency use — read with Staffing ratings.Rankings are based only on facilities in Florida that report data for that category. Facilities without available data are excluded from the ranking.Click the rank badge to see the full State ranking.Click here to see the full State ranking.
Other operating costs Info Everything it costs to run the home apart from payroll — food, utilities, supplies, maintenance, contract labor and administration. Calculated as total operating expense minus payroll (staff salaries and wage-related benefits).
$10.9M
Total costs Info The home's total operating expense for the year — all the costs of running it, salaries included (CMS cost report, Worksheet G-3).
$21.2M

What does this home offer?

Housing options icon

Housing Options: Studio / 1 Bed / 2 Bed

Building type icon
Building type icon

Building Type: High-rise

Beauty services icon

Beauty Services

Transportation services icon

Transportation Services

Social and recreational activities icon

Social and Recreational Activities

Exercise program icon

Exercise Programs

Swimming pool icon
Swimming pool icon

Swimming Pool

Who this home usually serves

TYPE OF STAY

Mix of rehab and long-term care

This home supports both short-term rehab and long-term care, with residents staying for a wide range of durations.

Most new residents arrive under private pay (59% of admissions), and a typical private pay stay runs around 5 - 6 months.

Admissions
384 total

Coverage residents most often arrive under.

Medicare 33%
Private pay 59%
Medicaid 8%
Discharges
470 total

Coverage residents most often leave under.

Medicare 30%
Private pay 65%
Medicaid 5%

Activities in this home

Places of interest near Concordia Village of Tampa

Address 8.6 miles from city center Info Estimated distance in miles from Tampa's city center to Concordia Village of Tampa's address, calculated via Google Maps.

Calculate Travel Distance to Concordia Village of Tampa

Add your location

Address

Compare Nursing Homes around Tampa

2 facilities compared · CMS & FL Dept. of Health data

Canterbury Tower
NH
AL
IL
RC
Tampa (South Tampa)
17
Facility 17
FL AVG 89
Rank #889 / 1074
100.0%
Facility 100.0%
FL AVG 84.3%
Rank #1 / 258
+19%
6.47
Facility 6.47
FL AVG 4.04
Rank #3 / 253
-6%+60%
$0
Facility $0
FL AVG $78.9k
Rank #1 / 258
95
Facility 95
FL AVG 83
Rank #128 / 876
6
Facility 6
FL AVG 19.7
Rank #23 / 252
3.0
Facility 3.0
FL AVG 4.5
Rank #53 / 252
-32A+
56
Facility 56
FL AVG 40
Rank #407 / 1486
Caridad Vinas
$3.4M
Facility $3.4M
FL AVG $15.7M
Rank #181 / 257
$4.8M
Facility $4.8M
FL AVG $6.1M
Rank #206 / 257
142.4%
Facility 142.4%
FL AVG 39.8%
Rank #162 / 257
105326
Concordia Village of Tampa
NH
IL
Tampa
175
Facility 175
FL AVG 89
Rank #84 / 1074
44.7%
Facility 44.7%
FL AVG 84.3%
Rank #250 / 258
-47%
3.72
Facility 3.72
FL AVG 4.04
Rank #175 / 253
-33%-8%
$16.8k
Facility $16.8k
FL AVG $78.9k
Rank #195 / 258
78
Facility 78
FL AVG 83
Rank #613 / 876
36
Facility 36
FL AVG 19.7
Rank #238 / 252
9.0
Facility 9.0
FL AVG 4.5
Rank #245 / 252
1116-
23
Facility 23
FL AVG 40
Rank #1034 / 1486
Concordia Care Network
$18.6M
Facility $18.6M
FL AVG $15.7M
Rank #80 / 257
$10.3M
Facility $10.3M
FL AVG $6.1M
Rank #66 / 257
55.2%
Facility 55.2%
FL AVG 39.8%
Rank #140 / 257
105351

Financial Assistance for
Nursing Home in Florida

Concordia Village of Tampa is located in Tampa, Florida.
Here are the financial assistance programs available to residents in Florida.

Get Financial aid guidance

Long-Term Care Waiver

Florida Medicaid LTC Waiver

Age 65+ or 21+ disabled
General Florida resident, Medicaid- eligible, nursing home-level care need.
Income Limits (2025) ~$2,829/month 300% FBR, individual
Asset Limits $2,000 (individual), $3,000 (couple).
FL

High demand; waitlists common.

Benefits
In-home care (6-8 hours/day) Assisted living Respite (240 hours/year) Case management

Community Care for the Elderly (CCE)

Florida CCE

Age 60+
General Florida resident, at risk of nursing home.
Income Limits ~$2,000/month varies
Asset Limits $5,000 individual
FL

Limited funding; regional variation.

Benefits
Homemaker services (3-5 hours/week) Adult day care (~$60/day) Respite (up to 10 days/year)

Home Care for the Elderly (HCE)

Florida Home Care for the Elderly

Age 60+
General Florida resident, at risk of nursing home placement; caregiver must be approved.
Income Limits (2025) ~$2,829/month individual, aligned with Medicaid thresholds
Asset Limits ~$2,000 (individual); varies by case manager discretion.
FL

Limited funding (~3,500 served annually); prioritizes low-income frail seniors.

Benefits
Basic subsidy (~$160/month) for housing/medical costs; special subsidies for supplies/services (e.g., incontinence supplies, ~$50-$200/month)

Program of All-Inclusive Care for the Elderly (PACE)

Florida Medicaid PACE

Age 55+
General Florida resident, nursing home-level care need, safe with PACE support.
Income Limits (2025) ~$2,829/month 300% FBR
Asset Limits $2,000 (individual), $3,000 (couple).
FL

Limited to specific counties (e.g., Hillsborough, Miami-Dade); ~10 sites statewide.

Benefits
Personal care (5-7 hours/day) Medical care Meals Transportation Therapy

Optional State Supplementation (OSS)

Florida Optional State Supplementation

Age 65+ or disabled
General Florida resident, living in approved facility, receiving SSI or low-income.
Income Limits (2025) ~$1,004/month individual, including SSI
Asset Limits $2,000 (individual), $3,000 (couple).
FL

Limited to specific facility types; ~$78.40/month max supplement.

Benefits
Cash payment (~$78.40/month) for room/board or personal needs in facilities

Frequently Asked Questions about Concordia Village of Tampa

What languages are spoken at Concordia Village of Tampa?

The team at Concordia Village of Tampa speaks English.

Who is the owner of Concordia Village of Tampa?

Concordia Village of Tampa is legally operated by Fletcher Fl Al, Llc, and administered by Tracy Lynn Johnson.

Is Concordia Village of Tampa in a walkable area?

Concordia Village of Tampa has a walk score of 23. Car-dependent. Most errands require a car, with limited nearby walkable options.

What is the license number of Concordia Village of Tampa?

According to FL state health department records, Concordia Village of Tampa's license number is 4110.

When does Concordia Village of Tampa's license expire?

According to FL state health department records, Concordia Village of Tampa's license expires on July 8, 2026.

What is the occupancy rate at Concordia Village of Tampa?

Concordia Village of Tampa's occupancy is 45%.

What payment types does Concordia Village of Tampa accept?

Concordia Village of Tampa accepts Insurance and/or HMO, Medicaid, and VA.

Guides for Better Senior Living

Care Cost Calculator: See Prices in Your Area

Nursing Home Data Explorer

Don’t Wait Too Long: 7 Red Flag Signs Your Parent Needs Assisted Living Now

The True Cost of Assisted Living in 2025 – And How Families Are Paying For It

Understanding Senior Living Costs: Pricing Models, Discounts & Financial Assistance