Conover Nursing & Rehab Center
Nursing Home, Memory Care & Respite Care · Conover, NC
CMS overall rating Info CMS (the Centers for Medicare & Medicaid Services) is the federal agency that rates nursing home quality. Its Overall Rating runs from 1 to 5 stars, combining health inspections, staffing, and quality measures, with inspections weighted most heavily.

Conover Nursing & Rehab Center

Nursing Home, Memory Care & Respite Care · Conover, NC
CMS overall rating Info CMS (the Centers for Medicare & Medicaid Services) is the federal agency that rates nursing home quality. Its Overall Rating runs from 1 to 5 stars, combining health inspections, staffing, and quality measures, with inspections weighted most heavily.
Calculator: See prices in your area
Conover Nursing & Rehab Center accepts Medicare, Medicaid, and private pay.

Overview of Conover Nursing & Rehab Center

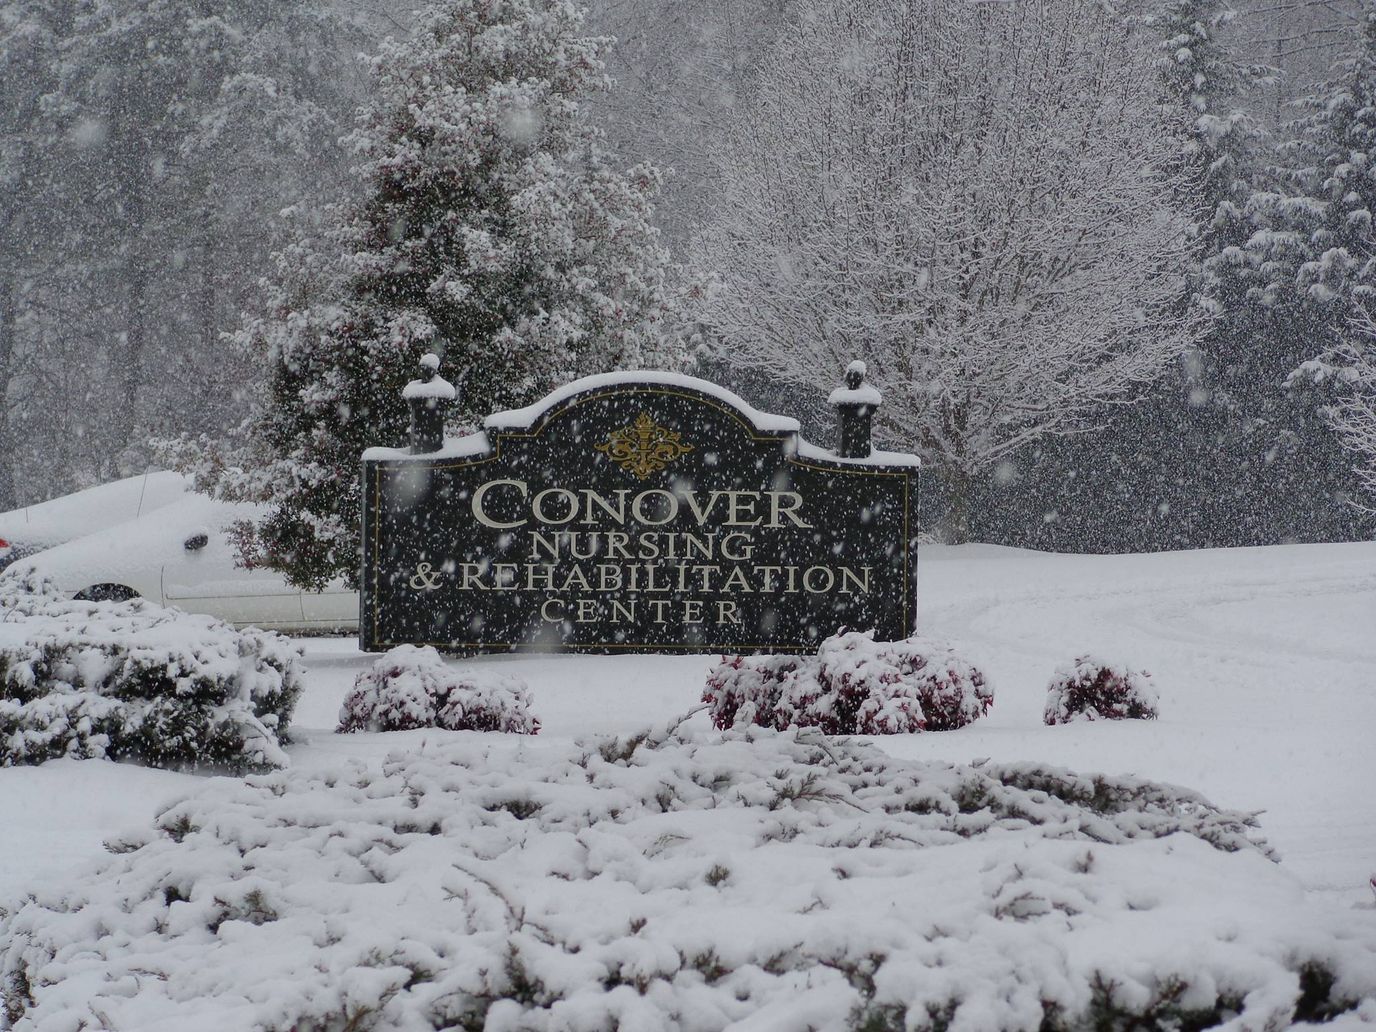
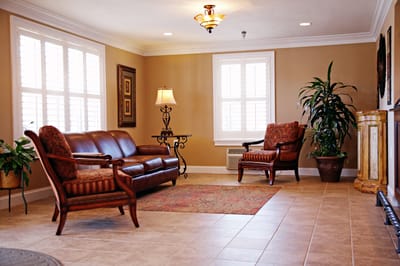
Conover Nursing & Rehab Center is a family-owned nursing home in Conover, NC, offering rehabilitation and skilled nursing. With a compassionate and nurturing environment, the community ensures older adults have a comfortable stay. Residents also experience a worry-free lifestyle with 24-hour care, well-balanced meals, and transportation services. The community also goes above and beyond to get to know residents’ unique needs and habits to provide the best possible care for their recovery and wellness.

Sensory stimulation, light exercises, and celebrations help enhance residents’ cognition and encourage them to live actively. With spacious common areas and state-of-the-art rehabilitation equipment, residents can rest and move around comfortably. Residents also experience a laid-back lifestyle, as it is conveniently located in the quiet residential area of Conover. This nursing home is a good option for senior living in North Carolina, especially with its commitment to helping older adults return to their routines.

Quality ratings

Measured by Centers for Medicare & Medicaid Services (CMS)

Overall rating Info The Overall CMS Rating combines results from health inspections, staffing levels and quality measures. Health inspections carry the most weight. Staffing and quality scores can increase or decrease the final rating based on performance compared to state and national standards.
▲ 78.8% Above NC avg. ▲ 78.8% Above NC avg.NC average: 2.8Click the badge to see the full State ranking.Click here to see the full State ranking.
Health Inspection Info Based on the results of the facility's three most recent standard inspections and any complaint investigations. CMS reviews the number, scope, and severity of deficiencies, with more recent findings weighted more heavily.
▲ 77.0% Above NC avg. ▲ 77.0% Above NC avg.NC average: 2.8Click the badge to see the full State ranking.Click here to see the full State ranking.
Staffing Info Measures average nursing staff hours per resident per day, including Registered Nurses (RNs) and total nursing staff. Ratings are adjusted based on the level of care residents require and are compared to state and national benchmarks.
▲ 50.4% Above NC avg. ▲ 50.4% Above NC avg.NC average: 2.7Click the badge to see the full State ranking.Click here to see the full State ranking.
Quality Measures Info Based on clinical and physical health indicators reported to CMS, such as hospital readmissions, falls, pressure ulcers, and improvements in mobility. These measures reflect how well residents' health needs are being managed.
▲ 26.0% Above NC avg. ▲ 26.0% Above NC avg.NC average: 3.2Click the badge to see the full State ranking.Click here to see the full State ranking.

Staffing hours breakdown

Info Daily nursing hours per resident by staff type, reported to CMS. Higher is generally better — compare this facility to state and national averages to see where staffing stands.

Hours per resident per day — compared to North Carolina state averages

Total nursing care / resident Info This home is ranked 29th out of 97 homes in North Carolina for nurse hours. Total adjusted nursing hours per resident per day, combining RN, LPN, and aide time. CMS adjusts this for case-mix so facilities can be fairly compared.
4h 33m per day
Rank #29 / 97Nurse hours — State benchmarkedThis home is ranked 29th out of 97 homes in North Carolina. Shows adjusted nurse hours per resident per day benchmarked to the North Carolina average, with a ranking across 97 North Carolina facilities. More hours mean more direct care. The national average is about 3.5 hrs; below 3.0 is a red flag.Rankings are based only on facilities in North Carolina that report data for that category. Facilities without available data are excluded from the ranking.Click the rank badge to see the full State ranking.Click here to see the full State ranking.
This facility North Carolina avg (3h 59m per day)
vs North Carolina avg
+14%

2 of 6 metrics below state avg

Standout metric Nurse Aide is +38% above state avg
Staff typeHours / Day / Residentvs state avg
Registered Nurse (RN) Info RNs hold the highest nursing license and can assess residents, interpret test results, and direct care plans. More RN hours per day often signals stronger clinical oversight and faster response to health changes. 39m per day ▲ 6% State avg: 37m per day · National avg: 41m per day
LPN / LVN Info Licensed Practical Nurses (LPNs) or Licensed Vocational Nurses (LVNs) deliver routine hands-on care — medication administration, wound dressing, and monitoring vital signs. They work under RN supervision and make up a large share of daily bedside care. 53m per day ■ Avg State avg: 53m per day · National avg: 52m per day
Nurse Aide Info Certified Nurse Aides (CNAs) provide the most direct day-to-day assistance: bathing, dressing, feeding, and mobility. Nurse aide hours are typically the largest staffing category and directly affect residents' quality of life. 3h 13m per day ▲ 38% State avg: 2h 19m per day · National avg: 2h 20m per day
Weekend Total Nursing Info Combined nursing hours (RN + LPN + Nurse Aide) per resident per day on weekends. Staffing often drops on weekends — this figure reveals whether the facility maintains adequate coverage outside of weekday hours. 4h 4m per day ▲ 19% State avg: 3h 26m per day · National avg: 3h 27m per day
Physical Therapist Info Hours per resident per day provided by licensed Physical Therapists (PTs) or PT Assistants. PT services help residents recover mobility after injury or illness and are especially important for post-acute (short-stay) rehabilitation. 4m per day ▼ 31% State avg: 5m per day · National avg: 4m per day
Weekend RN Info Registered nurse hours specifically on weekends. Facilities sometimes reduce RN presence on Saturdays and Sundays — a low weekend RN figure compared to weekday hours can indicate reduced clinical oversight when most administrative staff are absent. 22m per day ▼ 8% State avg: 24m per day · National avg: 29m per day

Capacity and availability

This home usually has availability

Lower occupancy than the North Carolina average: 76.4%
Occupancy rate
71.7% Rank #143 / 271Occupancy rate — State benchmarkedThis home is ranked 143rd out of 271 homes in North Carolina. Shows this facility's occupancy rate versus the North Carolina average, with its Statewide rank out of 271. Higher occupancy signals strong local demand and financial stability.Rankings are based only on facilities in North Carolina that report data for that category. Facilities without available data are excluded from the ranking.Click the rank badge to see the full State ranking.Click here to see the full State ranking.
Avg. Length of Stay
81 days
Bed community size
90-bed community Rank #119 / 390Bed count — State benchmarkedThis home is ranked 119th out of 390 homes in North Carolina. Shows this facility's certified or reported bed count compared to other North Carolina facilities. Larger communities may offer more amenities, programs, and on-site services for residents and families.Rankings are based only on facilities in North Carolina that report data for that category. Facilities without available data are excluded from the ranking.Click the rank badge to see the full State ranking.Click here to see the full State ranking.
A larger shared setting that may offer more common spaces and organized community services.
Walk Score
Walk Score: 59 / 100 Rank #76 / 572Walk Score — State benchmarkedThis home is ranked 76th out of 572 homes in North Carolina. Shows how walkable this facility's neighborhood is compared to the average Walk Score across North Carolina facilities. Higher scores benefit residents, families, and staff.Rankings are based only on facilities in North Carolina that report data for that category. Facilities without available data are excluded from the ranking.Click the rank badge to see the full State ranking.Click here to see the full State ranking.
Moderately walkable. Some errands can be accomplished on foot, with a mix of nearby amenities.

Contact Conover Nursing & Rehab Center

Staffing Data

Reporting period: October 1 – December 31, 2025 (Q4 2025). Source: CMS Payroll-Based Journal report.

Total staff 121
Employees 115
Contractors 6
Staff to resident ratio 1.64 : 1
9% fewer staff per resident than North Carolina average
North Carolina average ratio: 1.80 : 1 North Carolina average ratio: 1.80 : 1See full North Carolina ranking
Avg staff/day 53
Average shift 7.8 hours
0% compared with North Carolina average
North Carolina average: 8 hours North Carolina average shift: 8 hoursSee full North Carolina ranking
Total staff hours (quarter) 37,851

Nursing staff breakdown

Q4 2025 · Oct 1 – Dec 31 More info This data comes from the CMS Payroll-Based Journal report covering October 1 – December 31, 2025.
Registered Nurse

Manages medical care and health needs.

RN Staff Info All 10 RN Staff are full-time employees. No contractors work on this role. 10
Average shift length Info Average shift length. Calculated as total hours divided by days worked and average staff per day. 10 hours
Licensed Practical Nurse

Assists with medical care and medications.

LPN Staff Info All 15 LPN Staff are full-time employees. No contractors work on this role. 15
Average shift length Info Average shift length. Calculated as total hours divided by days worked and average staff per day. 9.5 hours
Certified Nursing Assistant

Helps with daily care and mobility.

CNA Staff Info All 59 CNA Staff are full-time employees. No contractors work on this role. 59
Average shift length Info Average shift length. Calculated as total hours divided by days worked and average staff per day. 7.3 hours

Contractor staffing

Q4 2025 · Oct 1 – Dec 31 More info This data comes from the CMS Payroll-Based Journal report covering October 1 – December 31, 2025.

Total hours from contractors

1.1%

426 contractor hours this quarter

Feeding Assistant: 3 Medical Director: 1 Occupational Therapy Aide: 1 Occupational Therapy Assistant: 1

Staff by category

Q4 2025 · Oct 1 – Dec 31 More info This data comes from the CMS Payroll-Based Journal report covering October 1 – December 31, 2025.
Certified Nursing Assistant5905919,95092100%7.3
Licensed Practical Nurse150156,21692100%9.5
Registered Nurse100102,77992100%10
Medication Aide/Technician6062,60892100%8.1
Clinical Nurse Specialist4041,3226975%8
Qualified Social Worker3037436773%6.4
Mental Health Service Worker1015386874%7.9
Administrator1015206571%8
Dietitian1014716166%7.7
Nurse Practitioner1014636065%7.7
Respiratory Therapy Technician4044296470%6.5
Speech Language Pathologist3034266773%5.8
Physical Therapy Aide3034006672%5.9
Physical Therapy Assistant3033926672%5.7
Feeding Assistant0332914650%4.6
Other Dietary Services Staff1011692628%6.5
Medical Director011561314%4.3
Occupational Therapy Assistant0114867%8
Occupational Therapy Aide011311213%2.6
59 Certified Nursing Assistant
% of Days 100%
15 Licensed Practical Nurse
% of Days 100%
10 Registered Nurse
% of Days 100%
6 Medication Aide/Technician
% of Days 100%
4 Clinical Nurse Specialist
% of Days 75%
3 Qualified Social Worker
% of Days 73%
1 Mental Health Service Worker
% of Days 74%
1 Administrator
% of Days 71%
1 Dietitian
% of Days 66%
1 Nurse Practitioner
% of Days 65%
4 Respiratory Therapy Technician
% of Days 70%
3 Speech Language Pathologist
% of Days 73%
3 Physical Therapy Aide
% of Days 72%
3 Physical Therapy Assistant
% of Days 72%
3 Feeding Assistant
% of Days 50%
1 Other Dietary Services Staff
% of Days 28%
1 Medical Director
% of Days 14%
1 Occupational Therapy Assistant
% of Days 7%
1 Occupational Therapy Aide
% of Days 13%

Penalties and fines

Federal penalties imposed by CMS for regulatory violations, including civil money penalties (fines) and denials of payment for new Medicare/Medicaid admissions.

Source: CMS Penalties Database

No penalties in the past 3 years

No civil money penalties or payment denials were reported in the last 3 years.

Quality of care over time

These measures show how residents usually do over time at this home, based on health outcomes and preventive care.

High-risk clinical events score Info A composite score based on pressure ulcers, falls with injury, weight loss, walking ability decline, and activities of daily living decline. 8.5
26% better than North Carolina average

North Carolina average: 11.5

Functional decline score Info A composite score based on activities of daily living decline, walking ability decline, and incontinence. 20.9
In line with North Carolina average

North Carolina average: 20.6

Long-stay resident measures
Need for Help with Daily Activities Increased Info Percent of long-stay residents whose need for help with daily activities has increased 12.6%
28% better than North Carolina average

North Carolina average: 17.5%

Walking Ability Worsened Info Percent of long-stay residents whose ability to move independently worsened 20.3%
13% better than North Carolina average

North Carolina average: 23.3%

Low Risk Residents with Bowel/Bladder Incontinence Info Percent of low risk long-stay residents who lose control of their bowels or bladder 29.7%
39% worse than North Carolina average

North Carolina average: 21.4%

Falls with Major Injury Info Percent of long-stay residents experiencing one or more falls with major injury 6.2%
71% worse than North Carolina average

North Carolina average: 3.6%

High Risk Residents with Pressure Ulcers Info Percent of long-stay high risk residents with pressure ulcers 0.7%
88% better than North Carolina average

North Carolina average: 6.3%

Urinary Tract Infection Info Percent of long-stay residents with a urinary tract infection 2.5%
In line with North Carolina average

North Carolina average: 2.6%

Lost Too Much Weight Info Percent of long-stay residents who lose too much weight 2.7%
63% better than North Carolina average

North Carolina average: 7.4%

Depressive Symptoms Info Percent of long-stay residents who have depressive symptoms 0.0%
100% better than North Carolina average

North Carolina average: 4.4%

Antipsychotic Use Info Percent of long-stay residents who received an antipsychotic medication 8.8%
35% better than North Carolina average

North Carolina average: 13.4%

Pneumococcal Vaccine Info Percent of long-stay residents assessed and appropriately given the pneumococcal vaccine 100.0%
9% better than North Carolina average

North Carolina average: 91.6%

Influenza Vaccine Info Percent of long-stay residents assessed and appropriately given the seasonal influenza vaccine 100.0%
6% better than North Carolina average

North Carolina average: 94.1%

Short-stay resident measures
Pneumococcal Vaccine Info Percent of short-stay residents assessed and appropriately given the pneumococcal vaccine 99.3%
24% better than North Carolina average

North Carolina average: 79.9%

Antipsychotic medication increase Info Percent of short-stay residents who newly received an antipsychotic medication 0.3%
81% better than North Carolina average

North Carolina average: 1.5%

Influenza Vaccine Info Percent of short-stay residents assessed and appropriately given the seasonal influenza vaccine 95.1%
22% better than North Carolina average

North Carolina average: 78.1%

Breakdown by payment type

Medicare

40% of new residents, usually for short-term rehab.

Typical stay 20 days

Private pay

53% of new residents, often for short stays.

Typical stay 1 - 2 months

Medicaid

7% of new residents, often for long-term daily care.

Typical stay 2 years

Facility Characteristics

Source: CMS Long-Term Care Facility Characteristics (Data as of Jan 2026)

Total residents 74
Medicare
8
10.8% of residents
Medicaid
48
64.9% of residents
Private pay or other
18
24.3% of residents
Programs & Services
Residents Group

Residents meet regularly to discuss policies, care quality, and activities

Nurse Aide Training

State-approved Nurse Aide Training and Competency Evaluation Program on-site

Active Resident Council

Organized group of residents that meets regularly to discuss facility policies, quality of life, and activities.

Finances and operations

Based on CMS SNF Cost Report for fiscal year ending in 09/2023.

For-profit
Corporation
Net patient revenue Info Net patient revenue — what the home actually collects for resident care, after contractual allowances, bad debt and discounts are subtracted from its gross charges (CMS cost report, Worksheet G-3). It covers resident care only; money the home earns from other sources is shown separately as "Other income."
$9.1M
Net patient income Info Net patient income: net patient revenue minus the home's total operating expenses. A positive figure means it earns more from resident care than it spends to deliver it; a negative figure means the opposite. It excludes non-operating "other income."
$42.8K
For-profit Corporation
Net patient revenue Info Net patient revenue — what the home actually collects for resident care, after contractual allowances, bad debt and discounts are subtracted from its gross charges (CMS cost report, Worksheet G-3). It covers resident care only; money the home earns from other sources is shown separately as "Other income."
$9.1M Rank #65 / 104Revenue — State benchmarkedThis home is ranked 65th out of 104 homes in North Carolina. Shows this facility's annual revenue compared to the North Carolina average. Higher revenue generally means more resources for staffing and capital — read alongside Payroll %.Rankings are based only on facilities in North Carolina that report data for that category. Facilities without available data are excluded from the ranking.Click the rank badge to see the full State ranking.Click here to see the full State ranking.
Net patient income Info Net patient income: net patient revenue minus the home's total operating expenses. A positive figure means it earns more from resident care than it spends to deliver it; a negative figure means the opposite. It excludes non-operating "other income."
$42.8K
Other income Info Money the home earns outside of resident care — such as investments, grants, rentals and other non-operating sources (CMS cost report, Worksheet G-3). It is tracked separately from net patient revenue: it is not part of that figure, and it is not included in net patient income.
$2.2M
Payroll costs Info Staff salaries plus wage-related costs — benefits such as payroll taxes, health insurance and retirement — from the home's own accounting records (CMS cost report, Worksheet A). Contract or agency labor is counted separately, under other operating costs. Rank #77 / 104Payroll — State benchmarkedThis home is ranked 77th out of 104 homes in North Carolina. Shows total annual staff payroll benchmarked to the North Carolina average. Higher payroll investment relative to peers often signals better staffing and less reliance on cheaper contract labor.Rankings are based only on facilities in North Carolina that report data for that category. Facilities without available data are excluded from the ranking.Click the rank badge to see the full State ranking.Click here to see the full State ranking.
$5.7M 62.4% of net patient revenue Info Payroll as a share of revenue: staff salaries and wage-related benefits divided by net patient revenue. A higher figure means more of each revenue dollar goes to staff pay. Rank #62 / 104Payroll % — State benchmarkedThis home is ranked 62nd out of 104 homes in North Carolina. Shows payroll as a percentage of revenue versus the North Carolina average. Well-run North Carolina facilities typically land around 49–62% — the top third Statewide. Below 25% may signal understaffing or heavy agency use — read with Staffing ratings.Rankings are based only on facilities in North Carolina that report data for that category. Facilities without available data are excluded from the ranking.Click the rank badge to see the full State ranking.Click here to see the full State ranking.
Other operating costs Info Everything it costs to run the home apart from payroll — food, utilities, supplies, maintenance, contract labor and administration. Calculated as total operating expense minus payroll (staff salaries and wage-related benefits).
$3.4M
Total costs Info The home's total operating expense for the year — all the costs of running it, salaries included (CMS cost report, Worksheet G-3).
$9.0M

What does this home offer?

Housing options icon

Housing Options: Private / Semi-Private Rooms

Building type icon
Building type icon

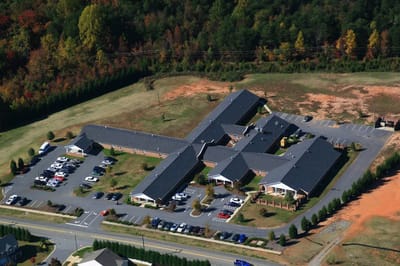
Building Type: Single-story

Transportation services icon

Transportation Services

Rehabilitative support icon

Rehabilitative Support

On-site medical care and health services icon

On-site Medical Care and Health Services

Who this home usually serves

TYPE OF STAY

Mix of rehab and long-term care

This home supports both short-term rehab and long-term care, with residents staying for a wide range of durations.

Most new residents arrive under private pay (53% of admissions), and a typical private pay stay runs around 1 - 2 months.

Admissions
292 total

Coverage residents most often arrive under.

Medicare 40%
Private pay 53%
Medicaid 7%
Discharges
290 total

Coverage residents most often leave under.

Medicare 33%
Private pay 58%
Medicaid 9%

Places of interest near Conover Nursing & Rehab Center

Address 920 4Th St Sw, Conover, NC 28613

Calculate Travel Distance to Conover Nursing & Rehab Center

Add your location

Address

Compare Nursing Homes around Newton

The information below is reported by the North Carolina Department of Health and Human Services, Division of Health Service Regulation.

2 facilities compared · CMS & NC Dept. of Health data

Conover Nursing & Rehab Center
NH
MC
RC
Conover (Tri-City)
90
Facility 90
NC AVG 72
Rank #119 / 390
71.7%
Facility 71.7%
NC AVG 76.4%
Rank #143 / 271
-6%
4.54
Facility 4.54
NC AVG 3.98
Rank #29 / 97
-9%+14%
$0
Facility $0
NC AVG $74.6k
Rank #1 / 105
4
Facility 4
NC AVG 20.9
Rank #12 / 101
4.0
Facility 4.0
NC AVG 5.0
Rank #49 / 101
-76-
59
Facility 59
NC AVG 33
Rank #76 / 572
Jason Sherrill
$9.1M
Facility $9.1M
NC AVG $13.2M
Rank #65 / 104
$5.7M
Facility $5.7M
NC AVG $4.9M
Rank #77 / 104
62.4%
Facility 62.4%
NC AVG 39.8%
Rank #62 / 104
345516
Greens at Hickory
NH
HC
MC
RC
Hickory (Lake Forest)
150
Facility 150
NC AVG 72
Rank #12 / 390
71.9%
Facility 71.9%
NC AVG 76.4%
Rank #142 / 271
-6%
3.98
Facility 3.98
NC AVG 3.98
Rank #43 / 97
-55%0%
$0
Facility $0
NC AVG $74.6k
Rank #1 / 105
16
Facility 16
NC AVG 20.9
Rank #59 / 101
5.3
Facility 5.3
NC AVG 5.0
Rank #73 / 101
-118-
59
Facility 59
NC AVG 33
Rank #76 / 572
Lasheena Webb
$13.6M
Facility $13.6M
NC AVG $13.2M
Rank #57 / 104
$6.1M
Facility $6.1M
NC AVG $4.9M
Rank #58 / 104
44.5%
Facility 44.5%
NC AVG 39.8%
Rank #37 / 104
345232

Financial Assistance for
Nursing Home in North Carolina

Conover Nursing & Rehab Center is located in Conover, North Carolina.
Here are the financial assistance programs available to residents in North Carolina.

Get Financial aid guidance

Community Alternatives Program for Disabled Adults

NC Medicaid CAP/DA

Age 65+ or disabled
General North Carolina resident, Medicaid- eligible, nursing home-level care need.
Income Limits (2025) ~$2,829/month 300% FBR, individual
Asset Limits $2,000 (individual), $3,000 (couple).
NC

High demand; waitlists common in urban areas.

Benefits
Personal care (5-7 hours/day) Respite (240 hours/year) Adult day care ($60/day) Home modifications ($1,500 avg.)

North Carolina Senior Care Options

NC SCO (via NFCSP)

Age Caregiver of someone 60+ (or with dementia)
General North Carolina resident.
Income Limits No strict limit; prioritizes low-income.
Asset Limits Not applicable.
NC

Limited slots; rural/urban balance.

Benefits
In-home respite (4-6 hours/day) Adult day care (~$60/day) Short-term facility care (up to 5 days)

Program of All-Inclusive Care for the Elderly (PACE)

North Carolina PACE (e.g., PACE of the Triad)

Age 55+
General NC resident (specific counties), NFLOC, safe with PACE support.
Income Limits (2025) ~$2,829/month (Medicaid-eligible); private pay option available.
Asset Limits $2,000 (individual), $3,000 (couple) for Medicaid enrollees.
NC

Available in 10+ counties (e.g., Guilford, Wake); multiple providers (e.g., PACE of the Southern Piedmont).

Benefits
Personal care (5-7 hours/day) Medical care Meals Transportation Respite Therapies

In-Home Aide Services

North Carolina In-Home Aide Services

Age 60+
General NC resident, unable to perform 1+ ADL, at risk of nursing home placement.
Income Limits (2025) No strict cap; prioritizes low-income ~$24,980/year
Asset Limits Not assessed; need-based.
NC

Family can be aides; varies by county funding.

Benefits
Personal care (5-20 hours/week) Meal prep Respite (~5 days/year) Errands

Medicare Savings Program (MSP)

North Carolina Medicare Savings Program

Age 65+ or disabled
General NC resident, Medicare Part A/B.
Income Limits (2025) ~$2,510/month (QMB), ~$3,380/month (SLMB), ~$3,598/month (QI)—individual.
Asset Limits $9,430 (individual), $14,130 (couple).
NC

Three tiers; no waitlist; includes Extra Help for Part D.

Benefits
Covers Part B premiums ($174.70/month) Deductibles ($240/year) Copays (~20%)

VA Aid and Attendance (A&A) and Housebound Benefits

North Carolina VA Aid and Attendance/Housebound

Age 65+ or disabled veteran/spouse
General NC resident, wartime service, need for ADL help (A&A) or homebound.
Income Limits (2025) Net income < ~$1,984/month (veteran with dependent, A&A); pension offsets income.
Asset Limits ~$155,356 net worth limit
NC

High veteran demand in rural/urban areas.

Benefits
Cash (~$1,433-$2,642/month veteran, ~$951-$1,318 spouse) for care costs (e.g., in-home, assisted living)

Urgent Repair Program (URP)

North Carolina Urgent Repair Program

Age 60+ prioritized
General NC resident, homeowner, low-income.
Income Limits (2025) ~$30,258/year 50% AMI, varies by county
Asset Limits Not strictly assessed; home value considered.
NC

Forgivable at $2,000/year; statewide via local partners.

Benefits
Repairs (~$8,000-$12,000 avg.) for safety (e.g., roofs, heating, accessibility)

State/County Special Assistance (SA)

North Carolina Special Assistance

Age 65+ (or disabled)
General NC resident, in licensed adult care home, low-income.
Income Limits (2025) ~$1,255/month (individual, 100% FPL); varies by facility rate.
Asset Limits $2,000 individual
NC

Covers assisted living; counties supplement state funds.

Benefits
Cash (~$1,200-$1,500/month) for room/board; Medicaid covers care services

Frequently Asked Questions about Conover Nursing & Rehab Center

What neighborhood is Conover Nursing & Rehab Center in?

Conover Nursing & Rehab Center is in the Tri-City neighborhood.

Is Conover Nursing & Rehab Center in a walkable area?

Conover Nursing & Rehab Center has a walk score of 59. Moderately walkable. Some errands can be accomplished on foot, with a mix of nearby amenities.

What is the occupancy rate at Conover Nursing & Rehab Center?

Conover Nursing & Rehab Center's occupancy is 71.7%.

Does Conover Nursing & Rehab Center operate as a for-profit or non-profit?

Conover Nursing & Rehab Center is registered as a for-profit.

Are there photos of Conover Nursing & Rehab Center?

Yes — there are 6 photos of Conover Nursing & Rehab Center in the photo gallery on this page.

What is the address of Conover Nursing & Rehab Center?

Conover Nursing & Rehab Center is located at 920 4Th St Sw, Conover, NC 28613.

What is the phone number of Conover Nursing & Rehab Center?

(828) 695-8282 will put you in contact with the team at Conover Nursing & Rehab Center.

Guides for Better Senior Living

Care Cost Calculator: See Prices in Your Area

Nursing Home Data Explorer

Don’t Wait Too Long: 7 Red Flag Signs Your Parent Needs Assisted Living Now

The True Cost of Assisted Living in 2025 – And How Families Are Paying For It

Understanding Senior Living Costs: Pricing Models, Discounts & Financial Assistance