Explore Open Rooms

1 Contact details
2 What type of senior care service are you looking for?
3 What budget do you have in mind for senior care?
4 How soon do you need to find care?
5 Additional details

Thank you for your interest!

Our team will be in touch shortly to help with next steps.

Nursing Home in Butte

CMS overall rating Info The Overall CMS Rating combines results from health inspections, staffing levels and quality measures. Health inspections carry the most weight. Staffing and quality scores can increase or decrease the final rating based on performance compared to state and national standards.

Copper Ridge Health and Rehab

3251 Nettie St, Butte, MT 59701 View map
Overview of Copper Ridge Health and Rehab

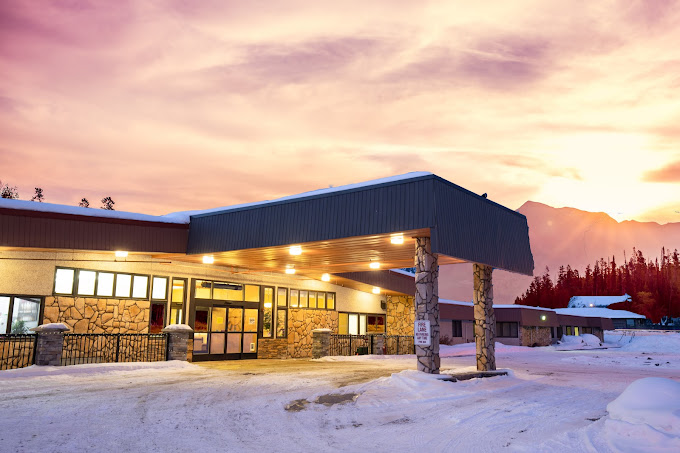
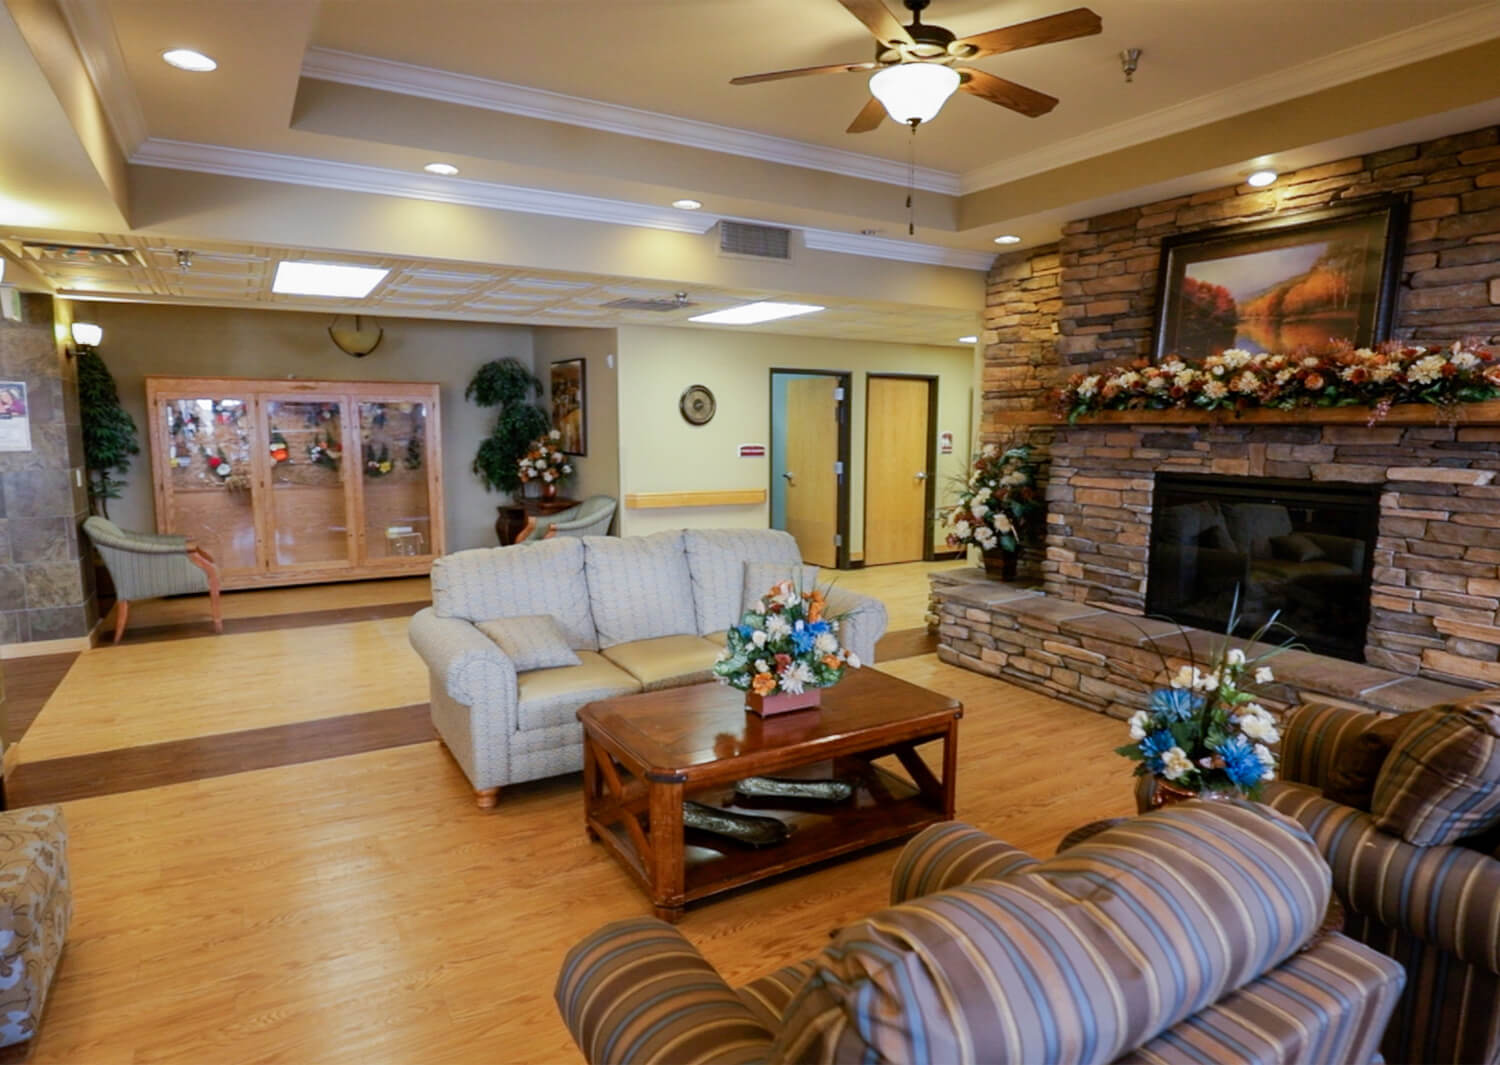
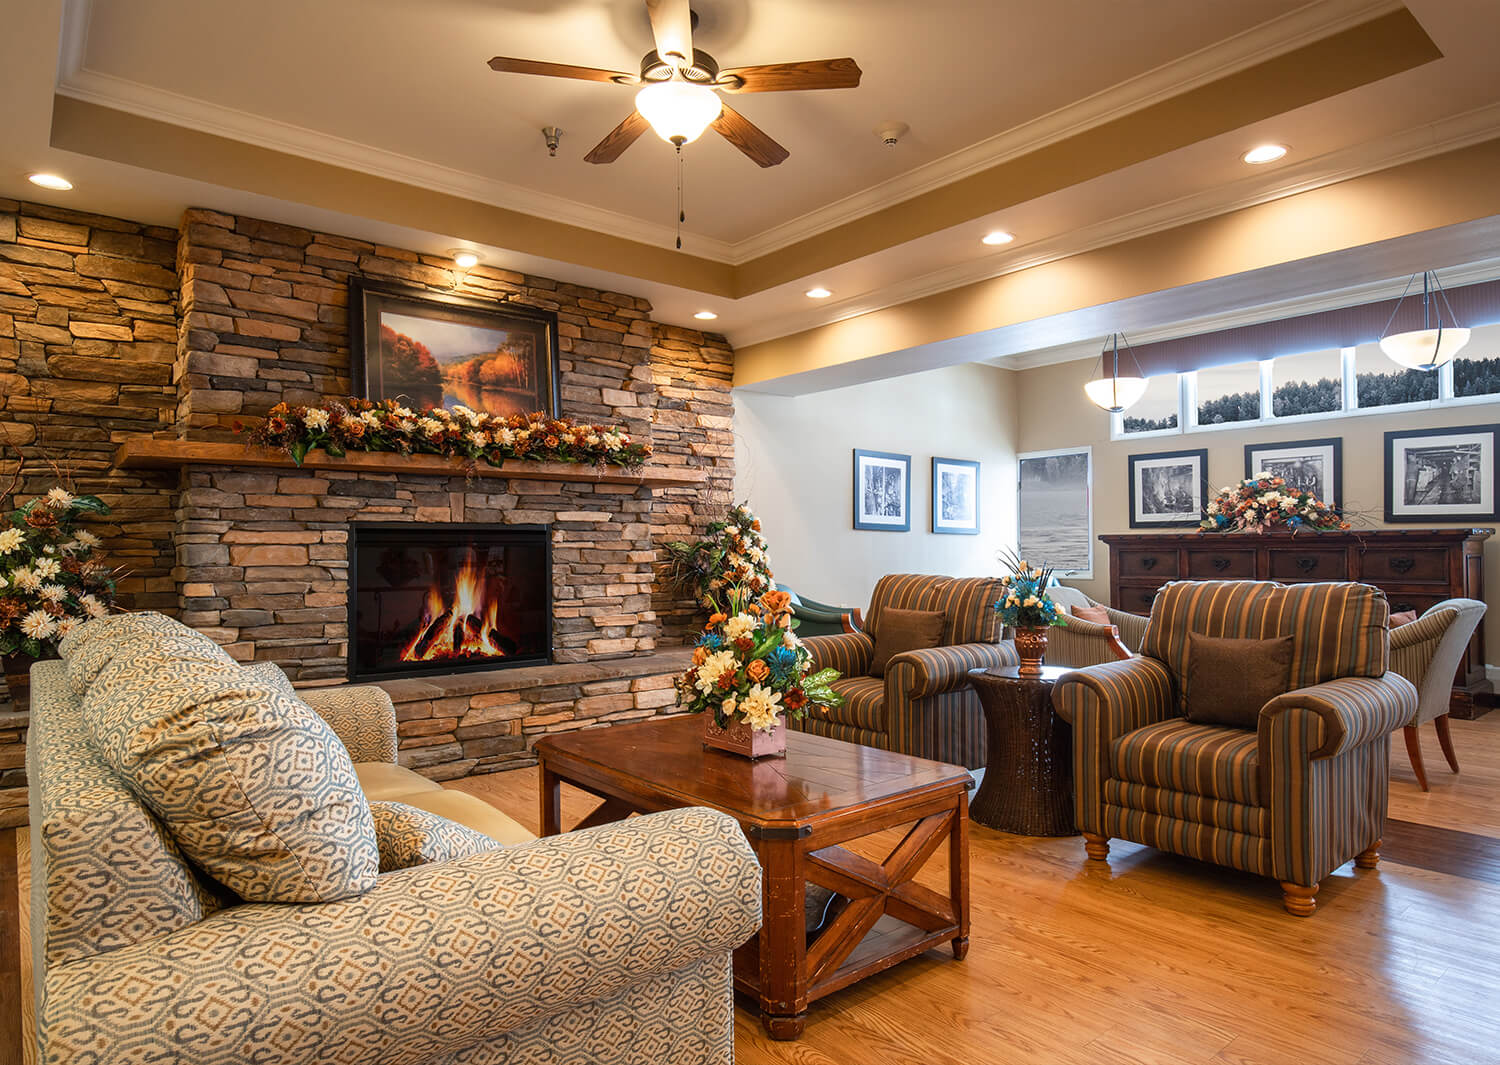
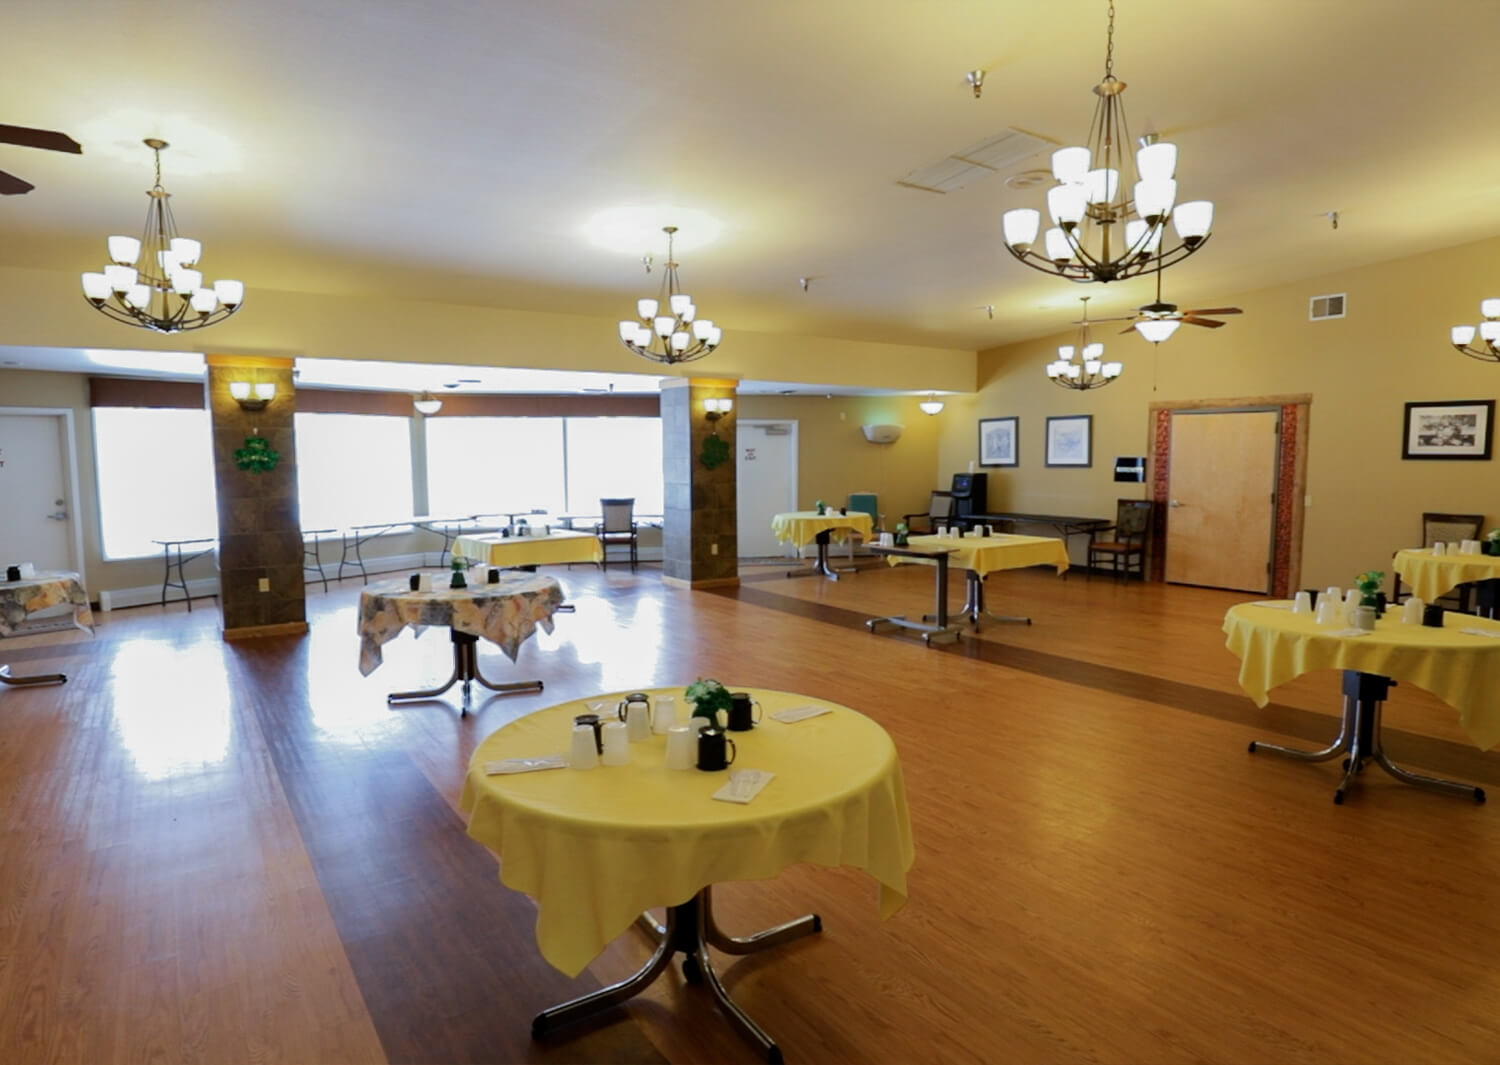
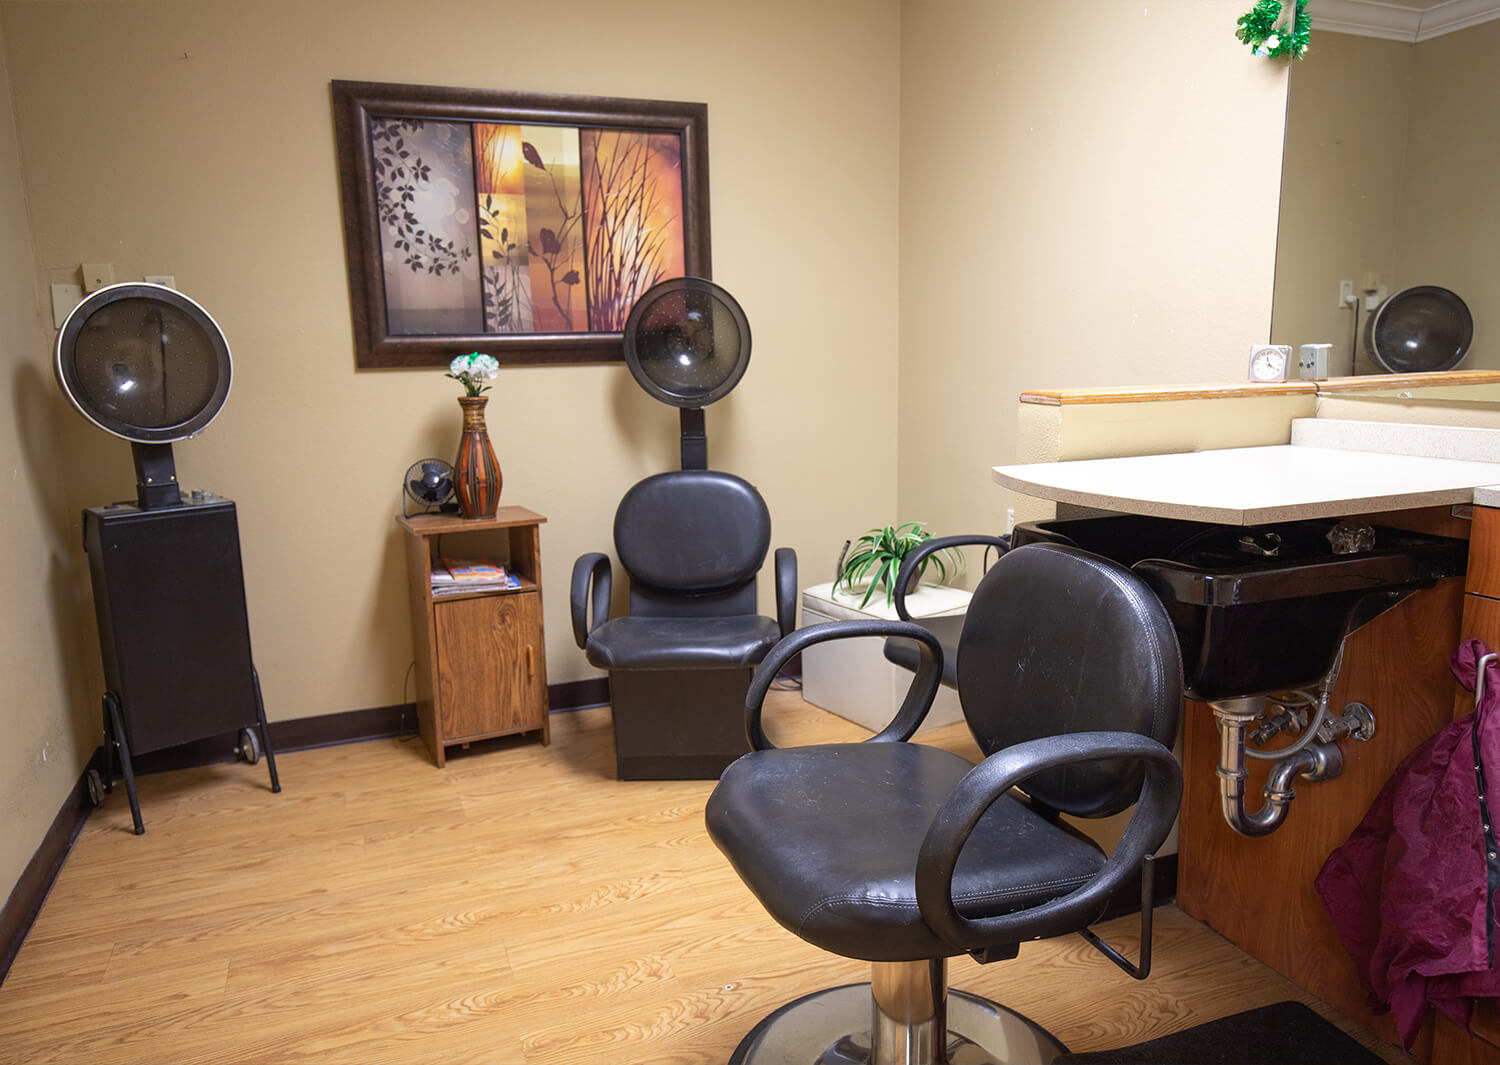
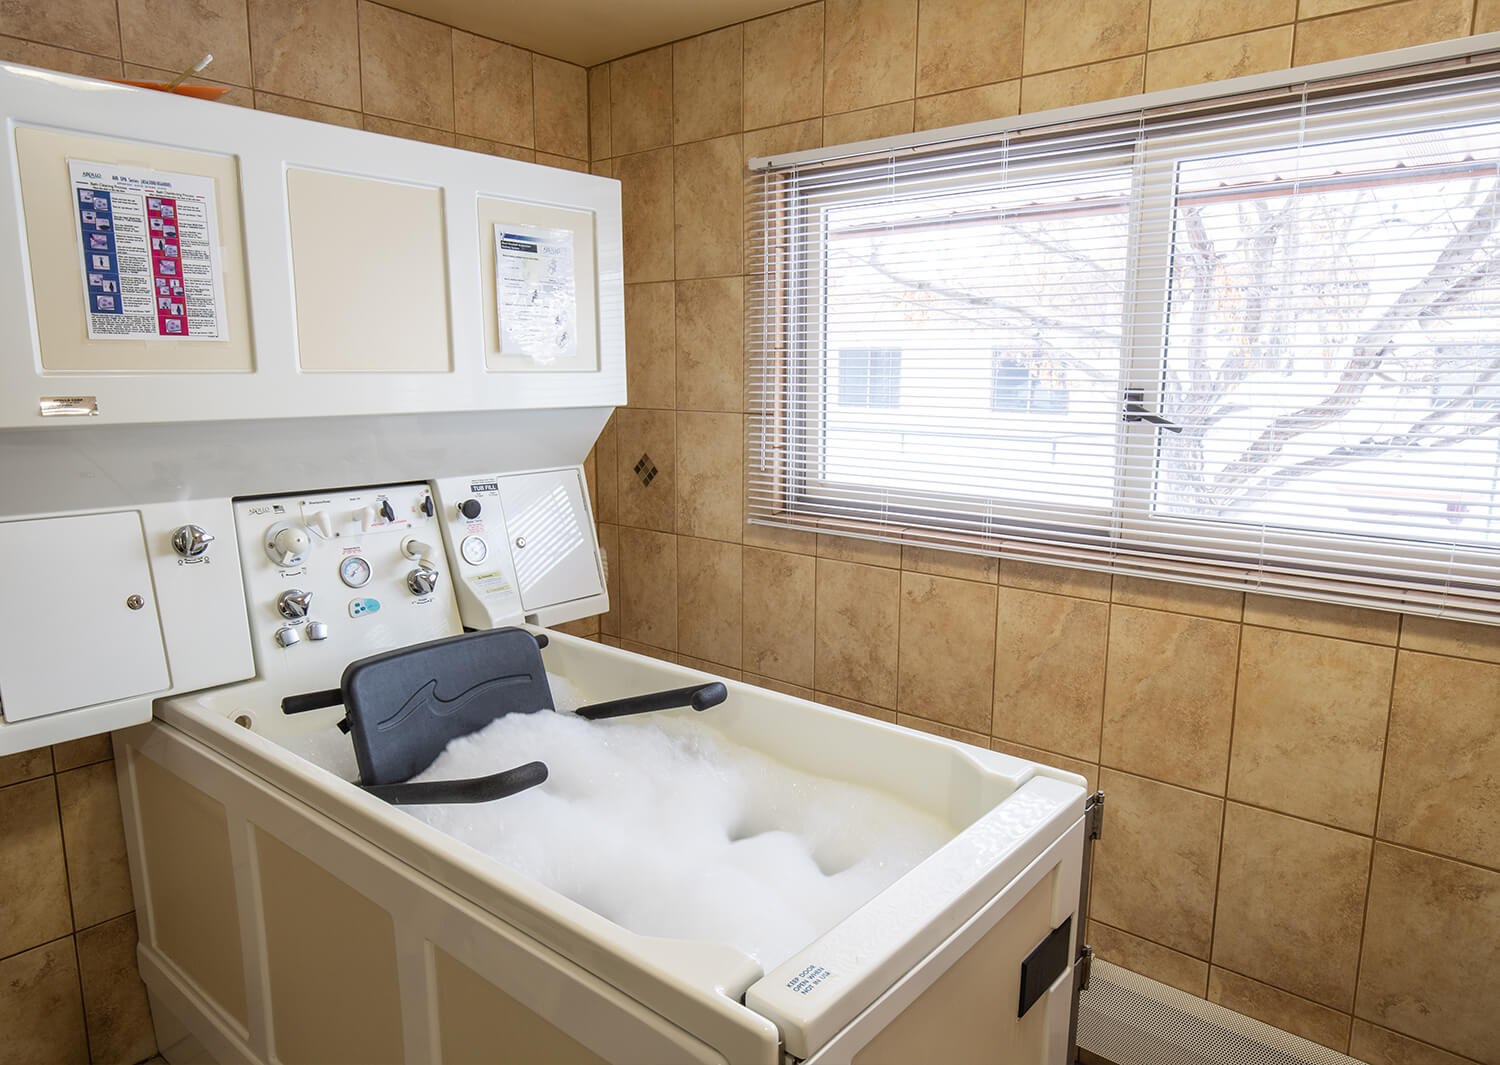
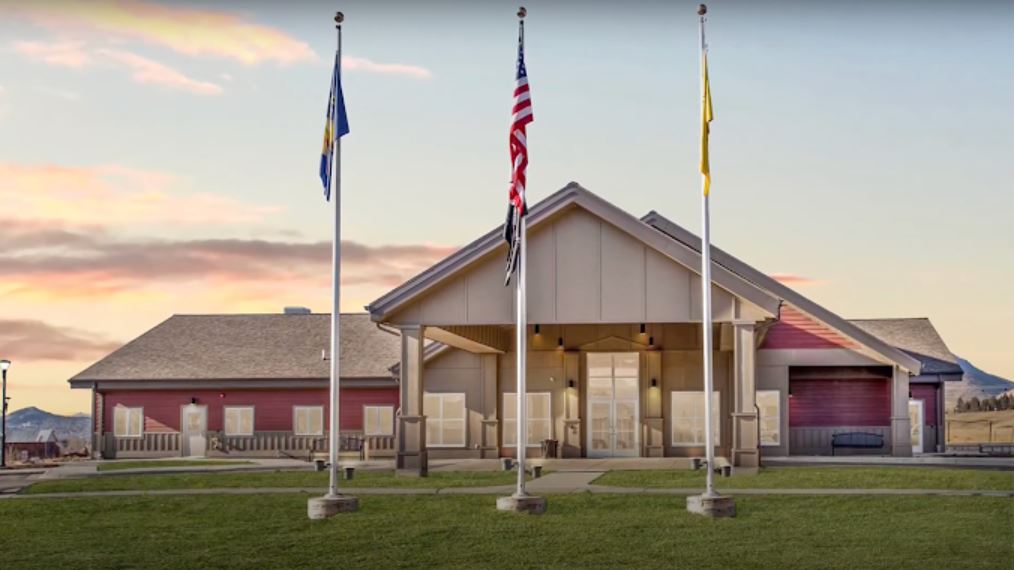
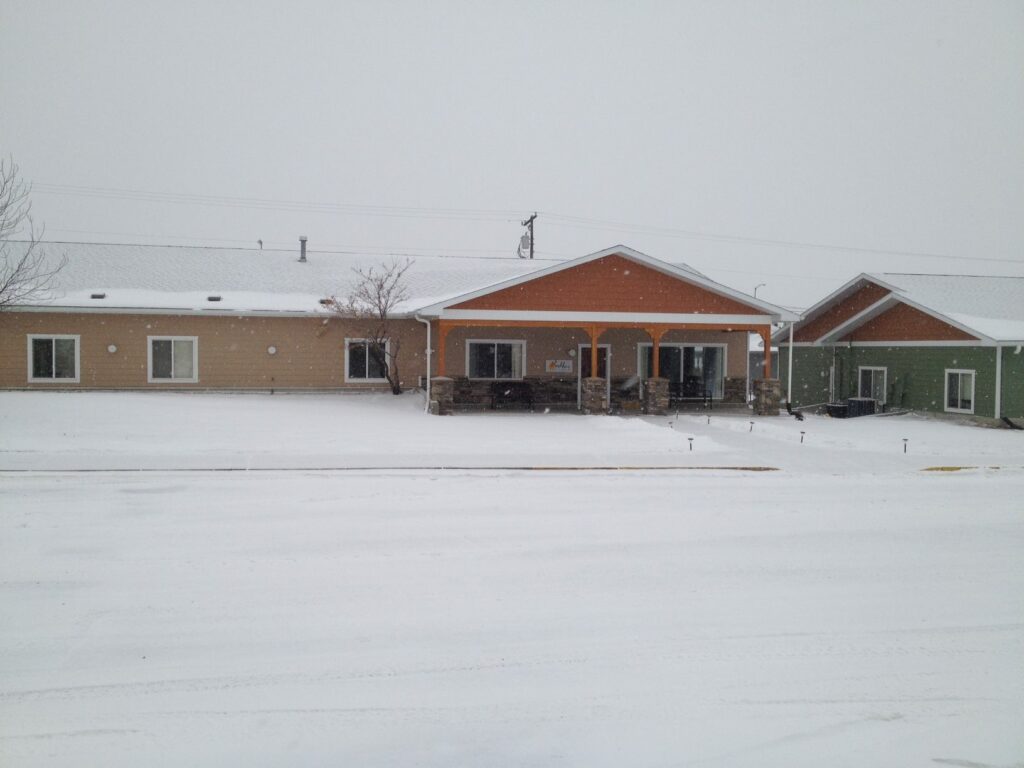
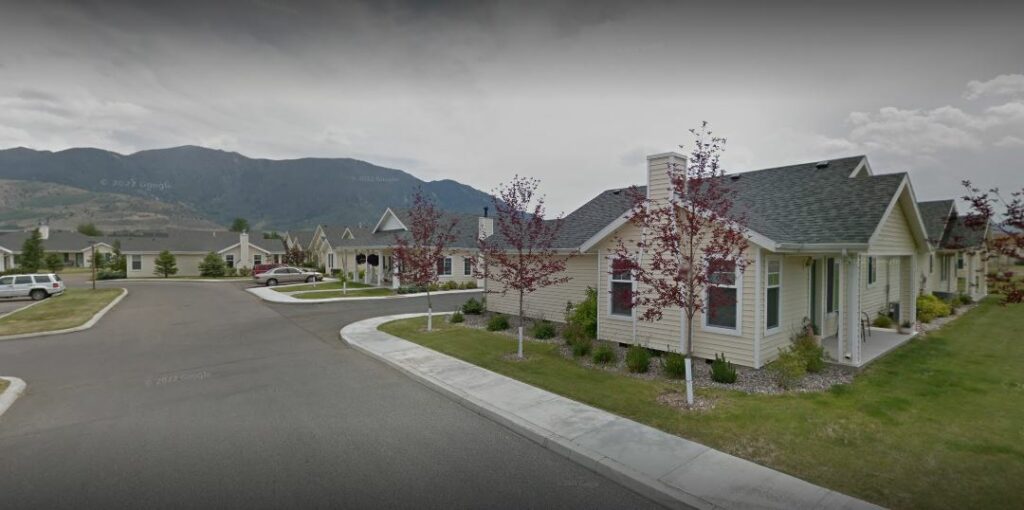
Copper Ridge Health and Rehab has established itself as a reliable cornerstone for comprehensive care, offering a wide spectrum of services from around-the-clock nursing to personalized physical therapy and physician oversight. Since its inception in 1974, this community has continuously evolved, embracing renovations and enhancements to keep pace with evolving standards. Housing a vibrant community of around 100 individuals, Copper Ridge has forged strong bonds with both local and out-of-state healthcare providers, ensuring a network of support that goes beyond its walls.

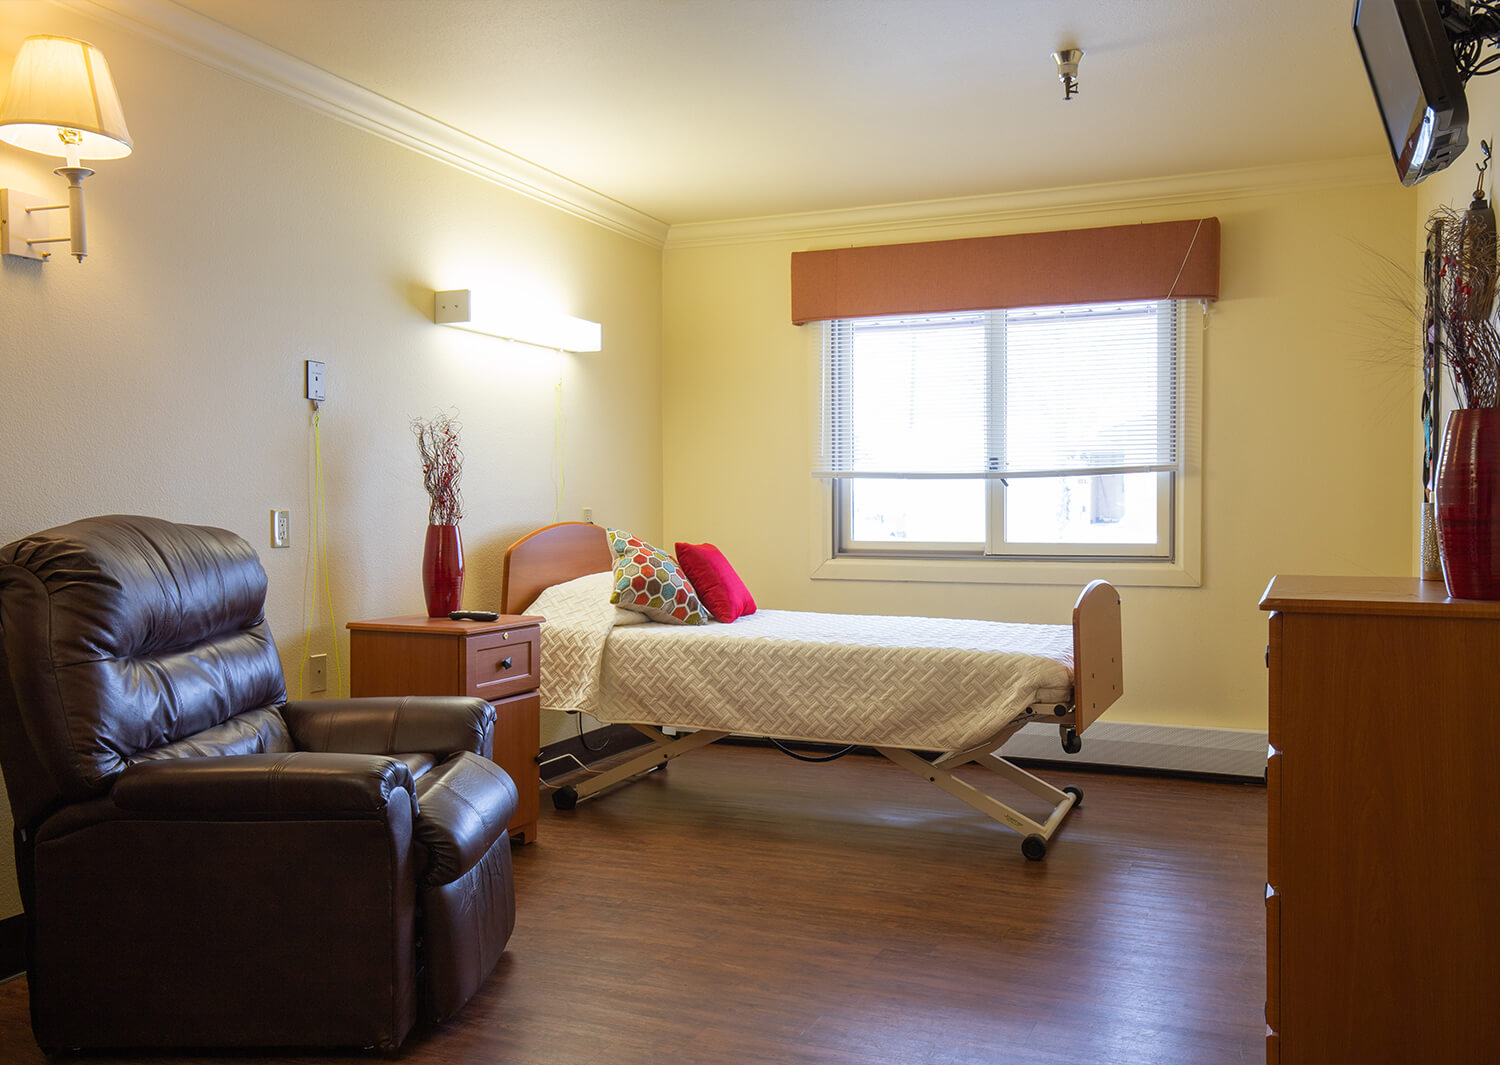
Residents are welcomed into the embrace of private rooms, relish deliciously crafted daily meals, and enjoy a genuine sense of belonging that turns their stay into a true homecoming. Notably, Copper Ridge’s commitment to transparency and accountability is shown through their adherence to nursing home quality measures. Situated in Butte, Montana, Copper Ridge Health and Rehab is not just a place of care, but a community that nurtures and uplifts seniors.

(406) 723-3225

Quality ratings

Measured by Centers for Medicare & Medicaid Services (CMS)

Overall rating Info The Overall CMS Rating combines results from health inspections, staffing levels and quality measures. Health inspections carry the most weight. Staffing and quality scores can increase or decrease the final rating based on performance compared to state and national standards.
3/5
Montana average: 2.8/5
Health Inspection Info Based on the results of the facility's three most recent standard inspections and any complaint investigations. CMS reviews the number, scope, and severity of deficiencies, with more recent findings weighted more heavily.
3/5
Montana average: 2.6/5
Staffing Info Measures average nursing staff hours per resident per day, including Registered Nurses (RNs) and total nursing staff. Ratings are adjusted based on the level of care residents require and are compared to state and national benchmarks.
3/5
Montana average: 2.9/5
Quality Measures Info Based on clinical and physical health indicators reported to CMS, such as hospital readmissions, falls, pressure ulcers, and improvements in mobility. These measures reflect how well residents' health needs are being managed.
3/5
Montana average: 3.0/5

Nursing care per resident

Info This shows how many total hours of nursing staff time are available per resident each day. Higher numbers usually mean more staff support.
3h 27m per day

This home provides 11% less nursing time per resident than the Montana average.

Montana average: 3h 54m per day

Staffing hours breakdown

Info Hours of care per resident per day, broken down by staff type. Data from CMS Medicare.
Staff type Facility State avg National avg
Registered Nurse (RN) Info Registered nurse hours per resident per day. 39m per day 56m per day 41m per day
Nurse Aide Info Nurse aide hours per resident per day. 1h 55m per day 2h 32m per day 2h 21m per day
Total Nursing (Weekend) Info Total number of nurse staff hours per resident per day on weekends. 2h 44m per day 3h 29m per day 3h 26m per day
Physical Therapist Info Physical therapist staff hours per resident per day. 13m per day 4m per day 4m per day
RN (Weekend) Info Registered nurse hours per resident per day on weekends. 29m per day 41m per day 29m per day

Capacity and availability

Medium-capacity home

Offers a balance of services and community atmosphere.

Total beds 186

This home usually has availability

Lower occupancy suggests more openings may be available.

Lower demand than the Montana average
Occupancy rate 33.7%
Residents per day (avg) 62
Occupancy rate
33.7%
Residents per day (avg)
62

Who this home usually serves

TYPE OF STAY

Mostly short-term rehab stays

Most residents typically stay for a few weeks or months before returning home or moving on.

Might be optimal for
Short stays Recovery Medicare-covered care

Breakdown by payment type

Medicare

59% of new residents, usually for short-term rehab.

Typical stay 1 - 2 months

Private pay

26% of new residents, often for short stays.

Typical stay 1 - 2 months

Medicaid

15% of new residents, often for long-term daily care.

Typical stay 1 - 2 years

Finances and operations

Privately-owned community
Home revenue
$10.5M
Profit
$39.1K
Privately-owned community
Home revenue
$10,496,108.00
Profit
$39,136.00
Payroll costs Info The portion of the home's budget spent on staff, including nurses, caregivers, and other employees who support care and operations.
$3.9M
36.8% of revenue
Other operating costs Info All remaining costs needed to run the home, such as food, utilities, building maintenance, supplies and administrative expenses.
$6.6M
Total costs $10.5M
Bed community size
186-bed community
A large-scale community that may provide a wide range of amenities, services, and structured programs.
Years in operation
1 year in operation
A newer community that may feature more recent facilities and programs.
Walk Score
Walk Score: 34 / 100
Somewhat walkable. A few nearby services may be reachable on foot, but most trips require transportation.

About this community

License details

Facility type
Long Term Care
Status Current
Issuance February 6, 2025
Expiration January 6, 2028

Additional licensing details

License number: 13571

Ownership & operating entity

Copper Ridge Health and Rehab is administrated by Schmidt, Amanda.

What does this home offer?

Minimum age icon
Minimum age icon

Minimum Age: 55

Building type icon
Building type icon

Building Type: Single story building

Types of Care at Copper Ridge Health and Rehab

Nursing Home Memory Care

Inspection History

In Montana, the Department of Public Health and Human Services, Quality Assurance Division is the state body responsible for inspecting and licensing all senior residential care facilities.

8 visits/inspections

5 visits/inspections triggered by complaints

2 routine inspections

Results

8 with issues

0 without issues

Latest inspection

Date April 10, 2025
Complaint Investigation

31 deficiencies

Deficiencies indicate regulatory issues. A higher number implies the facility had several areas requiring improvement.

Montana average: 21 deficiencies

Health Inspection History

Inspections
Total health inspections 7

Montana average 5.1


Last Health inspection on Apr 2025

Total health citations 27

Montana average 29.7

Citations per inspection
3.86

Montana average 5.72


Health citations are formal notices following inspections when they fail to comply with safety and care standards.

16 of 27 citations resulted from standard inspections; 10 of 27 resulted from complaint investigations; and 1 of 27 came from combined inspections (standard and complaint).

Breakdown of citation severity (last 3 years)
Critical Health citations More info 0
100% better than Montana average

Montana average: 0.3


Serious Health citations More info 3
36% worse than Montana average

Montana average: 2.2

0 critical citations More info Montana average: 0.3

3 serious citations More info Montana average: 2.2

24 moderate citations More info Montana average: 26.5

0 minor citations More info Montana average: 0.7
Citations history (last 3 years)
Infection Control moderate citation Info Issues related to preventing and controlling infections, including hygiene practices and safety protocols. Apr 10, 2025
Corrected

Quality of Care moderate citation Info Issues related to how well residents receive appropriate treatment and support for their medical and daily care needs. Apr 10, 2025
Corrected

Resident Rights moderate citation Info Issues related to resident's rights, including dignity, privacy, and the ability to make decisions about their care. Apr 10, 2025
Corrected

Resident Rights moderate citation Info Issues related to resident's rights, including dignity, privacy, and the ability to make decisions about their care. Mar 12, 2025
Corrected

Compare Memory Care around Butte The information below is reported by the Montana Department of Public Health and Human Services, Quality Assurance Division.

5 facilities compared · CMS & MT Dept. of Health data · Updated Apr 2026

Filter by care type
Southwest Montana Veteran’s Home
NH

Nursing Home Licensed facility providing 24/7 skilled nursing care for residents with complex, ongoing medical needs. Staffed by RNs, LPNs, and CNAs. Inspected and star-rated annually by CMS. Accepts Medicare (short-term rehab) and Medicaid (long-term care).

Butte
60
70.7%
+15%
6.78
+58%
+50%
1
18
6.0
1
49
14
-
$8.9M
$4.3M
48.7%
275156
-
Copper Ridge Health and Rehab
MC

Memory Care Secured, specialized care for people living with Alzheimer's or dementia. Staff trained in cognitive impairment, with higher staff-to-resident ratios and an environment designed to reduce confusion and wandering risk.

NH

Nursing Home Licensed facility providing 24/7 skilled nursing care for residents with complex, ongoing medical needs. Staffed by RNs, LPNs, and CNAs. Inspected and star-rated annually by CMS. Accepts Medicare (short-term rehab) and Medicaid (long-term care).

Butte
186
33.7%
-45%
3.45
+16%
-24%
2
27
3.9
3
62
34
Ramos, Brian
$10.5M
$3.9M
36.8%
275060
-
BeeHive Homes of Butte
-
AL

Assisted Living A licensed, long-term care setting for seniors or individuals with disabilities who need help with daily activities — like bathing, dressing, and medication management — but not 24-hour skilled nursing. Offers housing, meals, and around-the-clock support while aiming to maximize resident independence.

MC

Memory Care Secured, specialized care for people living with Alzheimer's or dementia. Staff trained in cognitive impairment, with higher staff-to-resident ratios and an environment designed to reduce confusion and wandering risk.

Butte
26
-
-
-
-
-
-
-
-
0
0
0.0
0
-
31
-
-
-
-
-
Private Rooms
Marquis Assisted Living
-
AL

Assisted Living A licensed, long-term care setting for seniors or individuals with disabilities who need help with daily activities — like bathing, dressing, and medication management — but not 24-hour skilled nursing. Offers housing, meals, and around-the-clock support while aiming to maximize resident independence.

MC

Memory Care Secured, specialized care for people living with Alzheimer's or dementia. Staff trained in cognitive impairment, with higher staff-to-resident ratios and an environment designed to reduce confusion and wandering risk.

Butte
-
-
-
-
-
-
-
-
-
0
0
0.0
0
-
19
-
-
-
-
-
-
St. James Healthcare Transitional Care Unit (TCU)
-
AL

Assisted Living A licensed, long-term care setting for seniors or individuals with disabilities who need help with daily activities — like bathing, dressing, and medication management — but not 24-hour skilled nursing. Offers housing, meals, and around-the-clock support while aiming to maximize resident independence.

IL

Independent Living Lifestyle-focused communities for older adults offering dining, activities, and transportation with minimal personal care. Best for active, independent seniors who want community without medical support.

MC

Memory Care Secured, specialized care for people living with Alzheimer's or dementia. Staff trained in cognitive impairment, with higher staff-to-resident ratios and an environment designed to reduce confusion and wandering risk.

NH

Nursing Home Licensed facility providing 24/7 skilled nursing care for residents with complex, ongoing medical needs. Staffed by RNs, LPNs, and CNAs. Inspected and star-rated annually by CMS. Accepts Medicare (short-term rehab) and Medicaid (long-term care).

Butte
129
-
-
-
-
-
-
-
-
0
0
0.0
0
-
72
-
-
-
-
-
-

Places of interest near Copper Ridge Health and Rehab

Address 3.5 miles from city center — 1.26 miles to nearest hospital (Fire Station 2)

Address 3251 Nettie St, Butte, MT 59701

Calculate Travel Distance to Copper Ridge Health and Rehab

Add your location

Address

Staffing Data (Q2 2025)

This data corresponds to Q2 2025 and is based on CMS Payroll-Based Journal.

Total staff 152
Employees 83
Contractors 69
Staff to resident ratio 2.41:1
36% better than Montana average

Montana average ratio: 1.77:1

Avg staff/day 38
Average shift 7.4 hours
14% worse than Montana average

Montana average: 8.6 hours

Total staff hours (quarter) 25,619
Nursing staff breakdown
Registered Nurse

Manages medical care and health needs.

Total count 27
Average shift length Info Average shift length. Calculated as total hours divided by days worked and average staff per day. 8.4 hours

This role is partially covered by contractors.

Licensed Practical Nurse

Assists with medical care and medications.

Total count 18
Average shift length Info Average shift length. Calculated as total hours divided by days worked and average staff per day. 7.4 hours

This role is partially covered by contractors.

Certified Nursing Assistant

Helps with daily care and mobility.

Total count 75
Average shift length Info Average shift length. Calculated as total hours divided by days worked and average staff per day. 7.5 hours

This role is partially covered by contractors.

Contractor staffing

Total hours from contractors

14.5%

3,702 contractor hours this quarter

Certified Nursing Assistant: 37 Registered Nurse: 15 Licensed Practical Nurse: 10 Physical Therapy Aide: 2 Speech Language Pathologist: 2 Occupational Therapy Aide: 1 Occupational Therapy Assistant: 1 Medical Director: 1
Staff by category
Certified Nursing Assistant3837759,96091100%7.5
Registered Nurse1215273,19891100%8.4
Licensed Practical Nurse810182,94391100%7.4
Physical Therapy Aide4261,2777886%6.9
Speech Language Pathologist1231,2656875%7.6
Respiratory Therapy Technician3031,2166774%8.1
Medication Aide/Technician4041,1677077%7.4
Other Dietary Services Staff6061,14091100%5.8
Qualified Social Worker2028657380%7.3
Administrator1015126470%8
Mental Health Service Worker1014966268%8
Nurse Practitioner1014886167%8
Clinical Nurse Specialist1014605864%7.9
RN Director of Nursing1014445662%7.9
Occupational Therapy Aide0111052426%4.4
Occupational Therapy Assistant011462629%1.8
Medical Director011361415%2.6
75 Certified Nursing Assistant
% of Days 100%
27 Registered Nurse
% of Days 100%
18 Licensed Practical Nurse
% of Days 100%
6 Physical Therapy Aide
% of Days 86%
3 Speech Language Pathologist
% of Days 75%
3 Respiratory Therapy Technician
% of Days 74%
4 Medication Aide/Technician
% of Days 77%
6 Other Dietary Services Staff
% of Days 100%
2 Qualified Social Worker
% of Days 80%
1 Administrator
% of Days 70%
1 Mental Health Service Worker
% of Days 68%
1 Nurse Practitioner
% of Days 67%
1 Clinical Nurse Specialist
% of Days 64%
1 RN Director of Nursing
% of Days 62%
1 Occupational Therapy Aide
% of Days 26%
1 Occupational Therapy Assistant
% of Days 29%
1 Medical Director
% of Days 15%

Facility Characteristics

Source: CMS Long-Term Care Facility Characteristics (Data as of Jan 2026)

Total census
63 residents
Residents by payment source
Medicare
5 residents (7.9%)
Medicaid
45 residents (71.4%)
Private pay or other
13 residents (20.6%)
Programs & Services
Residents' Group

Residents meet regularly to discuss policies, care quality, and activities

Active Resident Council

Organized group of residents that meets regularly to discuss facility policies, quality of life, and activities.

Quality of care over time

These measures show how residents usually do over time at this home, based on health outcomes and preventive care.

High-risk clinical events score Info A composite score based on pressure ulcers, falls with injury, weight loss, walking ability decline, and activities of daily living decline. 12.9
16% worse than Montana average

Montana average: 11.2

Functional decline score Info A composite score based on activities of daily living decline, walking ability decline, and incontinence. 22.6
In line with Montana average

Montana average: 21.8

Long-stay resident measures
Below average Montana avg: 2.8 Info CMS star rating based on long-stay quality measure performance. 5 stars = significantly above average, 1 star = significantly below average.
Need for Help with Daily Activities Increased Info Percent of long-stay residents whose need for help with daily activities has increased 15.8%
18% better than Montana average

Montana average: 19.4%

Walking Ability Worsened Info Percent of long-stay residents whose ability to move independently worsened 33.5%
61% worse than Montana average

Montana average: 20.8%

Low Risk Residents with Bowel/Bladder Incontinence Info Percent of low risk long-stay residents who lose control of their bowels or bladder 18.5%
27% better than Montana average

Montana average: 25.2%

Falls with Major Injury Info Percent of long-stay residents experiencing one or more falls with major injury 1.9%
56% better than Montana average

Montana average: 4.3%

High Risk Residents with Pressure Ulcers Info Percent of long-stay high risk residents with pressure ulcers 4.4%
30% better than Montana average

Montana average: 6.3%

Urinary Tract Infection Info Percent of long-stay residents with a urinary tract infection 1.0%
64% better than Montana average

Montana average: 2.8%

Lost Too Much Weight Info Percent of long-stay residents who lose too much weight 9.0%
47% worse than Montana average

Montana average: 6.1%

Depressive Symptoms Info Percent of long-stay residents who have depressive symptoms 4.0%
15% better than Montana average

Montana average: 4.7%

Antipsychotic Use Info Percent of long-stay residents who received an antipsychotic medication 26.1%
37% worse than Montana average

Montana average: 19.1%

Pneumococcal Vaccine Info Percent of long-stay residents assessed and appropriately given the pneumococcal vaccine 97.6%
In line with Montana average

Montana average: 93.8%

Influenza Vaccine Info Percent of long-stay residents assessed and appropriately given the seasonal influenza vaccine 93.1%
In line with Montana average

Montana average: 93.7%

Hospitalizations per 1,000 days Info Number of hospitalizations per 1,000 long-stay resident days. 1.55
22% worse than Montana average

Montana average: 1.27

ED visits per 1,000 days Info Number of outpatient emergency department visits per 1,000 long-stay resident days. 1.52
30% better than Montana average

Montana average: 2.17

Short-stay resident measures
Average Montana avg: 2.1 Info CMS star rating based on short-stay quality measure performance. 5 stars = much above average, 1 star = much below average.
Pneumococcal Vaccine Info Percent of short-stay residents assessed and appropriately given the pneumococcal vaccine 68.7%
10% worse than Montana average

Montana average: 76.4%

Antipsychotic medication increase Info Percent of short-stay residents who newly received an antipsychotic medication 2.9%
67% worse than Montana average

Montana average: 1.8%

Influenza Vaccine Info Percent of short-stay residents assessed and appropriately given the seasonal influenza vaccine 68.5%
7% worse than Montana average

Montana average: 73.8%

Re-hospitalized after SNF stay Info Percentage of short-stay residents who were re-hospitalized after their nursing home admission. 22.0%
13% worse than Montana average

Montana average: 19.4%

Emergency department visits Info Percentage of short-stay residents who had an outpatient emergency department visit. 14.7%
In line with Montana average

Montana average: 15.0%

Falls with major injury Info Percentage of SNF residents who experience falls with major injury during their stay. 0.0%
100% better than Montana average

Montana average: 0.8%

Ability to care for self at discharge Info Percentage of residents at or above expected ability to care for themselves at discharge. 59.3%
10% better than Montana average

Montana average: 53.7%

Successful return to home or community Info Rate of successful return to home or community from a skilled nursing facility. 64.5%
27% better than Montana average

Montana average: 50.6%

Penalties and fines

Federal penalties imposed by CMS for regulatory violations, including civil money penalties (fines) and denials of payment for new Medicare/Medicaid admissions.

Source: CMS Penalties Database (Data as of Jan 2026)

Total fines amount $19K
78% lower than Montana average

Montana average: $87K

Number of fines 2
14% fewer fines than Montana average

Montana average: 2.3

Payment Denials Info Serious action where Medicare and/or Medicaid temporarily stops payments for new residents until issues are fixed. 0
100% fewer payment denials than Montana average

Montana average: 0.2

Fines amount comparison
This facility $19K
Montana average $87K
Penalty History

Penalties are imposed by CMS for violations of federal nursing home regulations.

Civil Money Penalty Info Fines imposed for noncompliance, which can be assessed per day or per instance of violation. Sep 20, 2023
$9K
Civil Money Penalty Info Fines imposed for noncompliance, which can be assessed per day or per instance of violation. Apr 13, 2023
$10K

Last updated: Jan 2026

Guides for Better Senior Living

Care Cost Calculator: See Prices in Your Area

Nursing Home Data Explorer

Don’t Wait Too Long: 7 Red Flag Signs Your Parent Needs Assisted Living Now

The True Cost of Assisted Living in 2025 – And How Families Are Paying For It

Understanding Senior Living Costs: Pricing Models, Discounts & Financial Assistance

Financial Aid for Montana Seniors

Get financial aid guidance

Big Sky Waiver

Montana Medicaid Big Sky Waiver

Age 65+ or disabled, Montana resident, Medicaid- eligible, nursing home-level care need.

~$2,829/month (300% FBR, individual).

$2,000 (individual), $3,000 (couple).

Rural state; limited providers in some areas.

Montana Community First Choice

MT CFC

Age 65+ or disabled, Montana resident, Medicaid- eligible.

~$1,732/month (individual, Medicaid threshold).

$2,000 (individual).

Less intensive than waiver; rural focus.

Big Sky Rx

Montana Big Sky Rx

Age 65+ or disabled, Montana resident, enrolled in Medicare Part D, income below limit.

~$2,510/month (individual), ~$3,380/month (couple).

Not assessed.

Covers up to $38.75/month premium; statewide via AAAs.

Medicare Savings Program (MSP)

Montana Medicare Savings Program

Age 65+ or disabled, Montana resident, Medicare Part A/B.

~$2,510/month (QMB), ~$3,380/month (SLMB), ~$3,598/month (QI)—individual.

$9,430 (individual), $14,130 (couple).

Three tiers; no waitlist; includes Extra Help for Part D.

Montana Caregiver Support Program (via NFCSP)

Montana Caregiver Support Program

Caregivers of 60+ needing care or 55+ caregivers of others; Montana resident; functional needs (2+ ADLs).

Prioritizes ~$24,980/year (individual); no strict cap.

Not assessed; need-based.

10 AAAs; prioritizes low-income, rural caregivers.

Senior Community Service Employment Program (SCSEP)

Montana SCSEP

Age 55+, unemployed, low-income, Montana resident.

~$1,983/month (125% FPL).

Not specified; income-focused.

Priority for veterans, rural residents; AARP partnership.

VA Aid and Attendance (A&A) and Housebound Benefits

Montana VA Aid and Attendance/Housebound

Age 65+ or disabled veteran/spouse, Montana resident, wartime service, need for ADL help (A&A) or homebound.

Net income < ~$1,984/month (veteran with dependent, A&A); pension offsets income.

~$155,356 (net worth limit).

High veteran demand in rural areas.

Tour Icon
Planning a tour? Check our touring checklist.
Chat Icon
Thinking of living here? We can help you speak to a current resident