Explore Open Rooms

1 Contact details
2 What type of senior care service are you looking for?
3 What budget do you have in mind for senior care?
4 How soon do you need to find care?
5 Additional details

Thank you for your interest!

Our team will be in touch shortly to help with next steps.

Nursing Home

Coral Gables Nursing and Rehabilitation

Nursing Home

Coral Gables Nursing and Rehabilitation

7060 SW 8th St, Miami, FL 33144 View map
Overview of Coral Gables Nursing and Rehabilitation

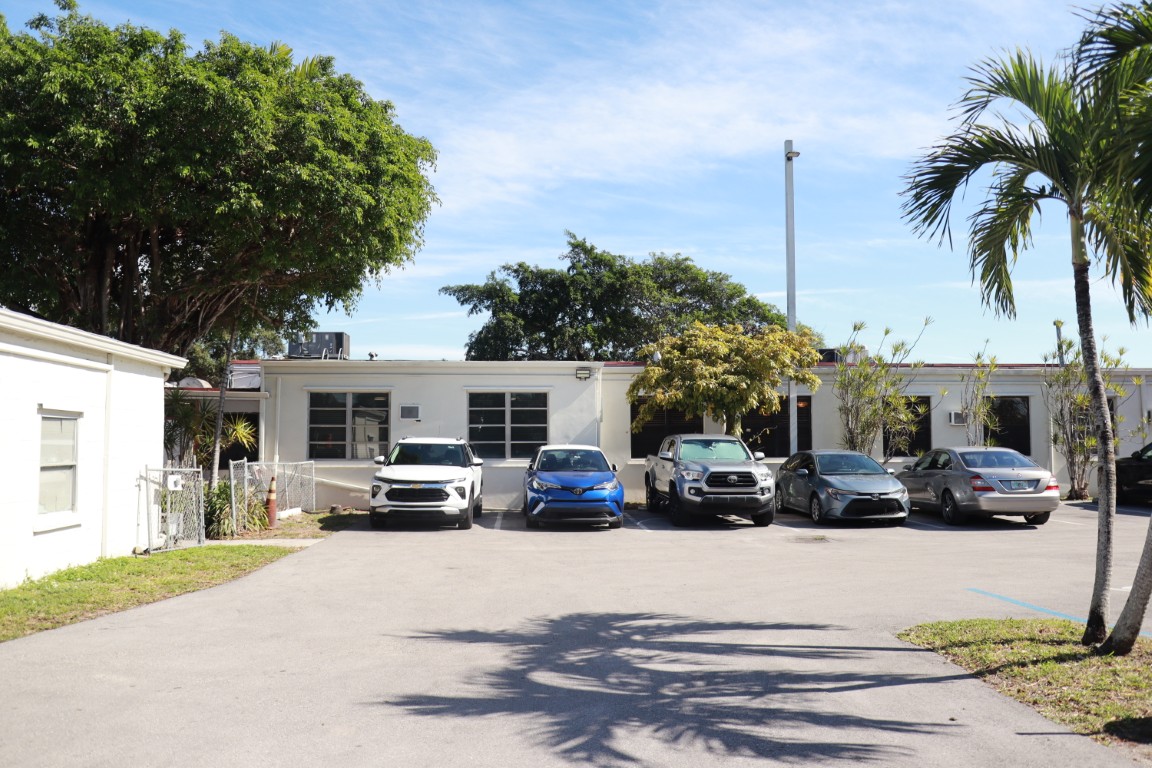
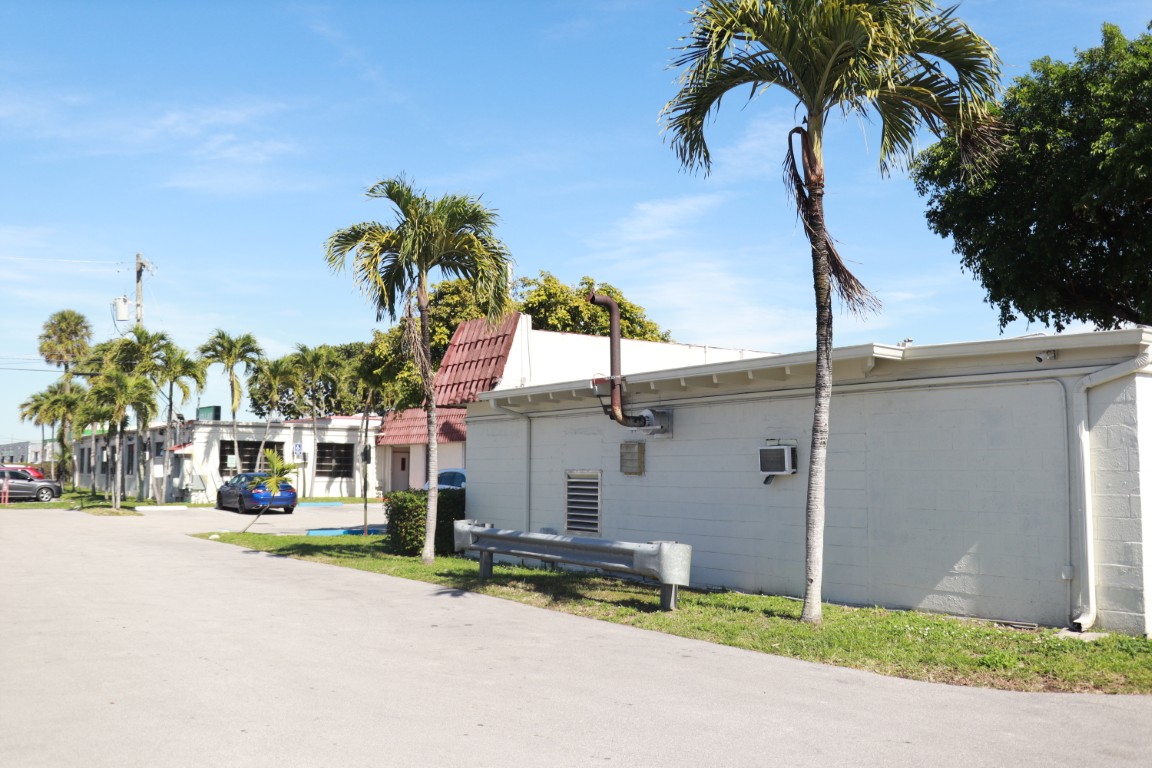
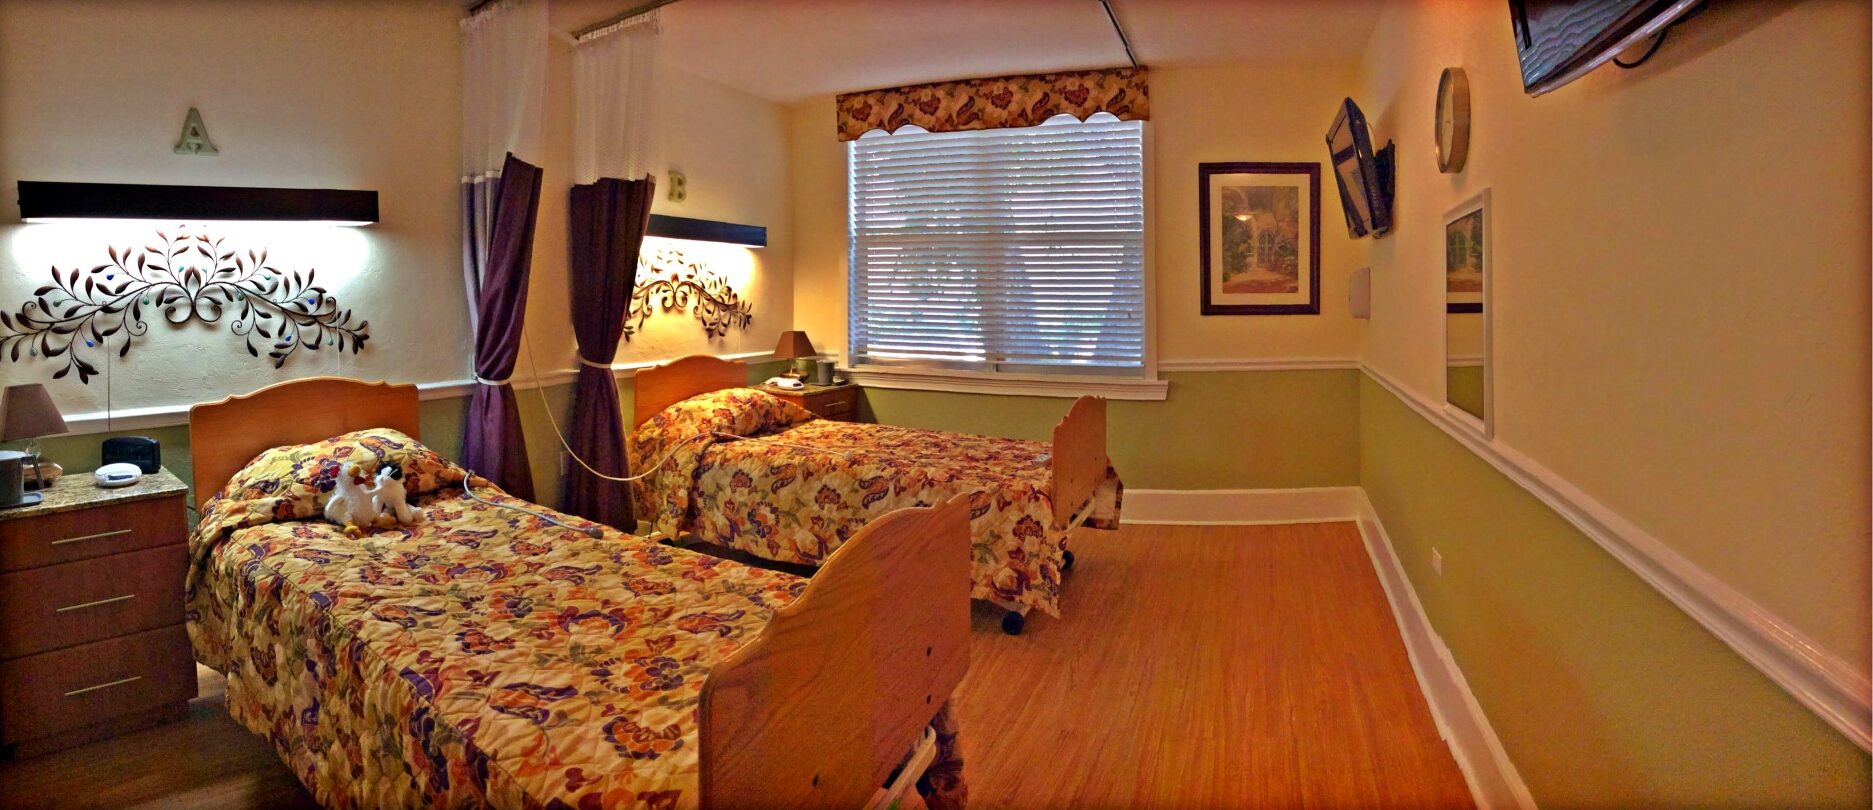
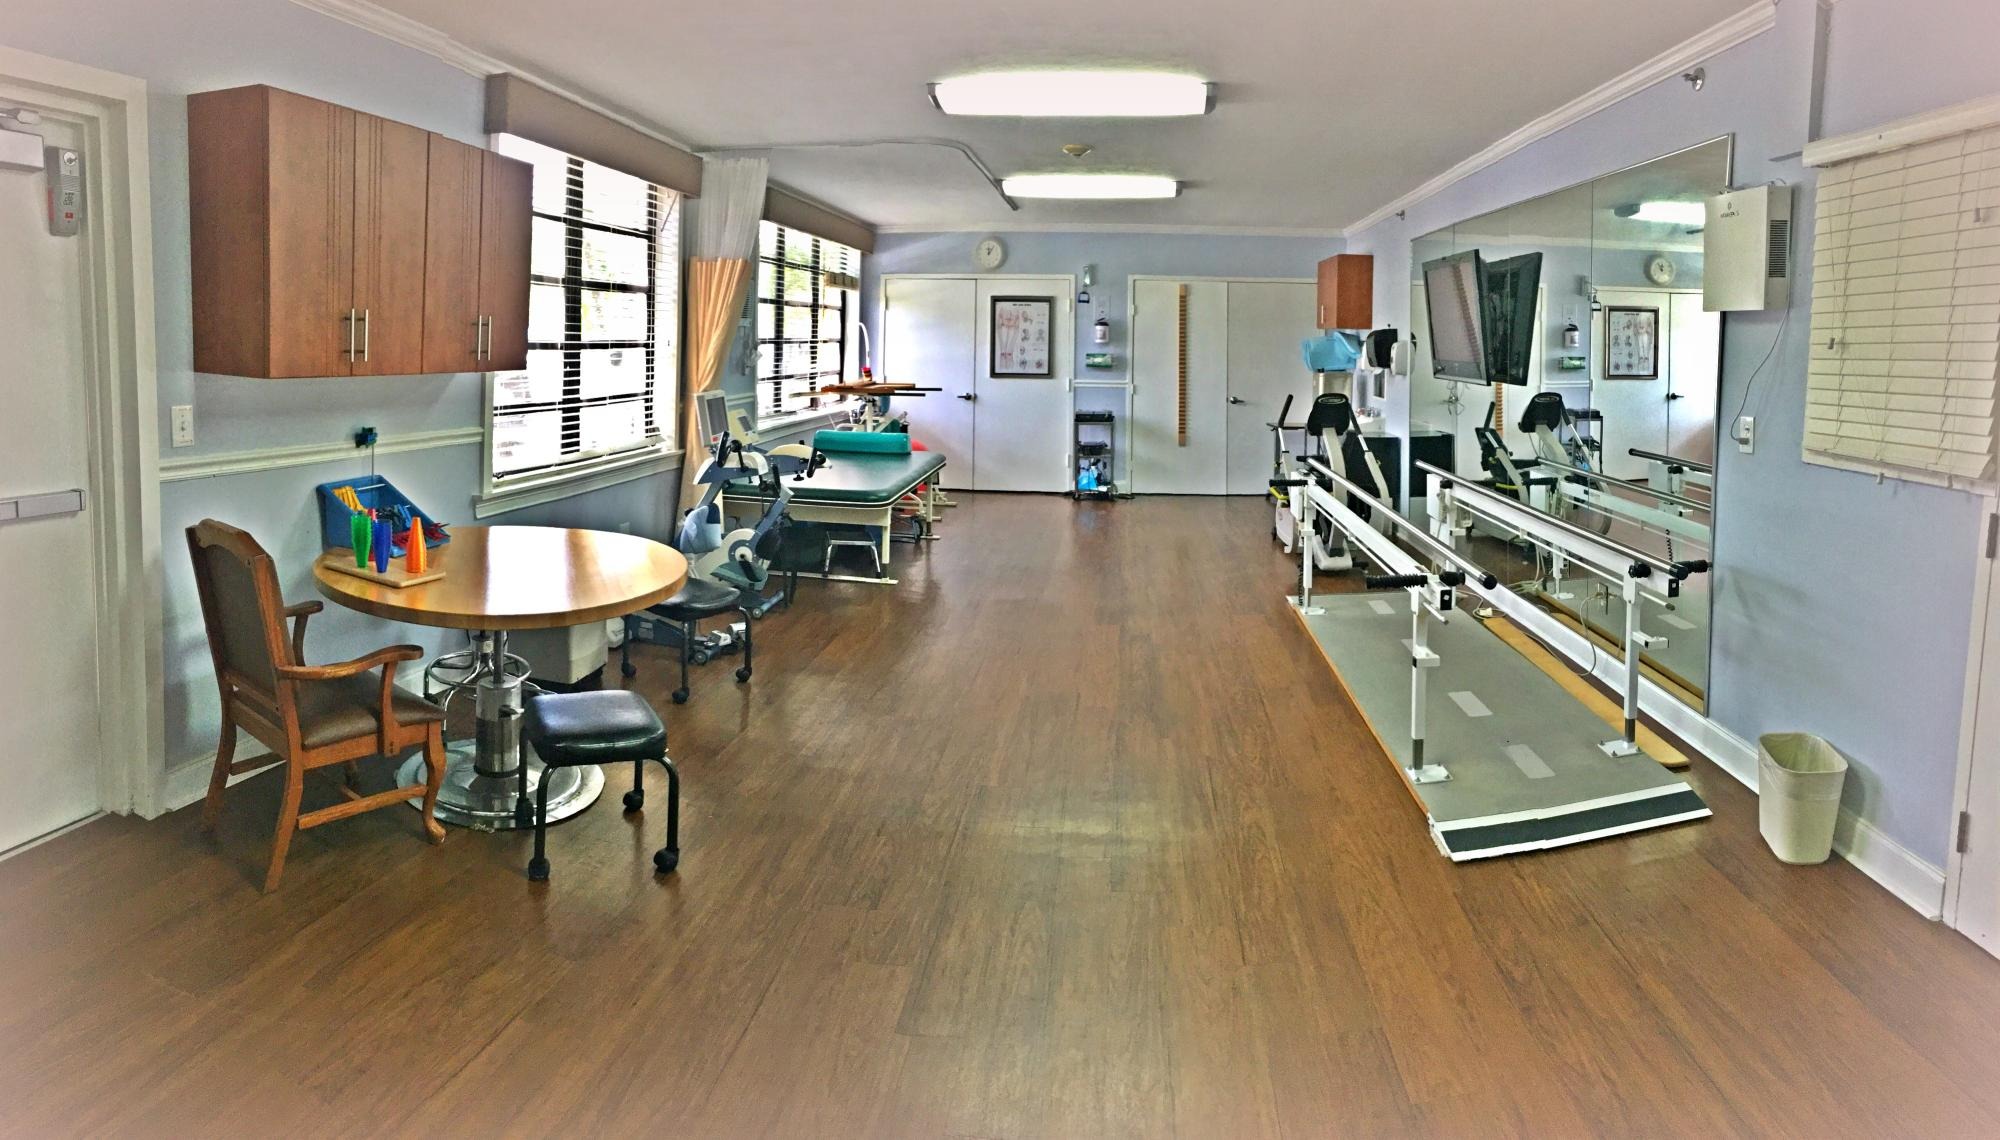
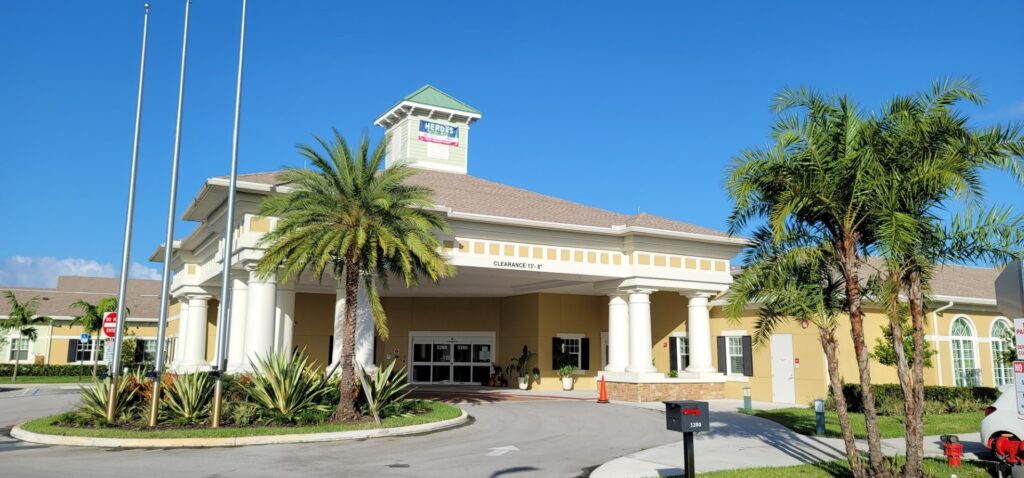
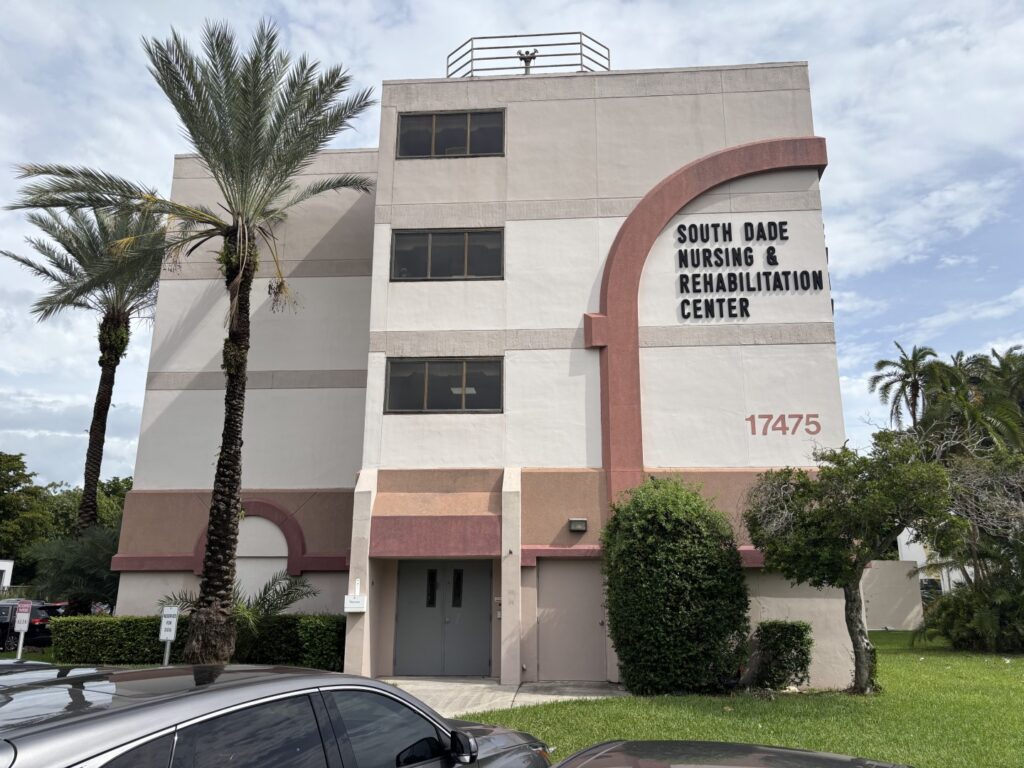
Enjoy the best of your golden years with Coral Gables Nursing & Rehabilitation, a dedicated and duly certified community set near Kindred Hospital in Miami, FL, that offers skilled nursing and rehabilitation. Residents receive the utmost care they deserve with a respectful and highly trained team attending to their needs around the clock. The community promotes a vibrant and welcoming environment to optimize residents’ comfort and safety.

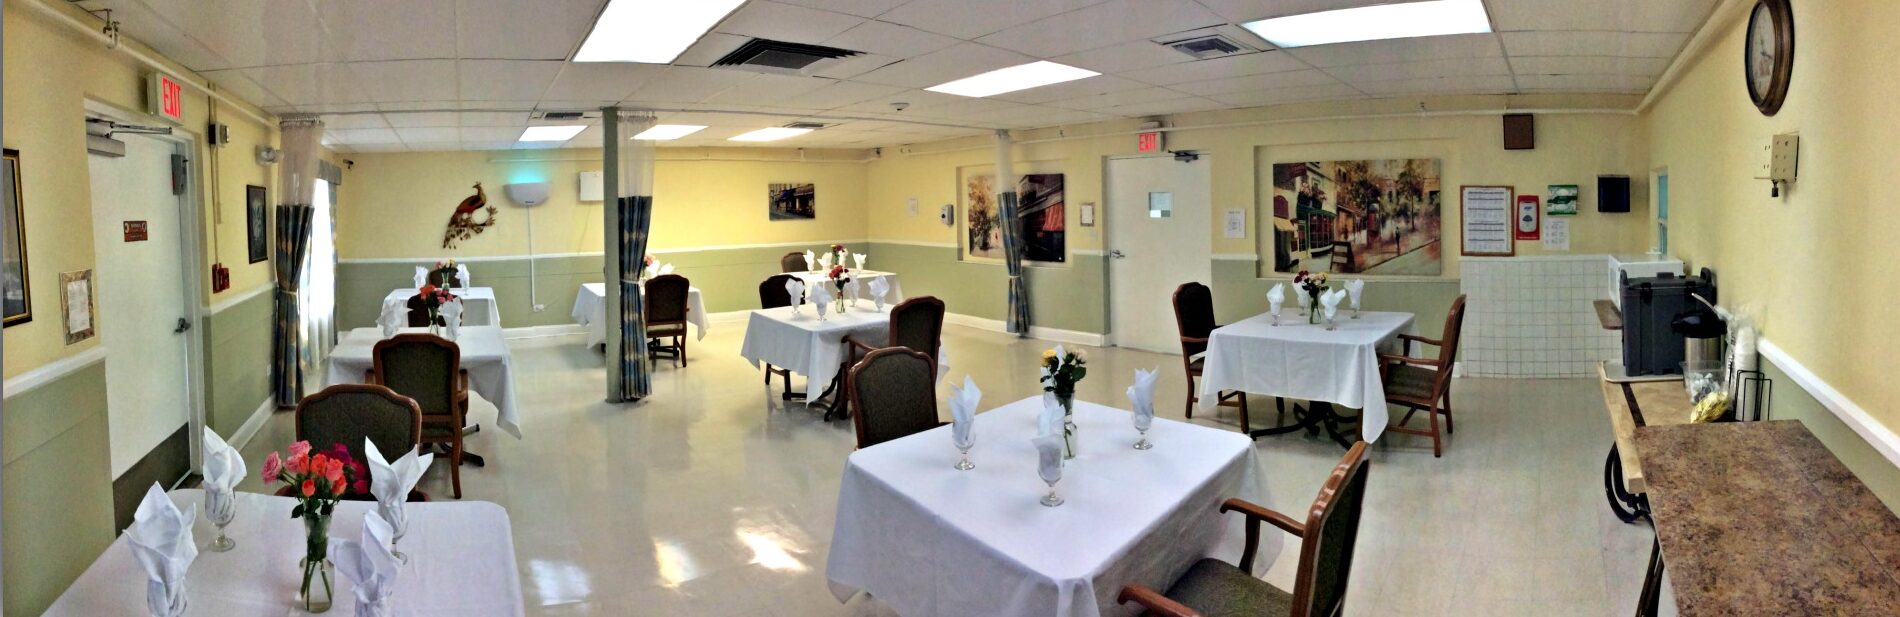
Engaging social events and stimulating recreational activities are also conducted for residents’ leisure and wellness. Dining options are also carefully curated to accommodate each resident’s dietary needs and preferences. Psychological and psychiatric care, pharmaceutical services, and inpatient and outpatient therapy are also provided to meet residents’ special needs. The community is ideal for those looking to spend their later years without worries, with its comprehensive care and specially designed amenities.

(305) 261-1363

Quality ratings

Measured by Centers for Medicare & Medicaid Services (CMS)

Overall rating Info The Overall CMS Rating combines results from health inspections, staffing levels and quality measures. Health inspections carry the most weight. Staffing and quality scores can increase or decrease the final rating based on performance compared to state and national standards.
5/5
Florida average: 3.2/5
Health Inspection Info Based on the results of the facility's three most recent standard inspections and any complaint investigations. CMS reviews the number, scope, and severity of deficiencies, with more recent findings weighted more heavily.
5/5
Florida average: 2.8/5
Staffing Info Measures average nursing staff hours per resident per day, including Registered Nurses (RNs) and total nursing staff. Ratings are adjusted based on the level of care residents require and are compared to state and national benchmarks.
4/5
Florida average: 3.4/5
Quality Measures Info Based on clinical and physical health indicators reported to CMS, such as hospital readmissions, falls, pressure ulcers, and improvements in mobility. These measures reflect how well residents' health needs are being managed.
3/5
Florida average: 4.1/5

Nursing care per resident

Info This shows how many total hours of nursing staff time are available per resident each day. Higher numbers usually mean more staff support.
4h 4m per day

This home provides 1% more nursing time per resident than the Florida average.

Florida average: 4h 2m per day

Staffing hours breakdown

Info Hours of care per resident per day, broken down by staff type. Data from CMS Medicare.
Staff type Facility State avg National avg
Registered Nurse (RN) Info Registered nurse hours per resident per day. 1h 37m per day 44m per day 41m per day
Nurse Aide Info Nurse aide hours per resident per day. 2h 48m per day 2h 20m per day 2h 21m per day
Total Nursing (Weekend) Info Total number of nurse staff hours per resident per day on weekends. 3h 56m per day 3h 31m per day 3h 26m per day
Physical Therapist Info Physical therapist staff hours per resident per day. 3m per day 5m per day 4m per day
RN (Weekend) Info Registered nurse hours per resident per day on weekends. 1h 15m per day 32m per day 29m per day

Capacity and availability

This home usually has limited availability

Occupancy is moderate, suggesting balanced demand.

Similar demand to the Florida average
Occupancy rate 88.5%
Residents per day (avg) 81
Occupancy rate
88.5%
Residents per day (avg)
81

Who this home usually serves

TYPE OF STAY

Mostly short-term rehab stays

Most residents typically stay for a few weeks or months before returning home or moving on.

Might be optimal for
Short stays Recovery Medicare-covered care

Breakdown by payment type

Medicare

43% of new residents, usually for short-term rehab.

Typical stay 1 - 2 months

Private pay

38% of new residents, often for short stays.

Typical stay 3 - 4 months

Medicaid

19% of new residents, often for long-term daily care.

Typical stay 1 - 2 years

Finances and operations

Privately-owned community
Operated by a business corporation.
Home revenue
$11.4M
Operating loss
-$882.5K
Privately-owned community Operated by a business corporation.
Home revenue
$11,418,520.00
Operating loss
$-882,546.00
Payroll costs Info The portion of the home's budget spent on staff, including nurses, caregivers, and other employees who support care and operations.
$4.9M
42.7% of revenue
Other operating costs Info All remaining costs needed to run the home, such as food, utilities, building maintenance, supplies and administrative expenses.
$7.4M
Total costs $12.3M
Walk Score
Walk Score: 88 / 100
Very walkable. Most errands can be accomplished on foot, and many essentials are within a short walk.

About this community

Care Services

Nursing Services
Rehabilitation Services
Skilled Nursing
Licensed Nurses/CNAs
24-Hour Staffing

Programs & Activities

Specific Programs
Skilled Nursing Care, Physical Therapy, Occupational Therapy, Speech Therapy, Restorative Therapy, Social Services, Counseling, Transitional Care, Discharge Planning, Psychological Care, Psychiatric Care, Pharmaceutical Services, Dietary Services, Emergency Dental Services, Personal Hygiene Services
Operating Hours
Available 24 hours

What does this home offer?

Accepts Medicaid icon

Accept Medicaid: Yes

Total residents icon

Total Residents: 81 Residents

Housing options icon

Housing Options: Private Rooms

Building type icon
Building type icon

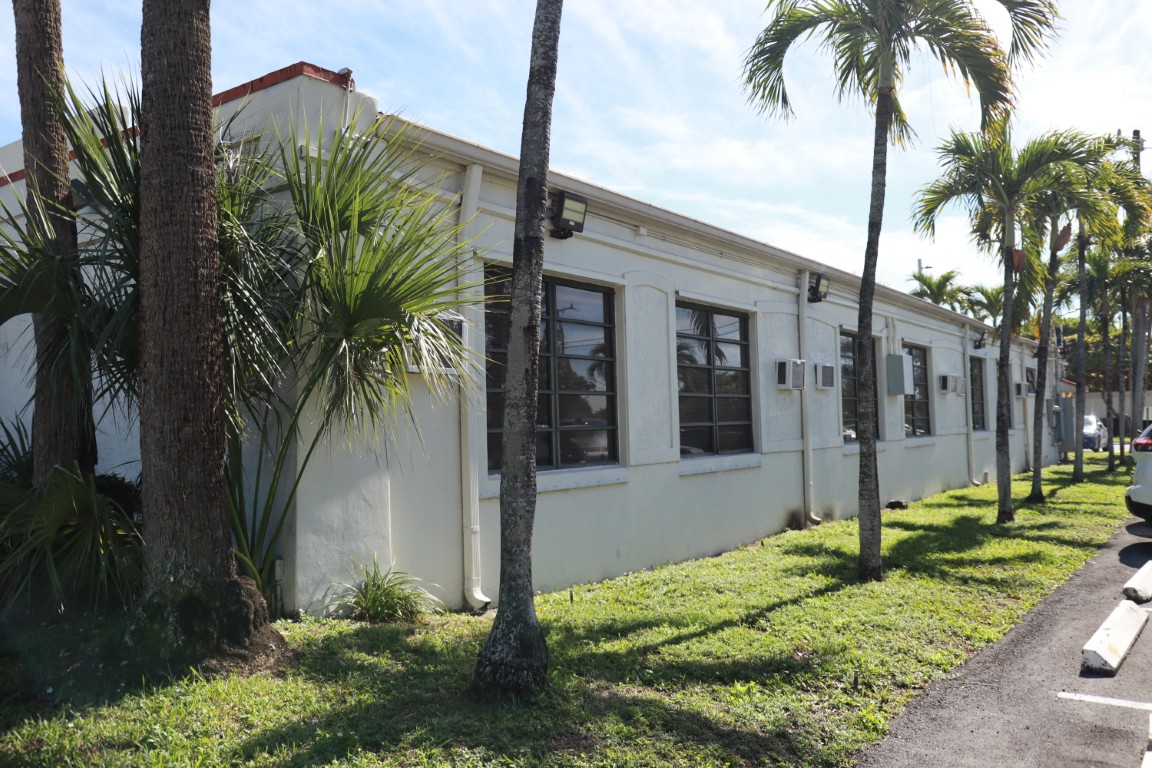
Building Type: Single-story

Dining services icon

Dining Services

Housekeeping icon
Housekeeping icon

Housekeeping Services

Safety systems icon
Safety systems icon

Safety Systems

Health Programs icon

Health Programs

Types of Care at Coral Gables Nursing and Rehabilitation

Nursing Home Hospice Care Respite Care
Contact Coral Gables Nursing and Rehabilitation

Health Inspection History

Inspections
Total health inspections 2

State average 4.3


Last Health inspection on Jul 2024

Total health citations 3

State average 19.7

Citations per inspection
1.5

State average 4.48


Health citations are formal notices following inspections when they fail to comply with safety and care standards.

All 3 citations resulted from standard inspections.

Breakdown of citation severity (last 3 years)
Critical Health citations More info 0
100% better than State average

State average: 0.8


Serious Health citations More info 0
100% better than State average

State average: 0.4

0 critical citations More info State average: 0.8

0 serious citations More info State average: 0.4

3 moderate citations More info State average: 18.4

0 minor citations More info State average: 0.2
Citations history (last 3 years)
Quality of Care moderate citation Info Issues related to how well residents receive appropriate treatment and support for their medical and daily care needs. Jul 11, 2024
Corrected

Quality of Care moderate citation Info Issues related to how well residents receive appropriate treatment and support for their medical and daily care needs. Jul 11, 2024
Corrected

Infection Control moderate citation Info Issues related to preventing and controlling infections, including hygiene practices and safety protocols. Jul 15, 2021
Corrected

Compare Nursing Homes around Miami-dade County The information below is reported by the Florida Agency for Health Care Administration (AHCA).

5 facilities compared · CMS & FL Dept. of Health data · Updated Mar 2026

Kendall Lakes Health and Rehabilitation Center
NH

Nursing Home Licensed facility providing 24/7 skilled nursing care for residents with complex, ongoing medical needs. Staffed by RNs, LPNs, and CNAs. Inspected and star-rated annually by CMS. Accepts Medicare (short-term rehab) and Medicaid (long-term care).

Miami (West End)
150
95.0%
+13%
3.38
+97%
-16%
0
11
0
144
60
Kendall Lakes Snf Holdco Llc
$29,2M
$8,9M
30.5%
686123
Private / Semi-private Rooms
Coral Gables Nursing and Rehabilitation
HC

Home Care Professional care delivered in the person's own home — from companionship and errands to skilled nursing and therapy. Allows seniors to age in place. Medicare covers skilled home health when medically necessary.

NH

Nursing Home Licensed facility providing 24/7 skilled nursing care for residents with complex, ongoing medical needs. Staffed by RNs, LPNs, and CNAs. Inspected and star-rated annually by CMS. Accepts Medicare (short-term rehab) and Medicaid (long-term care).

RC

Respite Care Short-term temporary care — days to weeks — to give family caregivers a break. Full care provided during the stay. Often used after hospitalization or to trial a facility before a permanent placement decision.

Miami
87
88.5%
+5%
4.07
+116%
+1%
0
3
0
81
88
Coral Gables Holdings Llc
$11,0M
$4,9M
44.3%
105005
Private Rooms
Jackson Gardens Health & Rehabilitation Center
HC

Home Care Professional care delivered in the person's own home — from companionship and errands to skilled nursing and therapy. Allows seniors to age in place. Medicare covers skilled home health when medically necessary.

NH

Nursing Home Licensed facility providing 24/7 skilled nursing care for residents with complex, ongoing medical needs. Staffed by RNs, LPNs, and CNAs. Inspected and star-rated annually by CMS. Accepts Medicare (short-term rehab) and Medicaid (long-term care).

Miami (Allapattah)
120
94.1%
+12%
3.60
+114%
-11%
0
14
0
112
77
Jackson Opco Holdings, Llc
$15,7M
$5,9M
37.9%
106034
Private / Semi-private Rooms
Miami Springs Nursing And Rehab Center
NH

Nursing Home Licensed facility providing 24/7 skilled nursing care for residents with complex, ongoing medical needs. Staffed by RNs, LPNs, and CNAs. Inspected and star-rated annually by CMS. Accepts Medicare (short-term rehab) and Medicaid (long-term care).

Miami Springs
269
68.5%
-19%
3.72
+73%
-8%
0
24
0
187
91
Fair Havens Intermediate Holdco, Llc
$34,0M
$9,4M
27.6%
106128
Private Rooms
South Dade Nursing And Rehab Center
HC

Home Care Professional care delivered in the person's own home — from companionship and errands to skilled nursing and therapy. Allows seniors to age in place. Medicare covers skilled home health when medically necessary.

NH

Nursing Home Licensed facility providing 24/7 skilled nursing care for residents with complex, ongoing medical needs. Staffed by RNs, LPNs, and CNAs. Inspected and star-rated annually by CMS. Accepts Medicare (short-term rehab) and Medicaid (long-term care).

Miami
180
95.4%
+13%
3.65
+111%
-10%
1
25
3
166
76
Fernandez, George
$26,7M
$7,8M
29.3%
106132
Private Rooms

Places of interest near Coral Gables Nursing and Rehabilitation

Address 7.8 miles from city center
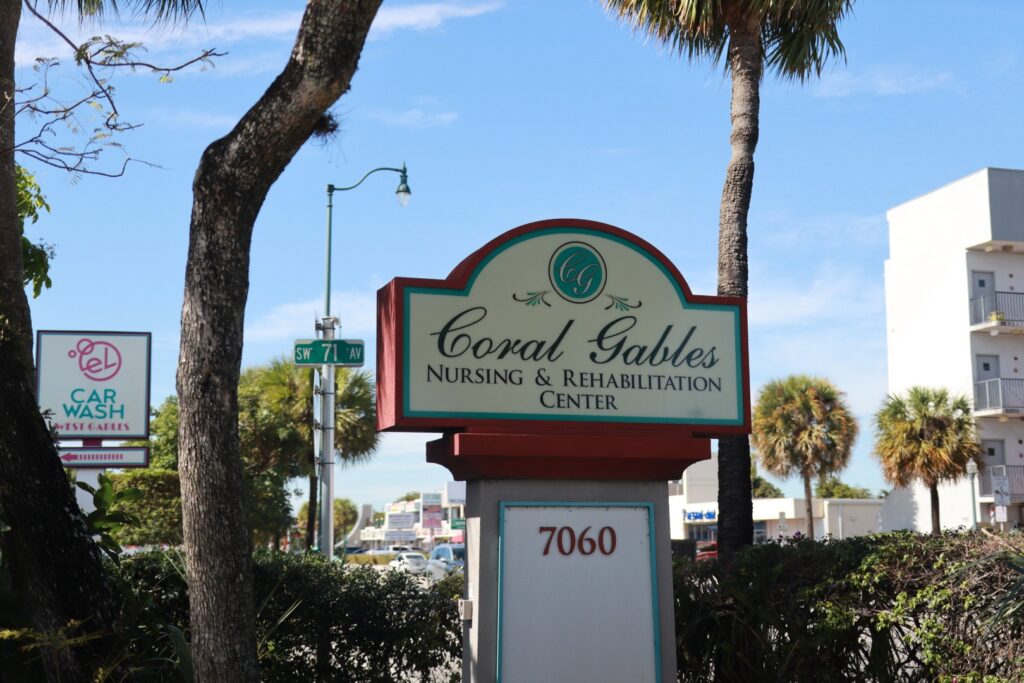
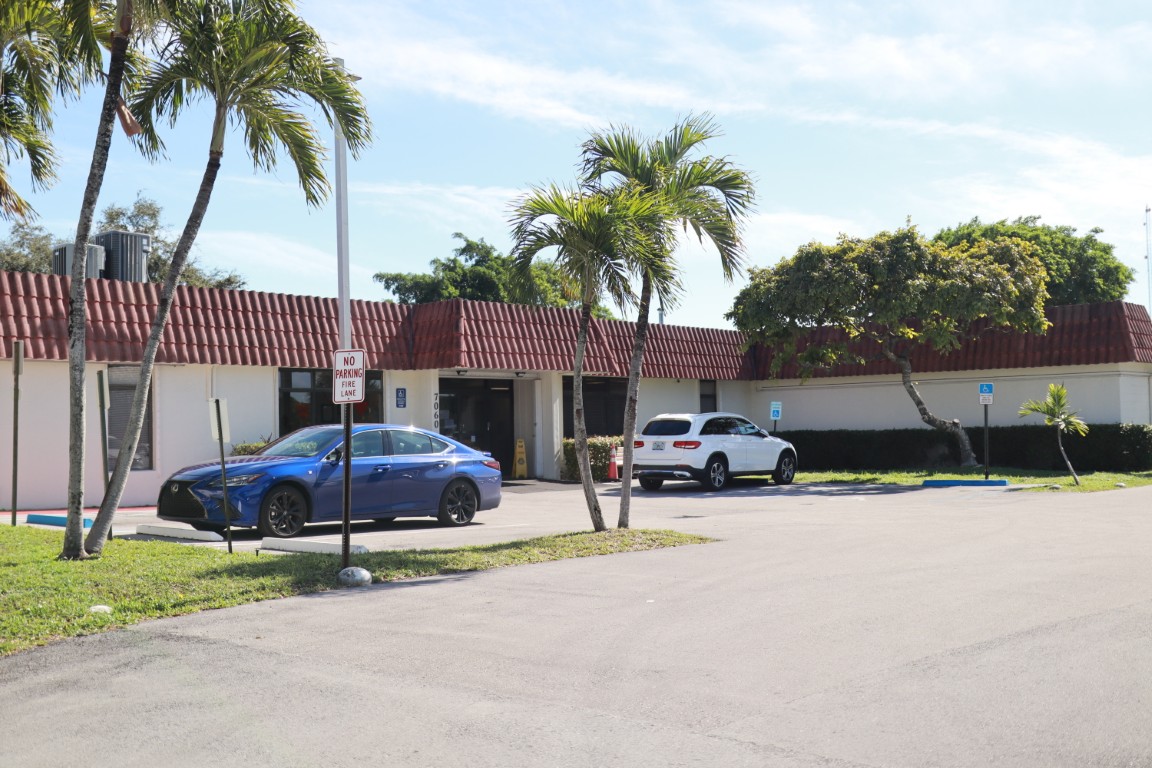
Address 7060 SW 8th St, Miami, FL 33144

Calculate Travel Distance to Coral Gables Nursing and Rehabilitation

Add your location

Address

Staffing Data (Q2 2025)

This data corresponds to Q2 2025 and is based on CMS Payroll-Based Journal.

Total staff 121
Employees 118
Contractors 3
Staff to resident ratio 1.64:1
8% better than Florida average

Florida average ratio: 1.52:1

Avg staff/day 55
Average shift 7.6 hours
0% compared with Florida average

Florida average: 7.9 hours

Total staff hours (quarter) 38,195
Nursing staff breakdown
Registered Nurse

Manages medical care and health needs.

Total count 31
Average shift length Info Average shift length. Calculated as total hours divided by days worked and average staff per day. 8.1 hours

No contractors work on this role.

Licensed Practical Nurse

Assists with medical care and medications.

Total count 2
Average shift length Info Average shift length. Calculated as total hours divided by days worked and average staff per day. 8.2 hours

No contractors work on this role.

Certified Nursing Assistant

Helps with daily care and mobility.

Total count 66
Average shift length Info Average shift length. Calculated as total hours divided by days worked and average staff per day. 7.7 hours

No contractors work on this role.

Contractor staffing

Total hours from contractors

0.5%

200 contractor hours this quarter

Medical Director: 1 Occupational Therapy Aide: 1 Occupational Therapy Assistant: 1
Staff by category
Certified Nursing Assistant6606621,12191100%7.7
Registered Nurse3103110,61091100%8.1
Qualified Social Worker2028378593%7.8
Physical Therapy Aide3037917785%5.6
Speech Language Pathologist2027447582%6.2
Clinical Nurse Specialist2027276268%7.9
Nurse Practitioner1015126470%8
Dental Services Staff1014976875%7.3
Respiratory Therapy Technician2024976571%5.3
Administrator1014806066%8
Dietitian1014485662%8
Licensed Practical Nurse2023524347%8.2
Mental Health Service Worker2023494853%7.1
Medical Director011742426%3.1
Occupational Therapy Assistant011701213%5.8
Occupational Therapy Aide011563538%1.6
Physical Therapy Assistant2022878%4
66 Certified Nursing Assistant
% of Days 100%
31 Registered Nurse
% of Days 100%
2 Qualified Social Worker
% of Days 93%
3 Physical Therapy Aide
% of Days 85%
2 Speech Language Pathologist
% of Days 82%
2 Clinical Nurse Specialist
% of Days 68%
1 Nurse Practitioner
% of Days 70%
1 Dental Services Staff
% of Days 75%
2 Respiratory Therapy Technician
% of Days 71%
1 Administrator
% of Days 66%
1 Dietitian
% of Days 62%
2 Licensed Practical Nurse
% of Days 47%
2 Mental Health Service Worker
% of Days 53%
1 Medical Director
% of Days 26%
1 Occupational Therapy Assistant
% of Days 13%
1 Occupational Therapy Aide
% of Days 38%
2 Physical Therapy Assistant
% of Days 8%

Facility Characteristics

Source: CMS Long-Term Care Facility Characteristics (Data as of Jan 2026)

Total census
74 residents
Residents by payment source
Medicare
14 residents (18.9%)
Medicaid
60 residents (81.1%)
Programs & Services
Residents' Group

Residents meet regularly to discuss policies, care quality, and activities

Active Resident Council

Organized group of residents that meets regularly to discuss facility policies, quality of life, and activities.

Quality of care over time

These measures show how residents usually do over time at this home, based on health outcomes and preventive care.

High-risk clinical events score Info A composite score based on pressure ulcers, falls with injury, weight loss, walking ability decline, and activities of daily living decline. 8.4
14% worse than Florida average

Florida average: 7.4

Functional decline score Info A composite score based on activities of daily living decline, walking ability decline, and incontinence. 13.8
11% worse than Florida average

Florida average: 12.4

Long-stay resident measures
Above average Florida avg: 4.6 Info CMS star rating based on long-stay quality measure performance. 5 stars = significantly above average, 1 star = significantly below average.
Need for Help with Daily Activities Increased Info Percent of long-stay residents whose need for help with daily activities has increased 20.7%
97% worse than Florida average

Florida average: 10.5%

Walking Ability Worsened Info Percent of long-stay residents whose ability to move independently worsened 10.9%
16% better than Florida average

Florida average: 12.9%

Low Risk Residents with Bowel/Bladder Incontinence Info Percent of low risk long-stay residents who lose control of their bowels or bladder 9.7%
29% better than Florida average

Florida average: 13.5%

Falls with Major Injury Info Percent of long-stay residents experiencing one or more falls with major injury 2.3%
13% better than Florida average

Florida average: 2.6%

High Risk Residents with Pressure Ulcers Info Percent of long-stay high risk residents with pressure ulcers 4.5%
16% better than Florida average

Florida average: 5.4%

Urinary Tract Infection Info Percent of long-stay residents with a urinary tract infection 1.1%
20% worse than Florida average

Florida average: 0.9%

Lost Too Much Weight Info Percent of long-stay residents who lose too much weight 3.8%
37% better than Florida average

Florida average: 6.0%

Depressive Symptoms Info Percent of long-stay residents who have depressive symptoms 0.0%
100% better than Florida average

Florida average: 3.3%

Antipsychotic Use Info Percent of long-stay residents who received an antipsychotic medication 20.4%
154% worse than Florida average

Florida average: 8.0%

Pneumococcal Vaccine Info Percent of long-stay residents assessed and appropriately given the pneumococcal vaccine 99.3%
In line with Florida average

Florida average: 97.7%

Influenza Vaccine Info Percent of long-stay residents assessed and appropriately given the seasonal influenza vaccine 100.0%
In line with Florida average

Florida average: 99.2%

Hospitalizations per 1,000 days Info Number of hospitalizations per 1,000 long-stay resident days. 2.76
31% worse than Florida average

Florida average: 2.10

ED visits per 1,000 days Info Number of outpatient emergency department visits per 1,000 long-stay resident days. 0.26
78% better than Florida average

Florida average: 1.18

Short-stay resident measures
Average Florida avg: 2.9 Info CMS star rating based on short-stay quality measure performance. 5 stars = much above average, 1 star = much below average.
Pneumococcal Vaccine Info Percent of short-stay residents assessed and appropriately given the pneumococcal vaccine 100.0%
6% better than Florida average

Florida average: 94.0%

Antipsychotic medication increase Info Percent of short-stay residents who newly received an antipsychotic medication 9.7%
545% worse than Florida average

Florida average: 1.5%

Influenza Vaccine Info Percent of short-stay residents assessed and appropriately given the seasonal influenza vaccine 100.0%
6% better than Florida average

Florida average: 94.7%

Re-hospitalized after SNF stay Info Percentage of short-stay residents who were re-hospitalized after their nursing home admission. 23.4%
11% better than Florida average

Florida average: 26.2%

Emergency department visits Info Percentage of short-stay residents who had an outpatient emergency department visit. 2.5%
73% better than Florida average

Florida average: 9.3%

Falls with major injury Info Percentage of SNF residents who experience falls with major injury during their stay. 0.0%
100% better than Florida average

Florida average: 0.8%

Ability to care for self at discharge Info Percentage of residents at or above expected ability to care for themselves at discharge. 33.9%
37% worse than Florida average

Florida average: 53.7%

Guides for Better Senior Living

Care Cost Calculator: See Prices in Your Area

Nursing Home Data Explorer

Don’t Wait Too Long: 7 Red Flag Signs Your Parent Needs Assisted Living Now

The True Cost of Assisted Living in 2025 – And How Families Are Paying For It

Understanding Senior Living Costs: Pricing Models, Discounts & Financial Assistance

Financial Aid for Florida Seniors

Get financial aid guidance

Long-Term Care Waiver

Florida Medicaid LTC Waiver

Age 65+ or 21+ disabled, Florida resident, Medicaid- eligible, nursing home-level care need.

~$2,829/month (300% FBR, individual).

$2,000 (individual), $3,000 (couple).

High demand; waitlists common.

Community Care for the Elderly (CCE)

Florida CCE

Age 60+, Florida resident, at risk of nursing home.

~$2,000/month (varies).

$5,000 (individual).

Limited funding; regional variation.

Home Care for the Elderly (HCE)

Florida Home Care for the Elderly

Age 60+, Florida resident, at risk of nursing home placement; caregiver must be approved.

~$2,829/month (individual, aligned with Medicaid thresholds).

~$2,000 (individual); varies by case manager discretion.

Limited funding (~3,500 served annually); prioritizes low-income frail seniors.

Program of All-Inclusive Care for the Elderly (PACE)

Florida Medicaid PACE

Age 55+, Florida resident, nursing home-level care need, safe with PACE support.

~$2,829/month (300% FBR).

$2,000 (individual), $3,000 (couple).

Limited to specific counties (e.g., Hillsborough, Miami-Dade); ~10 sites statewide.

Optional State Supplementation (OSS)

Florida Optional State Supplementation

Age 65+ or disabled, Florida resident, living in approved facility, receiving SSI or low-income.

~$1,004/month (individual, including SSI).

$2,000 (individual), $3,000 (couple).

Limited to specific facility types; ~$78.40/month max supplement.

Senior Community Service Employment Program (SCSEP)

Florida SCSEP (federally funded, state-administered)

Age 55+, unemployed, low-income, Florida resident.

~$1,983/month (125% FPL, individual).

Not specified; income-focused.

Priority for veterans, rural residents; ~1,000 slots/year.