Jackson Gardens Health & Rehabilitation Center
Nursing Home & Hospice Care · Miami-Dade County, FL
CMS overall rating Info The Overall CMS Rating is scored from 1 to 5 stars and combines results from health inspections, staffing levels, and quality measures. Health inspections carry the most weight. Staffing and quality scores can increase or decrease the final rating based on performance compared to state and national standards.

Jackson Gardens Health & Rehabilitation Center

Nursing Home & Hospice Care · Miami-Dade County, FL
CMS overall rating Info The Overall CMS Rating is scored from 1 to 5 stars and combines results from health inspections, staffing levels, and quality measures. Health inspections carry the most weight. Staffing and quality scores can increase or decrease the final rating based on performance compared to state and national standards.
Calculator: See prices in your area
Jackson Gardens Health & Rehabilitation Center accepts Medicare, Medicaid, and private pay.

Overview of Jackson Gardens Health & Rehabilitation Center

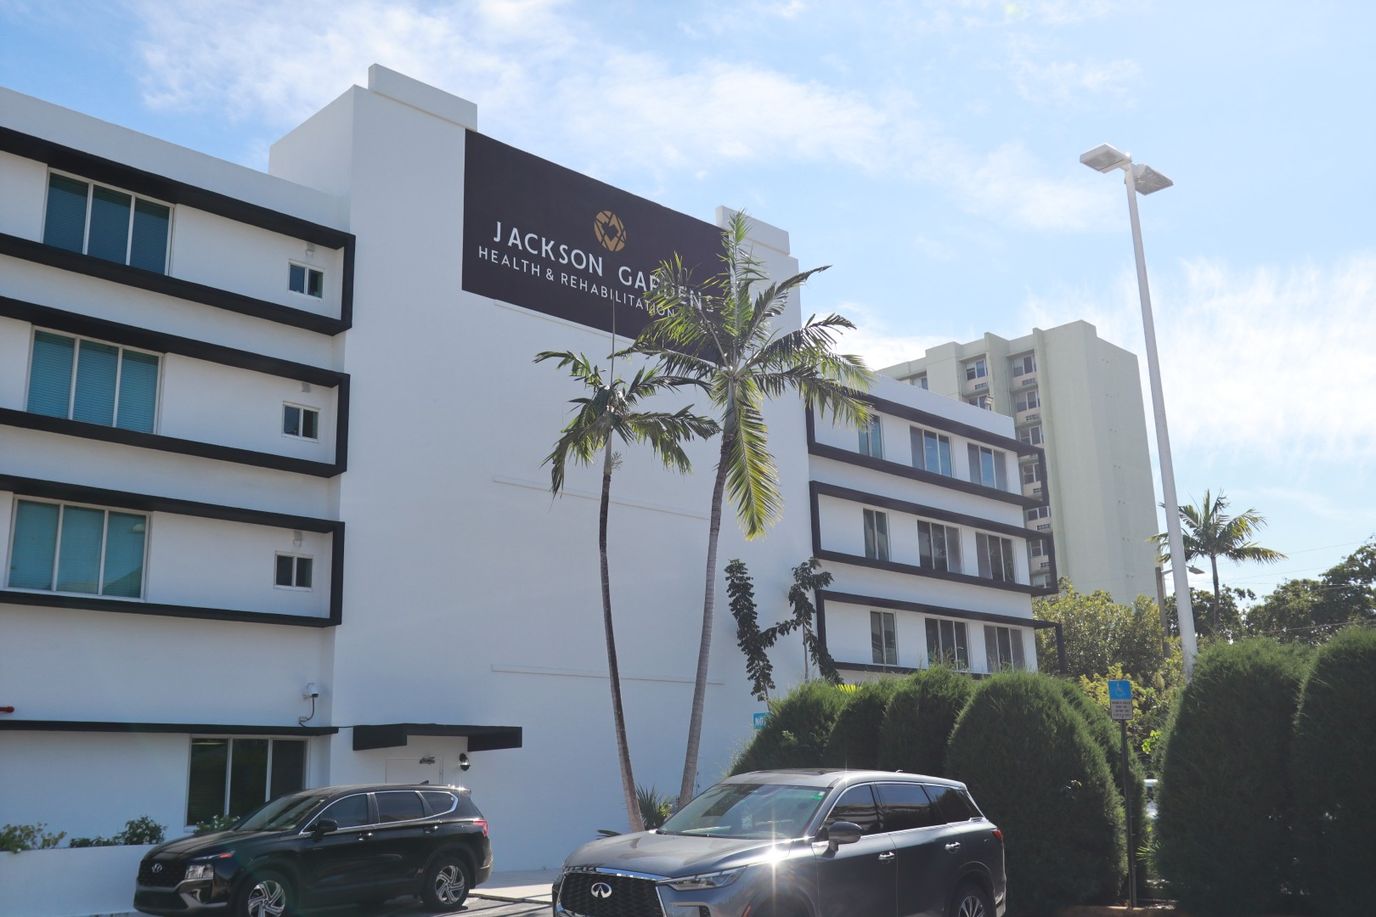
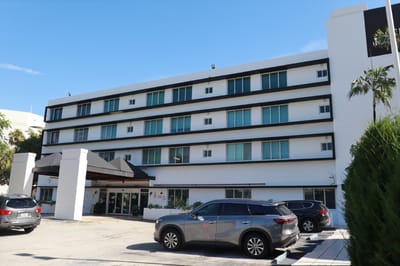
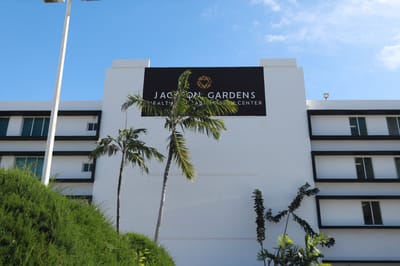
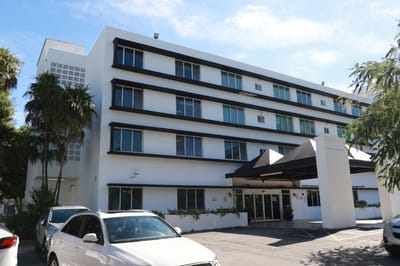
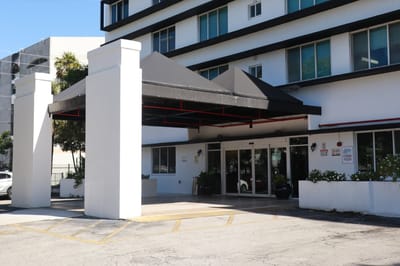
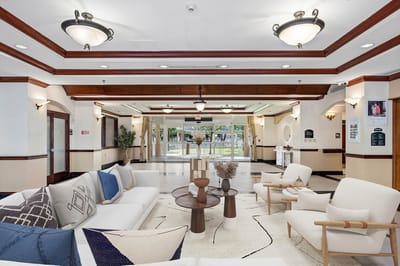
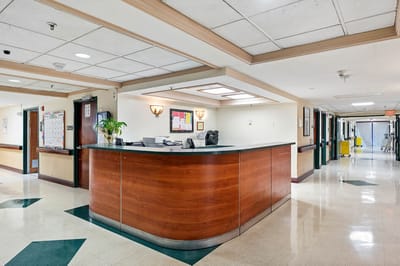
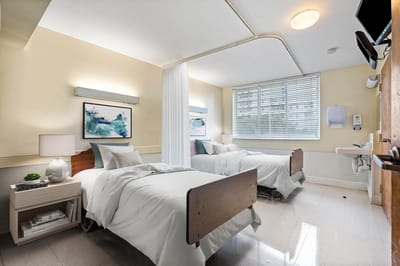
Surrounded by trusted hospitals like Jackson Memorial Hospital, University of Miami Health System, and Miami VA Medical Center, in Miami, FL, Jackson Gardens Health & Rehabilitation Center is an esteemed community that offers skilled nursing and rehabilitation. The community is dedicated to improving residents’ welfare, providing top-tier care tailored to their needs and preferences 24/7. Featuring thoughtfully designed and spacious accommodations in a nurturing and welcoming environment, residents feel at ease and jump back into their lives without worries.

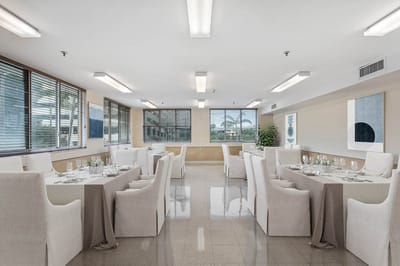
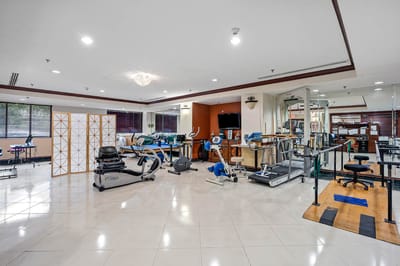
Enriching programs and fun recreation are conducted for residents to live actively and be socially engaged. Nutritious meals are also important for residents’ well-being so delightful and well-balanced meals are served to meet dietary needs and preferences. Live a blissful retirement surrounded by the community’s state-of-the-art amenities and welcoming spaces.

(305) 347-3380

Quality ratings

Measured by Centers for Medicare & Medicaid Services (CMS)

Overall rating Info The Overall CMS Rating combines results from health inspections, staffing levels and quality measures. Health inspections carry the most weight. Staffing and quality scores can increase or decrease the final rating based on performance compared to state and national standards.
▲ 57.5% Above FL avg. ▲ 57.5% Above FL avg.Click the badge to see the full State ranking.Click here to see the full State ranking.
Health Inspection Info Based on the results of the facility's three most recent standard inspections and any complaint investigations. CMS reviews the number, scope, and severity of deficiencies, with more recent findings weighted more heavily.
▲ 42.3% Above FL avg. ▲ 42.3% Above FL avg.Click the badge to see the full State ranking.Click here to see the full State ranking.
Staffing Info Measures average nursing staff hours per resident per day, including Registered Nurses (RNs) and total nursing staff. Ratings are adjusted based on the level of care residents require and are compared to state and national benchmarks.
▲ 18.2% Above FL avg. ▲ 18.2% Above FL avg.Click the badge to see the full State ranking.Click here to see the full State ranking.
Quality Measures Info Based on clinical and physical health indicators reported to CMS, such as hospital readmissions, falls, pressure ulcers, and improvements in mobility. These measures reflect how well residents' health needs are being managed.
▲ 23.2% Above FL avg. ▲ 23.2% Above FL avg.Click the badge to see the full State ranking.Click here to see the full State ranking.

Staffing hours breakdown

Info Daily nursing hours per resident by staff type, reported to CMS. Higher is generally better — compare this facility to state and national averages to see where staffing stands.

Hours per resident per day — compared to Florida state averages

Total nursing care / resident Info This home is ranked 197th out of 252 homes in Florida. Total adjusted nursing hours per resident per day, combining RN, LPN, and aide time. CMS adjusts this for case-mix so facilities can be fairly compared.
3h 36m per day
Rank #197 / 252Nurse hours — State benchmarkedThis home is ranked 197th out of 252 homes in Florida. Shows adjusted nurse hours per resident per day benchmarked to the Florida average, with a ranking across 252 Florida SNFs. More hours mean more direct care. The national average is about 3.5 hrs; below 3.0 is a red flag.Click the rank badge to see the full State ranking.Click here to see the full State ranking.
This facility Florida avg (4h 2m per day)
vs Florida avg
-11%

4 of 6 metrics below state avg

Standout metric RN (Weekend) is +113% above state avg
Staff typeHours / Day / Residentvs state avg
Registered Nurse (RN) Info RNs hold the highest nursing license and can assess residents, interpret test results, and direct care plans. More RN hours per day often signals stronger clinical oversight and faster response to health changes. 1h 17m per day ▲ 75% State avg: 44m per day · National avg: 41m per day
LPN / LVN Info Licensed Practical Nurses (LPNs) or Licensed Vocational Nurses (LVNs) deliver routine hands-on care — medication administration, wound dressing, and monitoring vital signs. They work under RN supervision and make up a large share of daily bedside care. 10m per day ▼ 79% State avg: 47m per day · National avg: 52m per day
Nurse Aide Info Certified Nurse Aides (CNAs) provide the most direct day-to-day assistance: bathing, dressing, feeding, and mobility. Nurse aide hours are typically the largest staffing category and directly affect residents' quality of life. 2h 11m per day ▼ 6% State avg: 2h 20m per day · National avg: 2h 21m per day
Total Nursing (Weekend) Info Combined nursing hours (RN + LPN + Nurse Aide) per resident per day on weekends. Staffing often drops on weekends — this figure reveals whether the facility maintains adequate coverage outside of weekday hours. 3h 24m per day ▼ 3% State avg: 3h 31m per day · National avg: 3h 26m per day
Physical Therapist Info Hours per resident per day provided by licensed Physical Therapists (PTs) or PT Assistants. PT services help residents recover mobility after injury or illness and are especially important for post-acute (short-stay) rehabilitation. 3m per day ▼ 40% State avg: 5m per day · National avg: 4m per day
RN (Weekend) Info Registered nurse hours specifically on weekends. Facilities sometimes reduce RN presence on Saturdays and Sundays — a low weekend RN figure compared to weekday hours can indicate reduced clinical oversight when most administrative staff are absent. 1h 8m per day ▲ 113% State avg: 32m per day · National avg: 29m per day

Types of Care at Jackson Gardens Health & Rehabilitation Center

Nursing Home Hospice Care

Capacity and availability

This home usually has limited availability

Occupancy between 85% and 95% suggests balanced demand.

Higher occupancy than the Florida average: 84.3%
Occupancy rate 94.1% Rank #40 / 255Occupancy rate — State benchmarkedThis home is ranked 40th out of 255 homes in Florida. Shows this facility's occupancy rate versus the Florida average, with its Statewide rank out of 255. Higher occupancy signals strong local demand and financial stability.Click the rank badge to see the full State ranking.Click here to see the full State ranking.
Avg. Length of Stay 92 days
Occupancy rate
94.1% Rank #40 / 255Occupancy rate — State benchmarkedThis home is ranked 40th out of 255 homes in Florida. Shows this facility's occupancy rate versus the Florida average, with its Statewide rank out of 255. Higher occupancy signals strong local demand and financial stability.Click the rank badge to see the full State ranking.Click here to see the full State ranking.
Avg. Length of Stay
92 days
Walk Score
Walk Score: 77 / 100 Rank #26 / 259Walk Score — State benchmarkedThis home is ranked 26th out of 259 homes in Florida. Shows how walkable this facility's neighborhood is compared to the average Walk Score across Florida SNFs. Higher scores benefit residents, families, and staff.Click the rank badge to see the full State ranking.Click here to see the full State ranking.
Very walkable. Most errands can be accomplished on foot, and many essentials are within a short walk.

Contact Jackson Gardens Health & Rehabilitation Center

Staffing Data

Reporting period: October 1 – December 31, 2025 (Q4 2025). Source: CMS Payroll-Based Journal report.

Total staff 160
Employees 150
Contractors 10
Staff to resident ratio 1.45:1
0% compared with Florida average
Florida average ratio: 1.52:1 Florida average ratio: 1.52:1See full Florida ranking
Avg staff/day 60
Average shift 7.8 hours
0% compared with Florida average
Florida average: 7.9 hours Florida average shift: 7.9 hoursSee full Florida ranking
Total staff hours (quarter) 43,074

Nursing staff breakdown

Q4 2025 · Oct 1 – Dec 31 More info This data comes from the CMS Payroll-Based Journal report covering October 1 – December 31, 2025.
Registered Nurse

Manages medical care and health needs.

Total count 48
Average shift length Info Average shift length. Calculated as total hours divided by days worked and average staff per day. 9 hours

No contractors work on this role.

Licensed Practical Nurse

Assists with medical care and medications.

Total count 8
Average shift length Info Average shift length. Calculated as total hours divided by days worked and average staff per day. 7.6 hours

No contractors work on this role.

Certified Nursing Assistant

Helps with daily care and mobility.

Total count 68
Average shift length Info Average shift length. Calculated as total hours divided by days worked and average staff per day. 7.6 hours

No contractors work on this role.

Contractor staffing

Q4 2025 · Oct 1 – Dec 31 More info This data comes from the CMS Payroll-Based Journal report covering October 1 – December 31, 2025.

Total hours from contractors

2.4%

1,022 contractor hours this quarter

Respiratory Therapy Technician: 2 Physical Therapy Assistant: 2 Qualified Social Worker: 2 Physical Therapy Aide: 2 Medical Director: 1 Occupational Therapy Assistant: 1

Staff by category

Q4 2025 · Oct 1 – Dec 31 More info This data comes from the CMS Payroll-Based Journal report covering October 1 – December 31, 2025.
Certified Nursing Assistant6806821,98992100%7.6
Registered Nurse4804811,63092100%9
Licensed Practical Nurse8081,67792100%7.6
Speech Language Pathologist4041,1696672%6.8
Dietitian3031,0968390%8.3
Physical Therapy Assistant3258537885%6.1
Clinical Nurse Specialist3037246571%7
Physical Therapy Aide2245895762%9.8
Dental Services Staff2025236571%8
Respiratory Therapy Technician2245017683%3.8
Qualified Social Worker1234796368%7.4
Occupational Therapy Aide2024385661%7.8
Administrator1013675358%6.9
Nurse Practitioner1013625257%7
RN Director of Nursing1013304953%6.7
Mental Health Service Worker1012904145%7.1
Medical Director011301112%2.7
Occupational Therapy Assistant0112889%3.5
68 Certified Nursing Assistant
% of Days 100%
48 Registered Nurse
% of Days 100%
8 Licensed Practical Nurse
% of Days 100%
4 Speech Language Pathologist
% of Days 72%
3 Dietitian
% of Days 90%
5 Physical Therapy Assistant
% of Days 85%
3 Clinical Nurse Specialist
% of Days 71%
4 Physical Therapy Aide
% of Days 62%
2 Dental Services Staff
% of Days 71%
4 Respiratory Therapy Technician
% of Days 83%
3 Qualified Social Worker
% of Days 68%
2 Occupational Therapy Aide
% of Days 61%
1 Administrator
% of Days 58%
1 Nurse Practitioner
% of Days 57%
1 RN Director of Nursing
% of Days 53%
1 Mental Health Service Worker
% of Days 45%
1 Medical Director
% of Days 12%
1 Occupational Therapy Assistant
% of Days 9%

Penalties and fines

Federal penalties imposed by CMS for regulatory violations, including civil money penalties (fines) and denials of payment for new Medicare/Medicaid admissions.

Source: CMS Penalties Database

No penalties in the past 3 years

No civil money penalties or payment denials were reported in the last 3 years.

Quality of care over time

These measures show how residents usually do over time at this home, based on health outcomes and preventive care.

High-risk clinical events score Info A composite score based on pressure ulcers, falls with injury, weight loss, walking ability decline, and activities of daily living decline. 3.2
57% better than Florida average

Florida average: 7.4

Functional decline score Info A composite score based on activities of daily living decline, walking ability decline, and incontinence. 2.7
78% better than Florida average

Florida average: 12.4

Long-stay resident measures
Significantly above average Florida avg: 4.5 Info CMS star rating based on long-stay quality measure performance. 5 stars = significantly above average, 1 star = significantly below average.
Need for Help with Daily Activities Increased Info Percent of long-stay residents whose need for help with daily activities has increased 3.2%
69% better than Florida average

Florida average: 10.5%

Walking Ability Worsened Info Percent of long-stay residents whose ability to move independently worsened 3.1%
76% better than Florida average

Florida average: 12.9%

Low Risk Residents with Bowel/Bladder Incontinence Info Percent of low risk long-stay residents who lose control of their bowels or bladder 1.7%
87% better than Florida average

Florida average: 13.5%

Falls with Major Injury Info Percent of long-stay residents experiencing one or more falls with major injury 1.2%
53% better than Florida average

Florida average: 2.6%

High Risk Residents with Pressure Ulcers Info Percent of long-stay high risk residents with pressure ulcers 1.7%
68% better than Florida average

Florida average: 5.4%

Urinary Tract Infection Info Percent of long-stay residents with a urinary tract infection 0.0%
100% better than Florida average

Florida average: 0.9%

Lost Too Much Weight Info Percent of long-stay residents who lose too much weight 6.9%
14% worse than Florida average

Florida average: 6.0%

Depressive Symptoms Info Percent of long-stay residents who have depressive symptoms 0.6%
83% better than Florida average

Florida average: 3.3%

Antipsychotic Use Info Percent of long-stay residents who received an antipsychotic medication 3.2%
60% better than Florida average

Florida average: 8.0%

Pneumococcal Vaccine Info Percent of long-stay residents assessed and appropriately given the pneumococcal vaccine 100.0%
In line with Florida average

Florida average: 97.7%

Influenza Vaccine Info Percent of long-stay residents assessed and appropriately given the seasonal influenza vaccine 100.0%
In line with Florida average

Florida average: 99.2%

Hospitalizations per 1,000 days Info Number of hospitalizations per 1,000 long-stay resident days. 1.92
9% better than Florida average

Florida average: 2.10

ED visits per 1,000 days Info Number of outpatient emergency department visits per 1,000 long-stay resident days. 0.39
67% better than Florida average

Florida average: 1.18

Short-stay resident measures
Above average Florida avg: 3.1 Info CMS star rating based on short-stay quality measure performance. 5 stars = much above average, 1 star = much below average.
Pneumococcal Vaccine Info Percent of short-stay residents assessed and appropriately given the pneumococcal vaccine 100.0%
6% better than Florida average

Florida average: 94.0%

Antipsychotic medication increase Info Percent of short-stay residents who newly received an antipsychotic medication 1.6%
7% worse than Florida average

Florida average: 1.5%

Influenza Vaccine Info Percent of short-stay residents assessed and appropriately given the seasonal influenza vaccine 100.0%
6% better than Florida average

Florida average: 94.7%

Re-hospitalized after SNF stay Info Percentage of short-stay residents who were re-hospitalized after their nursing home admission. 21.5%
18% better than Florida average

Florida average: 26.2%

Emergency department visits Info Percentage of short-stay residents who had an outpatient emergency department visit. 0.0%
100% better than Florida average

Florida average: 9.3%

Falls with major injury Info Percentage of SNF residents who experience falls with major injury during their stay. 0.0%
100% better than Florida average

Florida average: 0.8%

Ability to care for self at discharge Info Percentage of residents at or above expected ability to care for themselves at discharge. 57.8%
8% better than Florida average

Florida average: 53.7%

Successful return to home or community Info Rate of successful return to home or community from a skilled nursing facility. 28.4%
44% worse than Florida average

Florida average: 50.6%

Breakdown by payment type

Medicare

38% of new residents, usually for short-term rehab.

Typical stay 29 days

Private pay

24% of new residents, often for short stays.

Typical stay 2 - 3 months

Medicaid

37% of new residents, often for long-term daily care.

Typical stay 5 - 6 months

Facility Characteristics

Source: CMS Long-Term Care Facility Characteristics (Data as of Jan 2026)

Total residents 110
Medicare
18
16.4% of residents
Medicaid
69
62.7% of residents
Private pay or other
23
20.9% of residents
Programs & Services
Residents Group

Residents meet regularly to discuss policies, care quality, and activities

Active Resident Council

Organized group of residents that meets regularly to discuss facility policies, quality of life, and activities.

Finances and operations

Privately-owned community
Home revenue
$15.7M
Profit
$508.1K
Privately-owned community
Home revenue
$15.7M Rank #160 / 256Revenue — State benchmarkedThis home is ranked 160th out of 256 homes in Florida. Shows this facility's annual revenue compared to the Florida SNF average. Higher revenue generally means more resources for staffing and capital — read alongside Payroll %.Click the rank badge to see the full State ranking.Click here to see the full State ranking.
Profit
$508.1K
Payroll costs Info The portion of the home's budget spent on staff, including nurses, caregivers, and other employees who support care and operations. Rank #161 / 256Payroll — State benchmarkedThis home is ranked 161st out of 256 homes in Florida. Shows total annual staff payroll benchmarked to the Florida average. Higher payroll investment relative to peers often signals better staffing and less reliance on cheaper contract labor.Click the rank badge to see the full State ranking.Click here to see the full State ranking.
$7.1M
45.1% of revenue Rank #123 / 256Payroll % — State benchmarkedThis home is ranked 123rd out of 256 homes in Florida. Shows payroll as a percentage of revenue versus the Florida average. Well-run Florida SNFs typically land around 49–56% — the top third Statewide. Below 25% may signal understaffing or heavy agency use — read with Staffing ratings.Click the rank badge to see the full State ranking.Click here to see the full State ranking.
Other operating costs Info All remaining costs needed to run the home, such as food, utilities, building maintenance, supplies and administrative expenses.
$8.1M
Total costs $15.2M

What does this home offer?

Total residents icon

Total Residents: 110 Residents

Housing options icon

Housing Options: Private / Semi-private Rooms

Building type icon
Building type icon

Building Type: Mid-rise

Dining services icon

Dining Services

Safety systems icon
Safety systems icon

Safety Systems

Health Programs icon

Health Programs

Who this home usually serves

TYPE OF STAY

Mostly short-term rehab stays

Most residents typically stay for a few weeks or months before returning home or moving on.

Places of interest near Jackson Gardens Health & Rehabilitation Center

Address 3.1 miles from city center Info Estimated distance in miles from Miami's city center to Jackson Gardens Health & Rehabilitation Center's address, calculated via Google Maps.

Calculate Travel Distance to Jackson Gardens Health & Rehabilitation Center

Add your location

Address

Financial Assistance for
Nursing Home in Florida

Jackson Gardens Health & Rehabilitation Center is located in Miami, Florida.
Here are the financial assistance programs available to residents in Florida.

Get Financial aid guidance

Long-Term Care Waiver

Florida Medicaid LTC Waiver

Age 65+ or 21+ disabled
General Florida resident, Medicaid- eligible, nursing home-level care need.
Income Limits (2025) ~$2,829/month 300% FBR, individual
Asset Limits $2,000 (individual), $3,000 (couple).
FL

High demand; waitlists common.

Benefits
In-home care (6-8 hours/day) Assisted living Respite (240 hours/year) Case management

Community Care for the Elderly (CCE)

Florida CCE

Age 60+
General Florida resident, at risk of nursing home.
Income Limits ~$2,000/month varies
Asset Limits $5,000 individual
FL

Limited funding; regional variation.

Benefits
Homemaker services (3-5 hours/week) Adult day care (~$60/day) Respite (up to 10 days/year)

Home Care for the Elderly (HCE)

Florida Home Care for the Elderly

Age 60+
General Florida resident, at risk of nursing home placement; caregiver must be approved.
Income Limits (2025) ~$2,829/month individual, aligned with Medicaid thresholds
Asset Limits ~$2,000 (individual); varies by case manager discretion.
FL

Limited funding (~3,500 served annually); prioritizes low-income frail seniors.

Benefits
Basic subsidy (~$160/month) for housing/medical costs; special subsidies for supplies/services (e.g., incontinence supplies, ~$50-$200/month)

Program of All-Inclusive Care for the Elderly (PACE)

Florida Medicaid PACE

Age 55+
General Florida resident, nursing home-level care need, safe with PACE support.
Income Limits (2025) ~$2,829/month 300% FBR
Asset Limits $2,000 (individual), $3,000 (couple).
FL

Limited to specific counties (e.g., Hillsborough, Miami-Dade); ~10 sites statewide.

Benefits
Personal care (5-7 hours/day) Medical care Meals Transportation Therapy

Optional State Supplementation (OSS)

Florida Optional State Supplementation

Age 65+ or disabled
General Florida resident, living in approved facility, receiving SSI or low-income.
Income Limits (2025) ~$1,004/month individual, including SSI
Asset Limits $2,000 (individual), $3,000 (couple).
FL

Limited to specific facility types; ~$78.40/month max supplement.

Benefits
Cash payment (~$78.40/month) for room/board or personal needs in facilities

Compare Nursing Home around Miami-dade County

The information below is reported by the Florida Agency for Health Care Administration (AHCA).

5 facilities compared · CMS & FL Dept. of Health data

Filter by care type
Kendall Lakes Health and Rehabilitation Center
NH

Nursing Home Licensed facility providing 24/7 skilled nursing care for residents with complex, ongoing medical needs. Staffed by RNs, LPNs, and CNAs. Inspected and star-rated annually by CMS. Accepts Medicare (short-term rehab) and Medicaid (long-term care).

Miami (West End)150 95.0% +13%3.38 +97%-16%$0113.7-144 60 Kendall Lakes Snf Holdco LLC$29.2M$9.9M34%686123
Coral Gables Nursing and Rehabilitation
NH

Nursing Home Licensed facility providing 24/7 skilled nursing care for residents with complex, ongoing medical needs. Staffed by RNs, LPNs, and CNAs. Inspected and star-rated annually by CMS. Accepts Medicare (short-term rehab) and Medicaid (long-term care).

HC

Home Care Professional care delivered in the person's own home — from companionship and errands to skilled nursing and therapy. Allows seniors to age in place. Medicare covers skilled home health when medically necessary.

RC

Respite Care Short-term temporary care — days to weeks — to give family caregivers a break. Full care provided during the stay. Often used after hospitalization or to trial a facility before a permanent placement decision.

Miami (White House Trailer Park)87 88.5% +5%4.07 +164%+1%$031.5-81 88 Coral Gables Holdings LLC$11.4M$5.5M47.8%105005
Catholic Hospice Inpatient Care Center St. Catherine’s West Rehabilitation Hospital
NH

Nursing Home Licensed facility providing 24/7 skilled nursing care for residents with complex, ongoing medical needs. Staffed by RNs, LPNs, and CNAs. Inspected and star-rated annually by CMS. Accepts Medicare (short-term rehab) and Medicaid (long-term care).

HC

Home Care Professional care delivered in the person's own home — from companionship and errands to skilled nursing and therapy. Allows seniors to age in place. Medicare covers skilled home health when medically necessary.

Hialeah (Hialeah Gardens)27 90.5% +7%5.80 +46%+44%$0103.3-25 80 -$7.3M$3.1M42%106080
Jackson Gardens Health & Rehabilitation Center
NH

Nursing Home Licensed facility providing 24/7 skilled nursing care for residents with complex, ongoing medical needs. Staffed by RNs, LPNs, and CNAs. Inspected and star-rated annually by CMS. Accepts Medicare (short-term rehab) and Medicaid (long-term care).

HC

Home Care Professional care delivered in the person's own home — from companionship and errands to skilled nursing and therapy. Allows seniors to age in place. Medicare covers skilled home health when medically necessary.

Miami (Allapattah)120 94.1% +12%3.60 +153%-11%$0144.7-112 77 Jackson Opco Holdings, LLC$15.7M$7.1M45.1%106034
Miami Jewish Health
NH

Nursing Home Licensed facility providing 24/7 skilled nursing care for residents with complex, ongoing medical needs. Staffed by RNs, LPNs, and CNAs. Inspected and star-rated annually by CMS. Accepts Medicare (short-term rehab) and Medicaid (long-term care).

AL

Assisted Living A licensed, long-term care setting for seniors or individuals with disabilities who need help with daily activities — like bathing, dressing, and medication management — but not 24-hour skilled nursing. Offers housing, meals, and around-the-clock support while aiming to maximize resident independence.

HC

Home Care Professional care delivered in the person's own home — from companionship and errands to skilled nursing and therapy. Allows seniors to age in place. Medicare covers skilled home health when medically necessary.

IL

Independent Living Lifestyle-focused communities for older adults offering dining, activities, and transportation with minimal personal care. Best for active, independent seniors who want community without medical support.

MC

Memory Care Secured, specialized care for people living with Alzheimer's or dementia. Staff trained in cognitive impairment, with higher staff-to-resident ratios and an environment designed to reduce confusion and wandering risk.

Miami (Northeast 2Nd Avenue)393--6.81 -33%+69%$15.6k122.02299 84 ----105030

Frequently Asked Questions about Jackson Gardens Health & Rehabilitation Center

What neighborhood is Jackson Gardens Health & Rehabilitation Center in?

Jackson Gardens Health & Rehabilitation Center is in the Allapattah neighborhood.

Is Jackson Gardens Health & Rehabilitation Center in a walkable area?

Jackson Gardens Health & Rehabilitation Center has a walk score of 77. Very walkable. Most errands can be accomplished on foot, and many essentials are within a short walk.

What is the address of Jackson Gardens Health & Rehabilitation Center?

Jackson Gardens Health & Rehabilitation Center is located at 1861 NW 8th Ave Unit 321w, Miami, FL 33136.

What is the phone number of Jackson Gardens Health & Rehabilitation Center?

(305) 347-3380 will put you in contact with the team at Jackson Gardens Health & Rehabilitation Center.

Is Jackson Gardens Health & Rehabilitation Center Medicare or Medicaid certified?

Yes — Jackson Gardens Health & Rehabilitation Center is a CMS-certified provider of Medicare and Medicaid.

Guides for Better Senior Living

Care Cost Calculator: See Prices in Your Area

Nursing Home Data Explorer

Don’t Wait Too Long: 7 Red Flag Signs Your Parent Needs Assisted Living Now

The True Cost of Assisted Living in 2025 – And How Families Are Paying For It

Understanding Senior Living Costs: Pricing Models, Discounts & Financial Assistance

Explore Open Rooms
1 Contact details
2 What type of senior care service are you looking for?
3 What budget do you have in mind for senior care?
4 How soon do you need to find care?
5 Additional details

Thank you for your interest!

Our team will be in touch shortly to help with next steps.