


Occupancy rate
100%


Knox Community Hospital sits directly across the street from Country Club Center II in Mount Vernon, Ohio. That proximity is a practically significant feature for a nursing home whose 48-day average length of stay reflects a meaningful short-term rehabilitation and post-acute patient population.
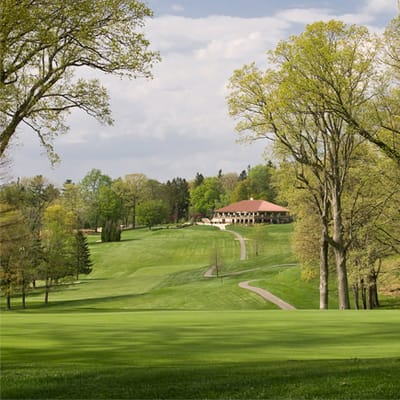
Country Club Center II is a 55-bed nursing home and assisted living community at 1350 Yauger Road in Knox County, part of the Country Club Rehabilitation Campus. The campus spans 35 wooded acres and operates as a continuing care retirement community encompassing independent living, assisted living, memory care, skilled nursing, and rehabilitation. Administrator Aleta Bullock and Director of Nursing Kyla Rinehart lead Country Club Center II.
Medicare, Medicaid, and private pay are all accepted. Occupancy is 100 percent across 55 beds. Nursing staff are on-site 24 hours, with registered nurse hours at 29 minutes per resident per day and total nursing care at 3 hours and 12 minutes per resident per day. On-campus physical therapy, occupational therapy, and speech therapy run seven days per week; simultaneously, respite stays are available.
Studio room configurations are offered, while meals are prepared home-style. The surrounding neighborhood is very walkable, with a Walk Score of 89. An active Resident Council meets regularly.
Country Club Center II is a CCRC-embedded nursing home and assisted living community in Mount Vernon with 24-hour nursing, on-campus therapy seven days per week, and direct hospital access across the street. Medicare, Medicaid, and private pay are accepted at a facility running at full occupancy.
| Staff type | Hours / Day / Resident | vs state avg |
|---|---|---|
|
Registered Nurse (RN)
| 29m per day | ▼ 24% State avg: 38m per day · National avg: 41m per day |
|
LPN / LVN
| 50m per day | ▼ 13% State avg: 58m per day · National avg: 52m per day |
|
Nurse Aide
| 2h 1m per day | ▼ 5% State avg: 2h 8m per day · National avg: 2h 20m per day |
|
Weekend Total Nursing
| 3h 0m per day | ▼ 9% State avg: 3h 17m per day · National avg: 3h 26m per day |
|
Physical Therapist
| 0m per day | ▼ 100% State avg: 3m per day · National avg: 4m per day |
|
Weekend RN
| 13m per day | ▼ 48% State avg: 25m per day · National avg: 28m per day |
Country Club Center II is administered by Aleta Bullock.
Key information about the people who lead and staff this community.
In Ohio, the Department of Health, Bureau of Survey and Certification conducts unannounced onsite inspections to evaluate the quality of care and environment in all licensed facilities.
Citations
| This Facility | OH Average | vs. OH Avg |
|---|---|---|---|
|
Total citations
| 1 | 2 | This facility has 50% fewer total citations than a typical Ohio nursing home (1 vs. OH avg 2).↓ 50% better |
Ohio average 6.7
Last Health inspection on Jun 2025
Ohio average 30.9
Ohio average 4.59
Health citations are formal notices following inspections when they fail to comply with safety and care standards.
29 of 40 citations resulted from standard inspections; and 11 of 40 resulted from complaint investigations.
Ohio average: 0.3
Ohio average: 0.9
Reporting period: October 1 – December 31, 2025 (Q4 2025). Source: CMS Payroll-Based Journal report.
Manages medical care and health needs.
Assists with medical care and medications.
Helps with daily care and mobility.
Total hours from contractors
24 contractor hours this quarter
| Certified Nursing Assistant | 172 | 0 | 172 | 13,524 | 92 | 100% | 8.5 |
| Licensed Practical Nurse | 18 | 0 | 18 | 4,953 | 92 | 100% | 9.4 |
| Registered Nurse | 19 | 0 | 19 | 2,054 | 92 | 100% | 8 |
| Other Dietary Services Staff | 4 | 0 | 4 | 1,479 | 91 | 99% | 7.4 |
| Clinical Nurse Specialist | 2 | 0 | 2 | 678 | 55 | 60% | 8.5 |
| RN Director of Nursing | 2 | 0 | 2 | 657 | 64 | 70% | 9 |
| Administrator | 1 | 0 | 1 | 520 | 65 | 71% | 8 |
| Nurse Practitioner | 1 | 0 | 1 | 484 | 55 | 60% | 8.8 |
| Mental Health Service Worker | 1 | 0 | 1 | 399 | 48 | 52% | 8.3 |
| Dietitian | 2 | 0 | 2 | 211 | 27 | 29% | 7.8 |
| Occupational Therapy Aide | 1 | 0 | 1 | 183 | 20 | 22% | 9.2 |
| Medical Director | 1 | 0 | 1 | 30 | 12 | 13% | 2.5 |
| Occupational Therapy Assistant | 0 | 1 | 1 | 24 | 3 | 3% | 8 |
Federal penalties imposed by CMS for regulatory violations, including civil money penalties (fines) and denials of payment for new Medicare/Medicaid admissions.
Source: CMS Penalties Database
No penalties in the past 3 years
No civil money penalties or payment denials were reported in the last 3 years.
These measures show how residents usually do over time at this home, based on health outcomes and preventive care.
Ohio average: 5.8
Ohio average: 12.7
Ohio average: 6.8%
Ohio average: 8.9%
Ohio average: 22.0%
Ohio average: 3.4%
Ohio average: 3.9%
Ohio average: 0.5%
Ohio average: 6.2%
Ohio average: 24.0%
Ohio average: 8.4%
Ohio average: 92.4%
Ohio average: 94.5%
Ohio average: 1.77
Ohio average: 1.83
Ohio average: 78.0%
Ohio average: 1.3%
Ohio average: 75.6%
Ohio average: 25.1%
Ohio average: 12.5%
Ohio average: 0.8%
Ohio average: 53.7%
Ohio average: 50.6%
Quality measures are calculated from Minimum Data Set (MDS) assessments. For most measures, lower percentages indicate better care quality.
30% of new residents, usually for short-term rehab.
53% of new residents, often for short stays.
16% of new residents, often for long-term daily care.
Source: CMS Long-Term Care Facility Characteristics (Data as of Jan 2026)
Residents meet regularly to discuss policies, care quality, and activities
Part of a Continuing Care Retirement Community offering multiple care levels
Organized group of residents that meets regularly to discuss facility policies, quality of life, and activities.
Data sourced from CMS Long-Term Care Facility Characteristics quarterly report. Payer mix reflects the current resident census by primary payment source.
Historical financial and operational data for Country Club Center II from 2011–2023, based on CMS SNF Cost Reports.
Key figures below are for fiscal year ending in 12/2023.
Based on CMS SNF Cost Report for fiscal year ending in 12/2023.
This home supports both short-term rehab and long-term care, with residents staying for a wide range of durations.
Most new residents arrive under private pay (53% of admissions), and a typical private pay stay runs around 1 months.
Coverage residents most often arrive under.
Coverage residents most often leave under.
![]() 0.0 miles from city center
0.0 miles from city center
![]() Estimated distance in miles from Mount Vernon's city center to Country Club Center II's address, calculated via Google Maps.
Estimated distance in miles from Mount Vernon's city center to Country Club Center II's address, calculated via Google Maps.
Add your location
Info below is compiled from CMS reports & the OH Dept. of Health, senior community websites & trusted data sources such as Walk Score & BBB.
Communities are listed from highest to lowest based on our ranking methodology.
| Laurels of Mt. Vernon | AL HOS MC NH PC RC SNF | Mt Vernon | 99
Facility
99
OH AVG
75
Rank
#69 / 309 |
80.9%
Facility
80.9%
OH AVG
81.7
Rank
#90 / 138 | -1% | 3.32
Facility
3.32
OH AVG
3.54
Rank
#122 / 199 | +38% | -6% | $0
Facility
$0
OH AVG
$74.0k
Rank
#1 / 200 | 35
Facility
35
OH AVG
30.9
Rank
#123 / 199 | 5.8
Facility
5.8
OH AVG
4.6
Rank
#165 / 199 | - | 80 | - |
69
Facility
69
OH AVG
40
Rank
#77 / 704 | Cassie Hauber | $8.8MFiscal year ending 12/2023
Facility
$8.8MFiscal year ending 12/2023
OH AVG
$10.1M
Rank
#90 / 199 | $5.7MFiscal year ending 12/2023
Facility
$5.7MFiscal year ending 12/2023
OH AVG
$3.9M
Rank
#79 / 199 | 65.1%Fiscal year ending 12/2023
Facility
65.1%Fiscal year ending 12/2023
OH AVG
40.2%
Rank
#88 / 199 | 365404 | ||||
| Country Club Center II | AL NH MC | Mount Vernon | 55
Facility
55
OH AVG
75
Rank
#196 / 309 | - | - | 3.20
Facility
3.20
OH AVG
3.54
Rank
#141 / 199 | -9% | -10% | $0
Facility
$0
OH AVG
$74.0k
Rank
#1 / 200 | 40
Facility
40
OH AVG
30.9
Rank
#151 / 199 | 5.0
Facility
5.0
OH AVG
4.6
Rank
#140 / 199 | 3 | 65 | - |
89
Facility
89
OH AVG
40
Rank
#2 / 704 | - | $7.6MFiscal year ending 12/2023
Facility
$7.6MFiscal year ending 12/2023
OH AVG
$10.1M
Rank
#81 / 199 | $2.6MFiscal year ending 12/2023
Facility
$2.6MFiscal year ending 12/2023
OH AVG
$3.9M
Rank
#153 / 199 | 34.4%Fiscal year ending 12/2023
Facility
34.4%Fiscal year ending 12/2023
OH AVG
40.2%
Rank
#194 / 199 | 365815 |
Country Club Center II is located in MOUNT VERNON, Ohio.
Here are the financial assistance programs available to residents in Ohio.
Kyla Rinehart is the Director of Nursing at Country Club Center II.
Country Club Center II has a walk score of 89. Very walkable. Most errands can be accomplished on foot, and many essentials are within a short walk.
Country Club Center II's occupancy is 100%.
No, Country Club Center II has a no-pet policy.
The team at Country Club Center II can be reached at ADMINISTRATOR@CCRCII.COM.
Country Club Center II is registered as a for-profit in OH.
Aleta Bullock is the administrator of Country Club Center II.
Care Cost Calculator: See Prices in Your Area
Nursing Home Data Explorer
Don’t Wait Too Long: 7 Red Flag Signs Your Parent Needs Assisted Living Now
The True Cost of Assisted Living in 2025 – And How Families Are Paying For It
Understanding Senior Living Costs: Pricing Models, Discounts & Financial Assistance


