Explore Open Rooms
1 Contact details
2 What type of senior care service are you looking for?
3 What budget do you have in mind for senior care?
4 How soon do you need to find care?
5 Additional details

Thank you for your interest!

Our team will be in touch shortly to help with next steps.

Nursing Home in Cleveland

CMS overall rating Info The Overall CMS Rating combines results from health inspections, staffing levels and quality measures. Health inspections carry the most weight. Staffing and quality scores can increase or decrease the final rating based on performance compared to state and national standards.

Crawford Manor Health Care Center

Overview of Crawford Manor Health Care Center

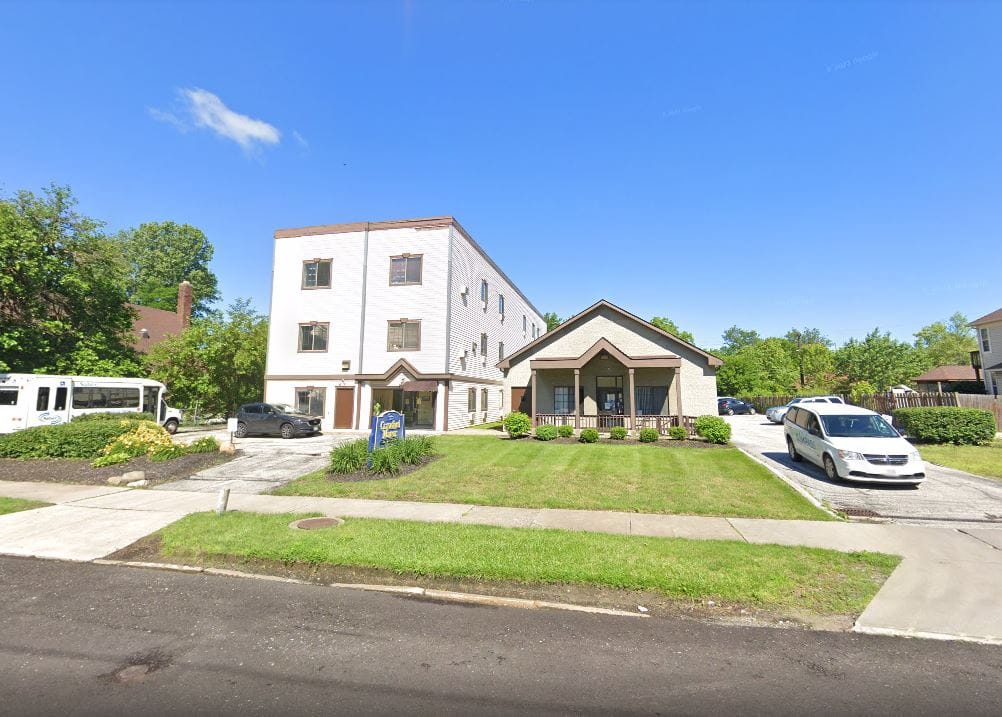
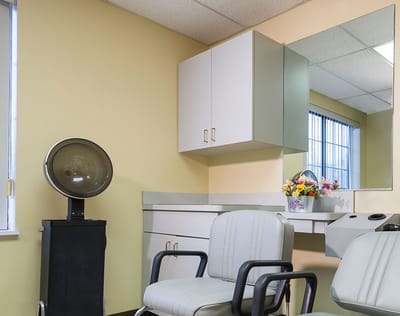
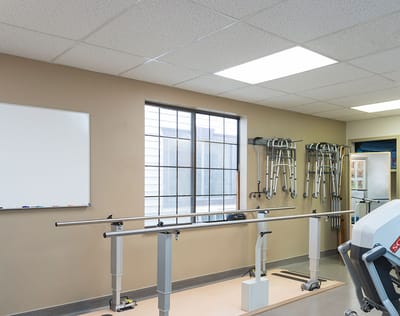
Ideally located in a residential area near Cleveland Clinic and University Hospital, seniors can receive high-quality care at Crawford Manor Health Care Center. They offer short-term skilled nursing care, long-term care, rehabilitation services (physical, occupational and speech therapy), respite care, and memory care. Assisted living options are also available where residents are assured they are met with empathetic staff and a great deal of socialization activities.
Living up to the Saber Healthcare Group brand, Crawford Manor boasts of providing customized support programs through committed and compassionate caregivers. Focusing on wellness, each resident is supported consistently and holistically to achieve the highest quality of life possible in this wonderful community.

(216) 795-5710

Quality ratings

Measured by Centers for Medicare & Medicaid Services (CMS)

Overall rating Info The Overall CMS Rating combines results from health inspections, staffing levels and quality measures. Health inspections carry the most weight. Staffing and quality scores can increase or decrease the final rating based on performance compared to state and national standards.
3/5
Ohio average: 3.4/5
Health Inspection Info Based on the results of the facility's three most recent standard inspections and any complaint investigations. CMS reviews the number, scope, and severity of deficiencies, with more recent findings weighted more heavily.
2/5
Ohio average: 2.9/5
Staffing Info Measures average nursing staff hours per resident per day, including Registered Nurses (RNs) and total nursing staff. Ratings are adjusted based on the level of care residents require and are compared to state and national benchmarks.
2/5
Ohio average: 2.9/5
Quality Measures Info Based on clinical and physical health indicators reported to CMS, such as hospital readmissions, falls, pressure ulcers, and improvements in mobility. These measures reflect how well residents' health needs are being managed.
5/5
Ohio average: 4.4/5

Nursing care per resident

Info This shows how many total hours of nursing staff time are available per resident each day. Higher numbers usually mean more staff support.
3h 43m per day

This home provides 3% less nursing time per resident than the Ohio average.

Ohio average: 3h 50m per day

Staffing hours breakdown

Info Hours of care per resident per day, broken down by staff type. Data from CMS Medicare.
Staff type Facility State avg National avg
Registered Nurse (RN) Info Registered nurse hours per resident per day. 33m per day 38m per day 41m per day
Nurse Aide Info Nurse aide hours per resident per day. 1h 42m per day 2h 8m per day 2h 21m per day
Total Nursing (Weekend) Info Total number of nurse staff hours per resident per day on weekends. 3h 1m per day 3h 17m per day 3h 26m per day
Physical Therapist Info Physical therapist staff hours per resident per day. 3m per day 3m per day 4m per day
RN (Weekend) Info Registered nurse hours per resident per day on weekends. 19m per day 25m per day 29m per day

Capacity and availability

Smaller home

May offer a more intimate, personalized care environment.

Total beds 50

This home usually has availability

Lower occupancy suggests more openings may be available.

Lower demand than the Ohio average
Occupancy rate 68%
Residents per day (avg) 33
Occupancy rate
68%
Residents per day (avg)
33

Who this home usually serves

TYPE OF STAY

Primarily short stays

Residents typically stay for brief periods, with frequent admissions and discharges throughout the year.

Might be optimal for
Post-acute recovery Temporary care Transitional stays

Breakdown by payment type

Medicare

12% of new residents, usually for short-term rehab.

Typical stay 24 days

Private pay

78% of new residents, often for short stays.

Typical stay 5 - 6 months

Medicaid

10% of new residents, often for long-term daily care.

Typical stay 1 years

Finances and operations

Privately-owned community
Operated by a business corporation.
Home revenue
$4.4M
Operating loss
-$267.4K
Privately-owned community Operated by a business corporation.
Home revenue
$4.4M
Operating loss
-$267.4K
Payroll costs Info The portion of the home's budget spent on staff, including nurses, caregivers, and other employees who support care and operations.
$2.1M
47.9% of revenue
Other operating costs Info All remaining costs needed to run the home, such as food, utilities, building maintenance, supplies and administrative expenses.
$2.6M
Total costs $4.7M
Years in operation
24 years in operation
A longer operating history, which may indicate experience navigating regulations and delivering ongoing care.
Walk Score
Walk Score: 70 / 100
Very walkable. Most errands can be accomplished on foot, and many essentials are within a short walk.
BBB Rating
BBB Rating: D- (Not Accredited)
An independent rating from the Better Business Bureau based on factors such as complaint history, transparency, and business practices.
How BBB ratings work

Additional Licensing Details

CMS Certification Number366110

Staffing

Key information about the people who lead and staff this community.

Leadership

ContactMs. Maxine Ross, Owner

Contact Crawford Manor Health Care Center

Inspection History

In Ohio, the Department of Health, Bureau of Survey and Certification conducts unannounced onsite inspections to evaluate the quality of care and environment in all licensed facilities.

8 visits/inspections

7 visits/inspections triggered by complaints

1 routine inspections

Results

8 with issues

0 without issues

Latest inspection

Date December 4, 2024
Complaint Investigation

43 deficiencies

Deficiencies indicate regulatory issues. A higher number implies the facility had several areas requiring improvement.

Ohio average: 29 deficiencies

Health Inspection History

Inspections
Total health inspections 8

Ohio average 6.7


Last Health inspection on Dec 2024

Total health citations 45

Ohio average 30.9

Citations per inspection
5.62

Ohio average 4.59


Health citations are formal notices following inspections when they fail to comply with safety and care standards.

35 of 45 citations resulted from standard inspections; and 10 of 45 resulted from complaint investigations.

Breakdown of citation severity (last 3 years)
Critical Health citations More info 2
567% worse than Ohio average

Ohio average: 0.3


Serious Health citations More info 0
100% better than Ohio average

Ohio average: 0.9

2 critical citations More info Ohio average: 0.3

0 serious citations More info Ohio average: 0.9

42 moderate citations More info Ohio average: 29

1 minor citation More info Ohio average: 0.7
Citations history (last 3 years)
Quality of Care critical citation Info Issues related to how well residents receive appropriate treatment and support for their medical and daily care needs. Dec 20, 2024
Corrected

Abuse/Neglect moderate citation Info Issues related to protecting resident's from harm, including abuse, neglect, or mistreatment. Oct 29, 2024
Corrected

Abuse/Neglect moderate citation Info Issues related to protecting resident's from harm, including abuse, neglect, or mistreatment. Oct 29, 2024
Corrected

Pharmacy moderate citation Info Issues related to medication management, including how drugs are stored, administered, and monitored. Oct 29, 2024
Corrected

Compare Nursing Homes around Cleveland The information below is reported by the Ohio Department of Health, Bureau of Survey and Certification.

5 facilities compared · CMS & OH Dept. of Health data · Updated Apr 2026

Filter by care type
Algart Health Care
AL

Assisted Living A licensed, long-term care setting for seniors or individuals with disabilities who need help with daily activities — like bathing, dressing, and medication management — but not 24-hour skilled nursing. Offers housing, meals, and around-the-clock support while aiming to maximize resident independence.

NH

Nursing Home Licensed facility providing 24/7 skilled nursing care for residents with complex, ongoing medical needs. Staffed by RNs, LPNs, and CNAs. Inspected and star-rated annually by CMS. Accepts Medicare (short-term rehab) and Medicaid (long-term care).

Cleveland (Edgewater)
72
94.3%
+20%
4.17
-48%
+18%
0
11
5.5
0
69
-
62
Ireland, Garth
$8.3M
$2.7M
31.9%
366308
O’neill Healthcare Lakewood
NH

Nursing Home Licensed facility providing 24/7 skilled nursing care for residents with complex, ongoing medical needs. Staffed by RNs, LPNs, and CNAs. Inspected and star-rated annually by CMS. Accepts Medicare (short-term rehab) and Medicaid (long-term care).

AL

Assisted Living A licensed, long-term care setting for seniors or individuals with disabilities who need help with daily activities — like bathing, dressing, and medication management — but not 24-hour skilled nursing. Offers housing, meals, and around-the-clock support while aiming to maximize resident independence.

Cleveland
228
85.2%
+8%
3.23
-40%
-9%
0
24
2.4
0
92
-
-
Chuma, Kimberly
$14.8M
$6.2M
42%
365267
Crawford Manor Health Care Center
NH

Nursing Home Licensed facility providing 24/7 skilled nursing care for residents with complex, ongoing medical needs. Staffed by RNs, LPNs, and CNAs. Inspected and star-rated annually by CMS. Accepts Medicare (short-term rehab) and Medicaid (long-term care).

AL

Assisted Living A licensed, long-term care setting for seniors or individuals with disabilities who need help with daily activities — like bathing, dressing, and medication management — but not 24-hour skilled nursing. Offers housing, meals, and around-the-clock support while aiming to maximize resident independence.

Cleveland (Hough)
50
76.1%
-3%
3.72
-23%
+5%
2
45
5.6
2
33
D-
70
Hall, Gregory
$4.2M
$2.1M
50.8%
366110
CityView Healthcare & Rehabilitation
NH

Nursing Home Licensed facility providing 24/7 skilled nursing care for residents with complex, ongoing medical needs. Staffed by RNs, LPNs, and CNAs. Inspected and star-rated annually by CMS. Accepts Medicare (short-term rehab) and Medicaid (long-term care).

AL

Assisted Living A licensed, long-term care setting for seniors or individuals with disabilities who need help with daily activities — like bathing, dressing, and medication management — but not 24-hour skilled nursing. Offers housing, meals, and around-the-clock support while aiming to maximize resident independence.

Cleveland (Central)
146
70.0%
-11%
2.91
-38%
-18%
4
47
3.6
5
94
-
60
-
$13.3M
$5.2M
39%
365879
Harvard Gardens Rehabilitation and Care Center
AL

Assisted Living A licensed, long-term care setting for seniors or individuals with disabilities who need help with daily activities — like bathing, dressing, and medication management — but not 24-hour skilled nursing. Offers housing, meals, and around-the-clock support while aiming to maximize resident independence.

IL

Independent Living Lifestyle-focused communities for older adults offering dining, activities, and transportation with minimal personal care. Best for active, independent seniors who want community without medical support.

MC

Memory Care Secured, specialized care for people living with Alzheimer's or dementia. Staff trained in cognitive impairment, with higher staff-to-resident ratios and an environment designed to reduce confusion and wandering risk.

NH

Nursing Home Licensed facility providing 24/7 skilled nursing care for residents with complex, ongoing medical needs. Staffed by RNs, LPNs, and CNAs. Inspected and star-rated annually by CMS. Accepts Medicare (short-term rehab) and Medicaid (long-term care).

Cleveland (Lee - Miles)
130
62.8%
-20%
3.77
-28%
+6%
6
58
5.8
3
89
-
34
Hgrcc Holdings Llc
$9.7M
$4.4M
44.9%
365828

Places of interest near Crawford Manor Health Care Center

Address 3.4 miles from city center — 0.43 miles to nearest hospital (Cleveland Clinic Pediatrics)

Calculate Travel Distance to Crawford Manor Health Care Center

Add your location

Address

Staffing Data (Q2 2025)

This data corresponds to Q2 2025 and is based on CMS Payroll-Based Journal.

Total staff 70
Employees 45
Contractors 25
Staff to resident ratio 1.79:1
16% worse than Ohio average

Ohio average ratio: 2.14:1

Avg staff/day 21
Average shift 6.7 hours
17% worse than Ohio average

Ohio average: 8.1 hours

Total staff hours (quarter) 12,727
Nursing staff breakdown
Registered Nurse

Manages medical care and health needs.

Total count 5
Average shift length Info Average shift length. Calculated as total hours divided by days worked and average staff per day. 8.9 hours

This role is partially covered by contractors.

Licensed Practical Nurse

Assists with medical care and medications.

Total count 10
Average shift length Info Average shift length. Calculated as total hours divided by days worked and average staff per day. 9.1 hours

No contractors work on this role.

Certified Nursing Assistant

Helps with daily care and mobility.

Total count 17
Average shift length Info Average shift length. Calculated as total hours divided by days worked and average staff per day. 7 hours

This role is partially covered by contractors.

Contractor staffing

Total hours from contractors

14%

1,780 contractor hours this quarter

Occupational Therapy Assistant: 6 Registered Nurse: 3 Clinical Nurse Specialist: 3 Physical Therapy Aide: 2 Respiratory Therapy Technician: 2 Qualified Social Worker: 2 Speech Language Pathologist: 2 Physical Therapy Assistant: 2 Certified Nursing Assistant: 1 Medical Director: 1 Occupational Therapy Aide: 1
Staff by category
Certified Nursing Assistant161175,75891100%7
Licensed Practical Nurse100102,59491100%9.1
Registered Nurse2358677380%8.9
RN Director of Nursing5056996875%8.5
Dietitian2024085560%7.3
Administrator2023924954%8
Clinical Nurse Specialist1343794549%7.7
Other Dietary Services Staff2022784448%5.9
Physical Therapy Aide0222775965%3.2
Mental Health Service Worker1012553538%7.3
Nurse Practitioner1011922426%8
Speech Language Pathologist0221825055%3.6
Physical Therapy Assistant0221295257%2.5
Respiratory Therapy Technician0221275257%2.4
Qualified Social Worker022854347%1.9
Occupational Therapy Aide112661516%4.4
Medical Director011181314%1.4
Occupational Therapy Assistant066141820%0.7
Nurse Aide in Training202922%4.5
17 Certified Nursing Assistant
% of Days 100%
10 Licensed Practical Nurse
% of Days 100%
5 Registered Nurse
% of Days 80%
5 RN Director of Nursing
% of Days 75%
2 Dietitian
% of Days 60%
2 Administrator
% of Days 54%
4 Clinical Nurse Specialist
% of Days 49%
2 Other Dietary Services Staff
% of Days 48%
2 Physical Therapy Aide
% of Days 65%
1 Mental Health Service Worker
% of Days 38%
1 Nurse Practitioner
% of Days 26%
2 Speech Language Pathologist
% of Days 55%
2 Physical Therapy Assistant
% of Days 57%
2 Respiratory Therapy Technician
% of Days 57%
2 Qualified Social Worker
% of Days 47%
2 Occupational Therapy Aide
% of Days 16%
1 Medical Director
% of Days 14%
6 Occupational Therapy Assistant
% of Days 20%
2 Nurse Aide in Training
% of Days 2%

Facility Characteristics

Source: CMS Long-Term Care Facility Characteristics (Data as of Jan 2026)

Total census
39 residents
Residents by payment source
Medicare
3 residents (7.7%)
Medicaid
36 residents (92.3%)
Programs & Services
Residents' Group

Residents meet regularly to discuss policies, care quality, and activities

Active Resident Council

Organized group of residents that meets regularly to discuss facility policies, quality of life, and activities.

Quality of care over time

These measures show how residents usually do over time at this home, based on health outcomes and preventive care.

High-risk clinical events score Info A composite score based on pressure ulcers, falls with injury, weight loss, walking ability decline, and activities of daily living decline. 5.7
In line with Ohio average

Ohio average: 5.8

Functional decline score Info A composite score based on activities of daily living decline, walking ability decline, and incontinence. 7.4
42% better than Ohio average

Ohio average: 12.7

Long-stay resident measures
Significantly above average Ohio avg: 4.8 Info CMS star rating based on long-stay quality measure performance. 5 stars = significantly above average, 1 star = significantly below average.
Need for Help with Daily Activities Increased Info Percent of long-stay residents whose need for help with daily activities has increased 3.8%
44% better than Ohio average

Ohio average: 6.8%

Walking Ability Worsened Info Percent of long-stay residents whose ability to move independently worsened 9.8%
10% worse than Ohio average

Ohio average: 8.9%

Low Risk Residents with Bowel/Bladder Incontinence Info Percent of low risk long-stay residents who lose control of their bowels or bladder 8.5%
61% better than Ohio average

Ohio average: 22.0%

Falls with Major Injury Info Percent of long-stay residents experiencing one or more falls with major injury 0.0%
100% better than Ohio average

Ohio average: 3.4%

High Risk Residents with Pressure Ulcers Info Percent of long-stay high risk residents with pressure ulcers 5.1%
32% worse than Ohio average

Ohio average: 3.9%

Urinary Tract Infection Info Percent of long-stay residents with a urinary tract infection 1.5%
182% worse than Ohio average

Ohio average: 0.5%

Lost Too Much Weight Info Percent of long-stay residents who lose too much weight 10.0%
61% worse than Ohio average

Ohio average: 6.2%

Depressive Symptoms Info Percent of long-stay residents who have depressive symptoms 20.7%
14% better than Ohio average

Ohio average: 24.0%

Antipsychotic Use Info Percent of long-stay residents who received an antipsychotic medication 0.9%
90% better than Ohio average

Ohio average: 8.4%

Pneumococcal Vaccine Info Percent of long-stay residents assessed and appropriately given the pneumococcal vaccine 98.5%
7% better than Ohio average

Ohio average: 92.4%

Influenza Vaccine Info Percent of long-stay residents assessed and appropriately given the seasonal influenza vaccine 97.1%
In line with Ohio average

Ohio average: 94.5%

Short-stay resident measures
Pneumococcal Vaccine Info Percent of short-stay residents assessed and appropriately given the pneumococcal vaccine 85.6%
10% better than Ohio average

Ohio average: 78.0%

Antipsychotic medication increase Info Percent of short-stay residents who newly received an antipsychotic medication 0.0%
100% better than Ohio average

Ohio average: 1.3%

Influenza Vaccine Info Percent of short-stay residents assessed and appropriately given the seasonal influenza vaccine 80.7%
7% better than Ohio average

Ohio average: 75.6%

Penalties and fines

Federal penalties imposed by CMS for regulatory violations, including civil money penalties (fines) and denials of payment for new Medicare/Medicaid admissions.

Source: CMS Penalties Database (Data as of Jan 2026)

Total fines amount $25K
63% lower than Ohio average

Ohio average: $69K

Number of fines 2
8% more fines than Ohio average

Ohio average: 1.9

Payment Denials Info Serious action where Medicare and/or Medicaid temporarily stops payments for new residents until issues are fixed. 0
100% fewer payment denials than Ohio average

Ohio average: 0.5

Fines amount comparison
This facility $25K
Ohio average $69K
Penalty History

Penalties are imposed by CMS for violations of federal nursing home regulations.

Civil Money Penalty Info Fines imposed for noncompliance, which can be assessed per day or per instance of violation. Dec 20, 2024
$11K
Civil Money Penalty Info Fines imposed for noncompliance, which can be assessed per day or per instance of violation. Sep 25, 2023
$15K

Last updated: Jan 2026

Guides for Better Senior Living

Care Cost Calculator: See Prices in Your Area

Nursing Home Data Explorer

Don’t Wait Too Long: 7 Red Flag Signs Your Parent Needs Assisted Living Now

The True Cost of Assisted Living in 2025 – And How Families Are Paying For It

Understanding Senior Living Costs: Pricing Models, Discounts & Financial Assistance

Financial Aid for Ohio Seniors

Get financial aid guidance

PASSPORT Waiver

Ohio Medicaid PASSPORT

Age 60+, Ohio resident, Medicaid-eligible, nursing home-level care need.

~$2,829/month (300% FBR, individual).

$2,000 (individual), $3,000 (couple).

Administered through regional agencies; waitlists possible.

Ohio Home Care Program (non-Medicaid)

OH HCP

Age 60+, Ohio resident, at risk of decline.

~$2,000/month (individual, varies).

$5,000 (individual).

Limited funding; regional variation.

Assisted Living Waiver (ALW)

Ohio Assisted Living Waiver

Age 21+ (65+ prioritized), OH resident, Medicaid-eligible, NFLOC.

~$2,829/month (individual); QIT required.

$2,000 (individual), $3,000 (couple).

Covers ~300 facilities; room/board not included (separate cost).

Program of All-Inclusive Care for the Elderly (PACE)

Ohio PACE (e.g., McGregor PACE)

Age 55+, OH resident (specific counties), NFLOC, safe with PACE support.

~$2,829/month (Medicaid-eligible); private pay option available.

$2,000 (individual), $3,000 (couple) for Medicaid enrollees.

Available in 9 counties (e.g., Cuyahoga, Franklin); expanding via Healthy Aging Grants.

Medicare Savings Program (MSP)

Ohio Medicare Savings Program

Age 65+ or disabled, OH resident, Medicare Part A/B.

~$2,510/month (QMB), ~$3,380/month (SLMB), ~$3,598/month (QI)—individual.

$9,430 (individual), $14,130 (couple).

Three tiers; includes Extra Help for Part D; no waitlist.

Home Energy Assistance Program (HEAP)

Ohio HEAP

Age 60+ prioritized, OH resident, low-income household.

~$3,970/month (individual, 185% FPL).

Not assessed; income-focused.

Covers gas, electric, oil; emergency aid via Winter/Summer Crisis Programs.

Family Caregiver Support Program (FCSP)

Ohio Family Caregiver Support Program

Caregivers of 60+ needing care or 55+ caregivers of others; OH resident; functional needs (2+ ADLs).

Prioritizes ~$24,980/year (individual); no strict cap.

Not assessed; need-based.

12 AAAs; rural/low-income priority; volunteer respite option.

Senior Community Service Employment Program (SCSEP)

Ohio SCSEP

Age 55+, unemployed, low-income, OH resident.

~$1,983/month (125% FPL).

Not specified; income-focused.

Priority for veterans, rural residents; AARP partnership.

VA Aid and Attendance (A&A) and Housebound Benefits

Ohio VA Aid and Attendance/Housebound

Age 65+ or disabled veteran/spouse, OH resident, wartime service, need for ADL help (A&A) or homebound.

Net income < ~$1,984/month (veteran with dependent, A&A); pension offsets income.

~$155,356 (net worth limit).

High veteran demand; supports care in multiple settings.

Homestead Exemption

Ohio Homestead Exemption

Age 65+ (or disabled), OH resident, homeowner, low-income.

~$38,500/year (individual, adjusted annually).

Not assessed; home ownership required.

Reduces taxable value by $25,000; applies to primary residence.

Save the Dream Ohio (Homeowner Assistance Fund)

Ohio Save the Dream

Age 60+ prioritized, OH resident, homeowner, hardship post-Jan 21, 2020.

~$147,600/year (family of 4, 150% AMI; varies by county).

Not assessed; hardship-focused.

Covers delinquent mortgages, utilities, taxes; max $25,000 mortgage aid.