Explore Open Rooms

1 Contact details
2 What type of senior care service are you looking for?
3 What budget do you have in mind for senior care?
4 How soon do you need to find care?
5 Additional details

Thank you for your interest!

Our team will be in touch shortly to help with next steps.

Assisted Living Home

Creekside Village

Assisted Living Home

Creekside Village

1183 Luther Dr, Hagerstown, MD 21740 View map
Overview of Creekside Village

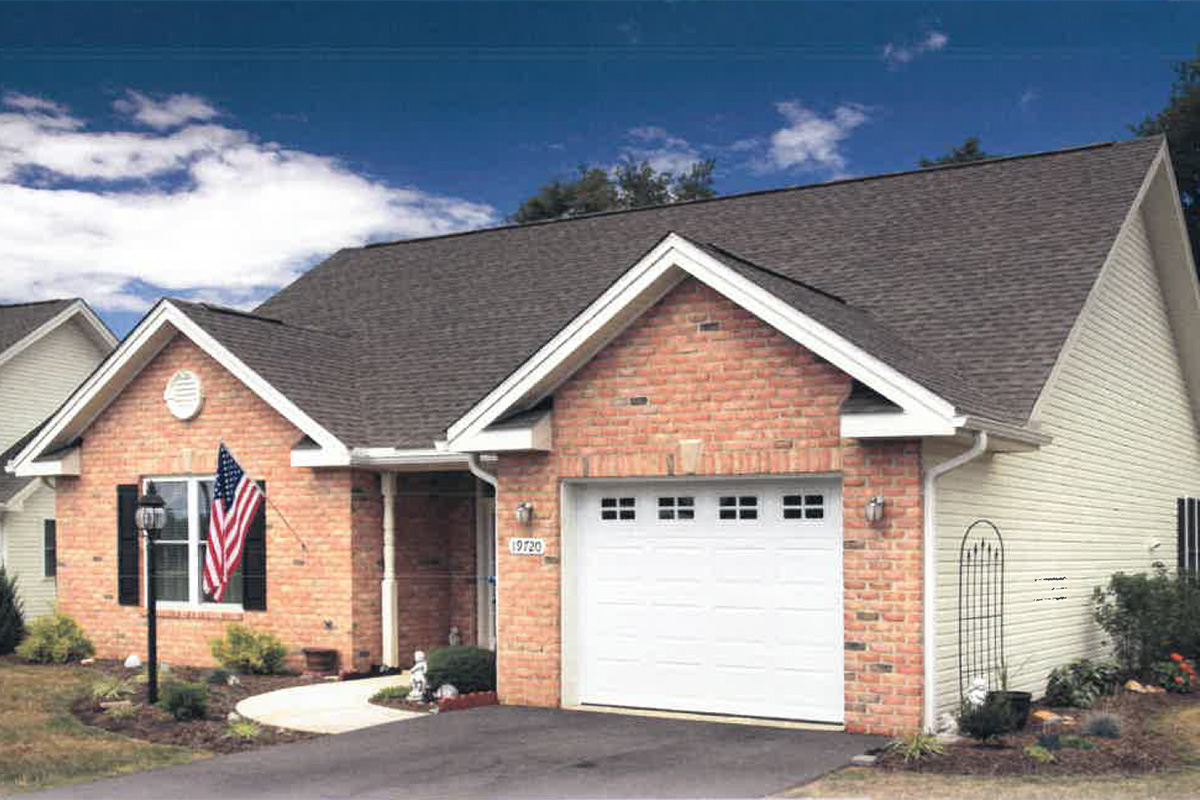
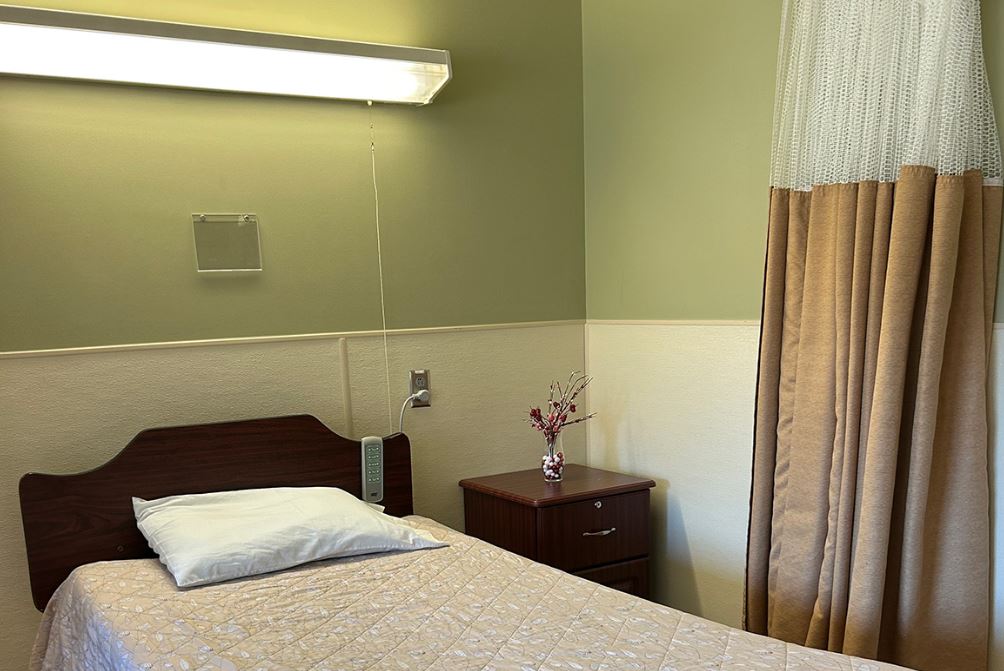
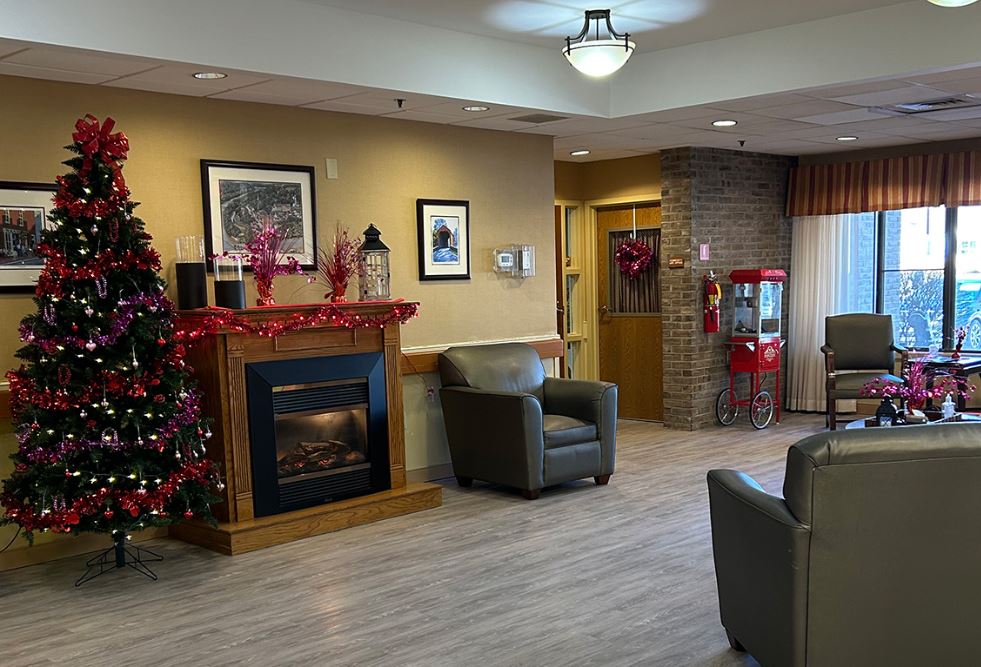
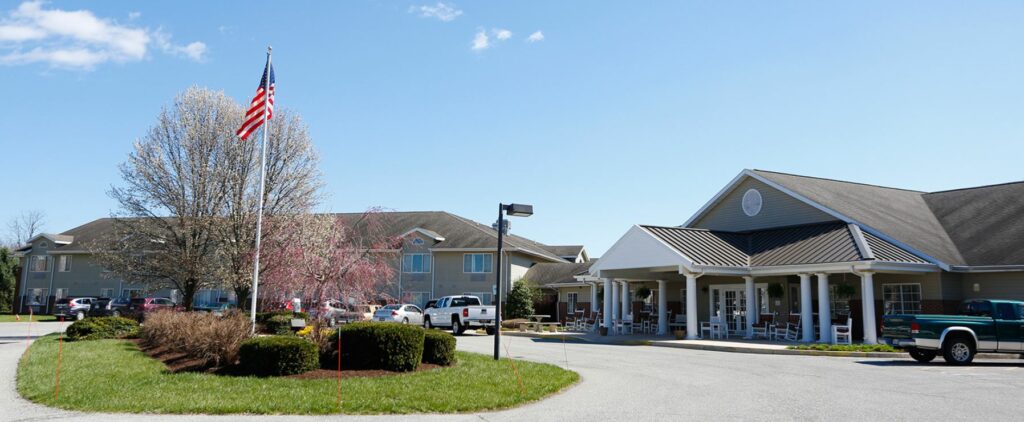
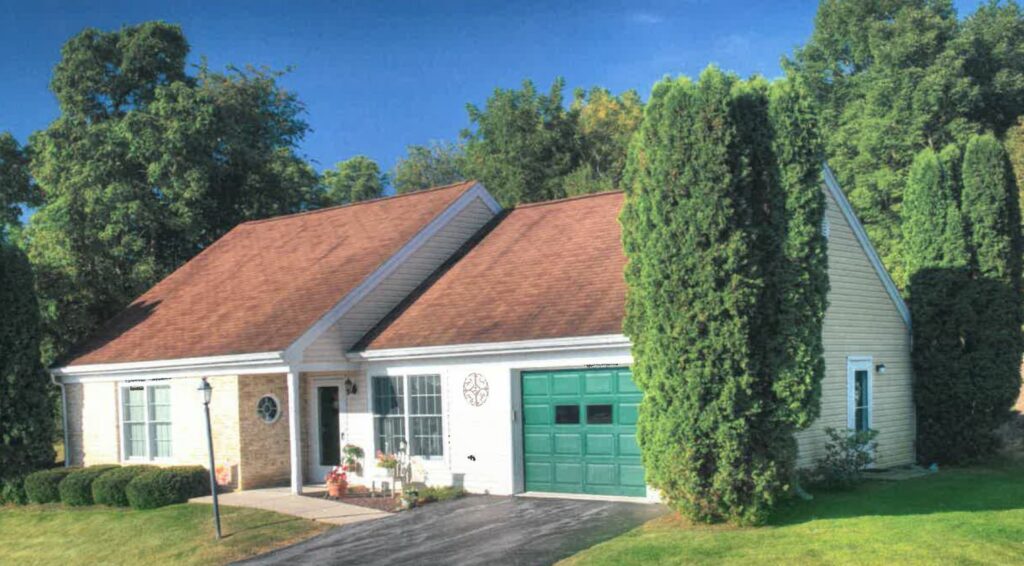
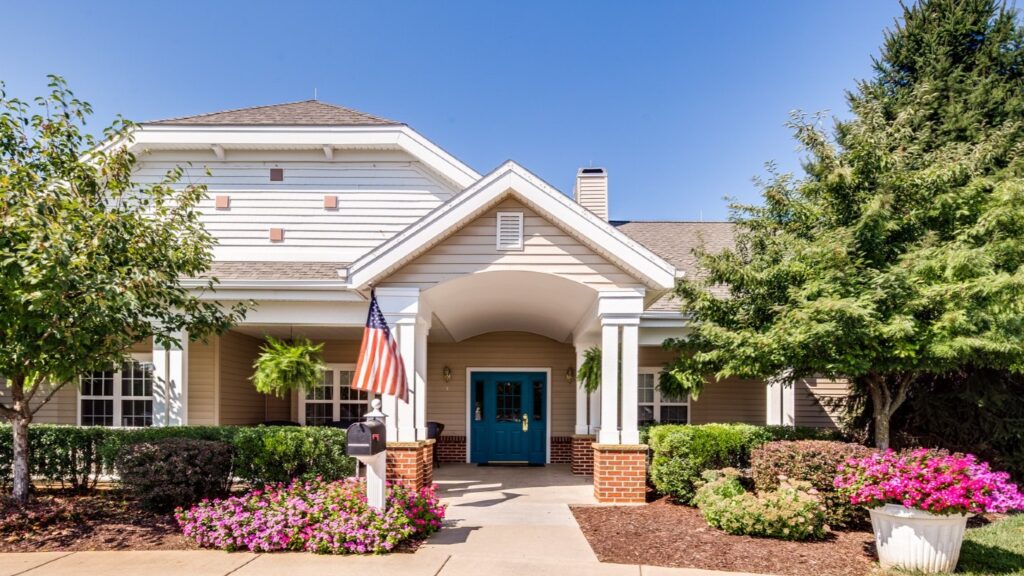
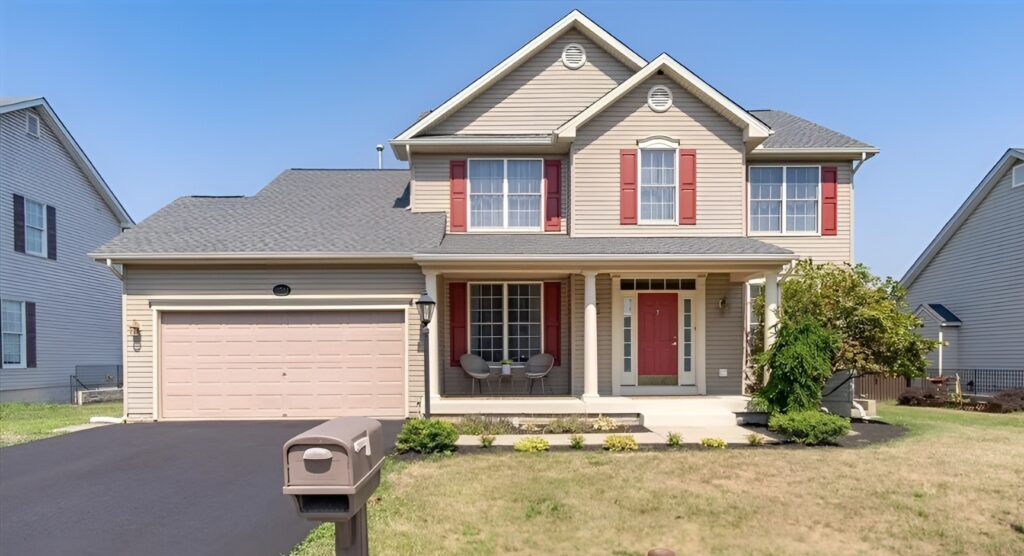
Dedicated to enhancing seniors’ well-being, Creekside Village is a blissful senior living set in the quiet Luther Drive, Hagerstown, MD, that features various living options including assisted living, independent living, memory care, rehabilitation, and skilled nursing. Placed conveniently near incredible establishments and attractions, the community ensures seniors’ needs and desires are easily accessible. With a reliable and highly trained team delivering the highest standard of care and support, residents optimize their freedom and live a life well lived.

Interact with friends and participate in enjoyable activities and exciting events to maintain an active and well-engaged lifestyle. Considering residents’ tastes and dietary needs, the community meticulously prepares delectable meal options for the finest dining experience. Creekside Village is a good place for seniors looking to experience meaningful things in their golden years with its welcoming environment and picturesque landscapes.

(971) 320-7157

Quality ratings

Measured by Centers for Medicare & Medicaid Services (CMS)

Overall rating Info The Overall CMS Rating combines results from health inspections, staffing levels and quality measures. Health inspections carry the most weight. Staffing and quality scores can increase or decrease the final rating based on performance compared to state and national standards.
1/5
Maryland average: 3.0/5
Health Inspection Info Based on the results of the facility's three most recent standard inspections and any complaint investigations. CMS reviews the number, scope, and severity of deficiencies, with more recent findings weighted more heavily.
1/5
Maryland average: 2.8/5
Staffing Info Measures average nursing staff hours per resident per day, including Registered Nurses (RNs) and total nursing staff. Ratings are adjusted based on the level of care residents require and are compared to state and national benchmarks.
1/5
Maryland average: 3.0/5
Quality Measures Info Based on clinical and physical health indicators reported to CMS, such as hospital readmissions, falls, pressure ulcers, and improvements in mobility. These measures reflect how well residents' health needs are being managed.
2/5
Maryland average: 3.7/5

Nursing care per resident

Info This shows how many total hours of nursing staff time are available per resident each day. Higher numbers usually mean more staff support.
2h 55m per day

This home provides 23% less nursing time per resident than the Maryland average.

Maryland average: 3h 46m per day

Staffing hours breakdown

Info Hours of care per resident per day, broken down by staff type. Data from CMS Medicare.
Staff type Facility State avg National avg
Registered Nurse (RN) Info Registered nurse hours per resident per day. 42m per day 50m per day 41m per day
Nurse Aide Info Nurse aide hours per resident per day. 1h 54m per day 2h 10m per day 2h 21m per day
Total Nursing (Weekend) Info Total number of nurse staff hours per resident per day on weekends. 3h 5m per day 3h 29m per day 3h 26m per day
Physical Therapist Info Physical therapist staff hours per resident per day. 3m per day 5m per day 4m per day
RN (Weekend) Info Registered nurse hours per resident per day on weekends. 33m per day 37m per day 29m per day

Capacity and availability

Smaller home

May offer a more intimate, personalized care environment.

Total beds 80

This home usually has limited availability

Occupancy is moderate, suggesting balanced demand.

Similar demand to the Maryland average
Occupancy rate 85%
Residents per day (avg) 76
Occupancy rate
85%
Residents per day (avg)
76

Who this home usually serves

TYPE OF STAY

Mostly short-term rehab stays

Most residents typically stay for a few weeks or months before returning home or moving on.

Might be optimal for
Short stays Recovery Medicare-covered care

Breakdown by payment type

Medicare

89% of new residents, usually for short-term rehab.

Typical stay 22 days

Private pay

4% of new residents, often for short stays.

Typical stay 1 years

Medicaid

7% of new residents, often for long-term daily care.

Typical stay 1 - 2 years

Finances and operations

Privately-owned community
Operated by a partnership between two or more business owners.
Home revenue
$11.4M
Profit
$617.0K
Privately-owned community Operated by a partnership between two or more business owners.
Home revenue
$11,400,953.00
Profit
$616,997.00
Payroll costs Info The portion of the home's budget spent on staff, including nurses, caregivers, and other employees who support care and operations.
$2.7M
23.3% of revenue
Other operating costs Info All remaining costs needed to run the home, such as food, utilities, building maintenance, supplies and administrative expenses.
$8.1M
Total costs $10.8M
Walk Score
Walk Score: 22 / 100
Car-dependent. Most errands require a car, with limited nearby walkable options.

About this community

Care Services

Nursing Services
Rehabilitation Services
Independent Living
Skilled Nursing
Licensed Nurses/CNAs

All Levels of Care

Independent Living
Assisted Living
Skilled Nursing
Rehabilitation

Programs & Activities

Specific Programs
Independent Living, Assisted Living, Skilled Nursing, Rehabilitation, Activities, Dining Services

What does this home offer?

Room sizes icon
Room sizes icon

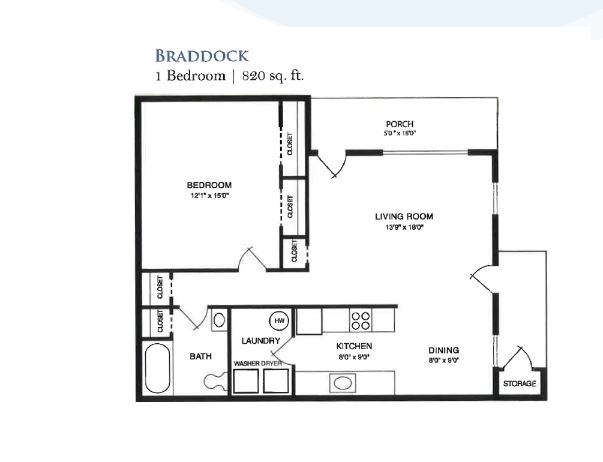
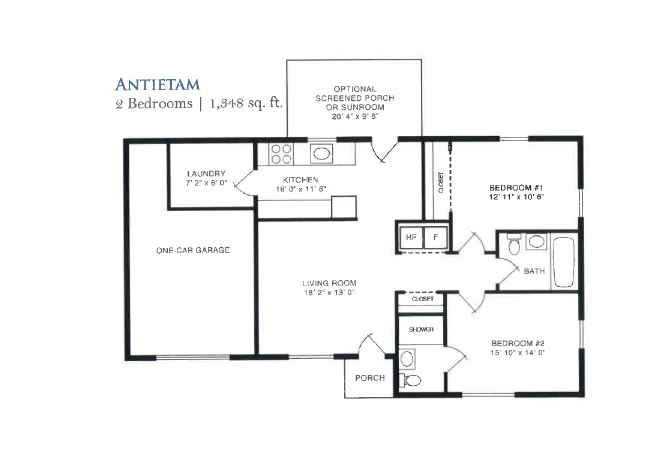
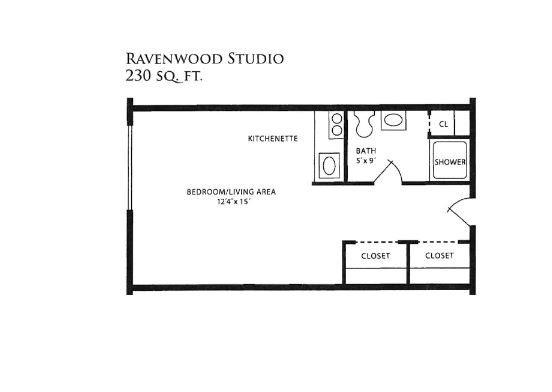
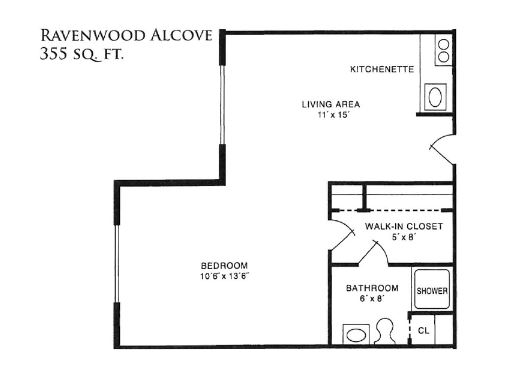
Room Sizes: 230 - 355 / 820 - 1,348 sq. ft

Housing options icon

Housing Options: Studio / Alcove / 1 Bed / 2 Bed

Building type icon
Building type icon

Building Type: Single-story

Transportation services icon

Transportation Services

Fitness and recreation icon

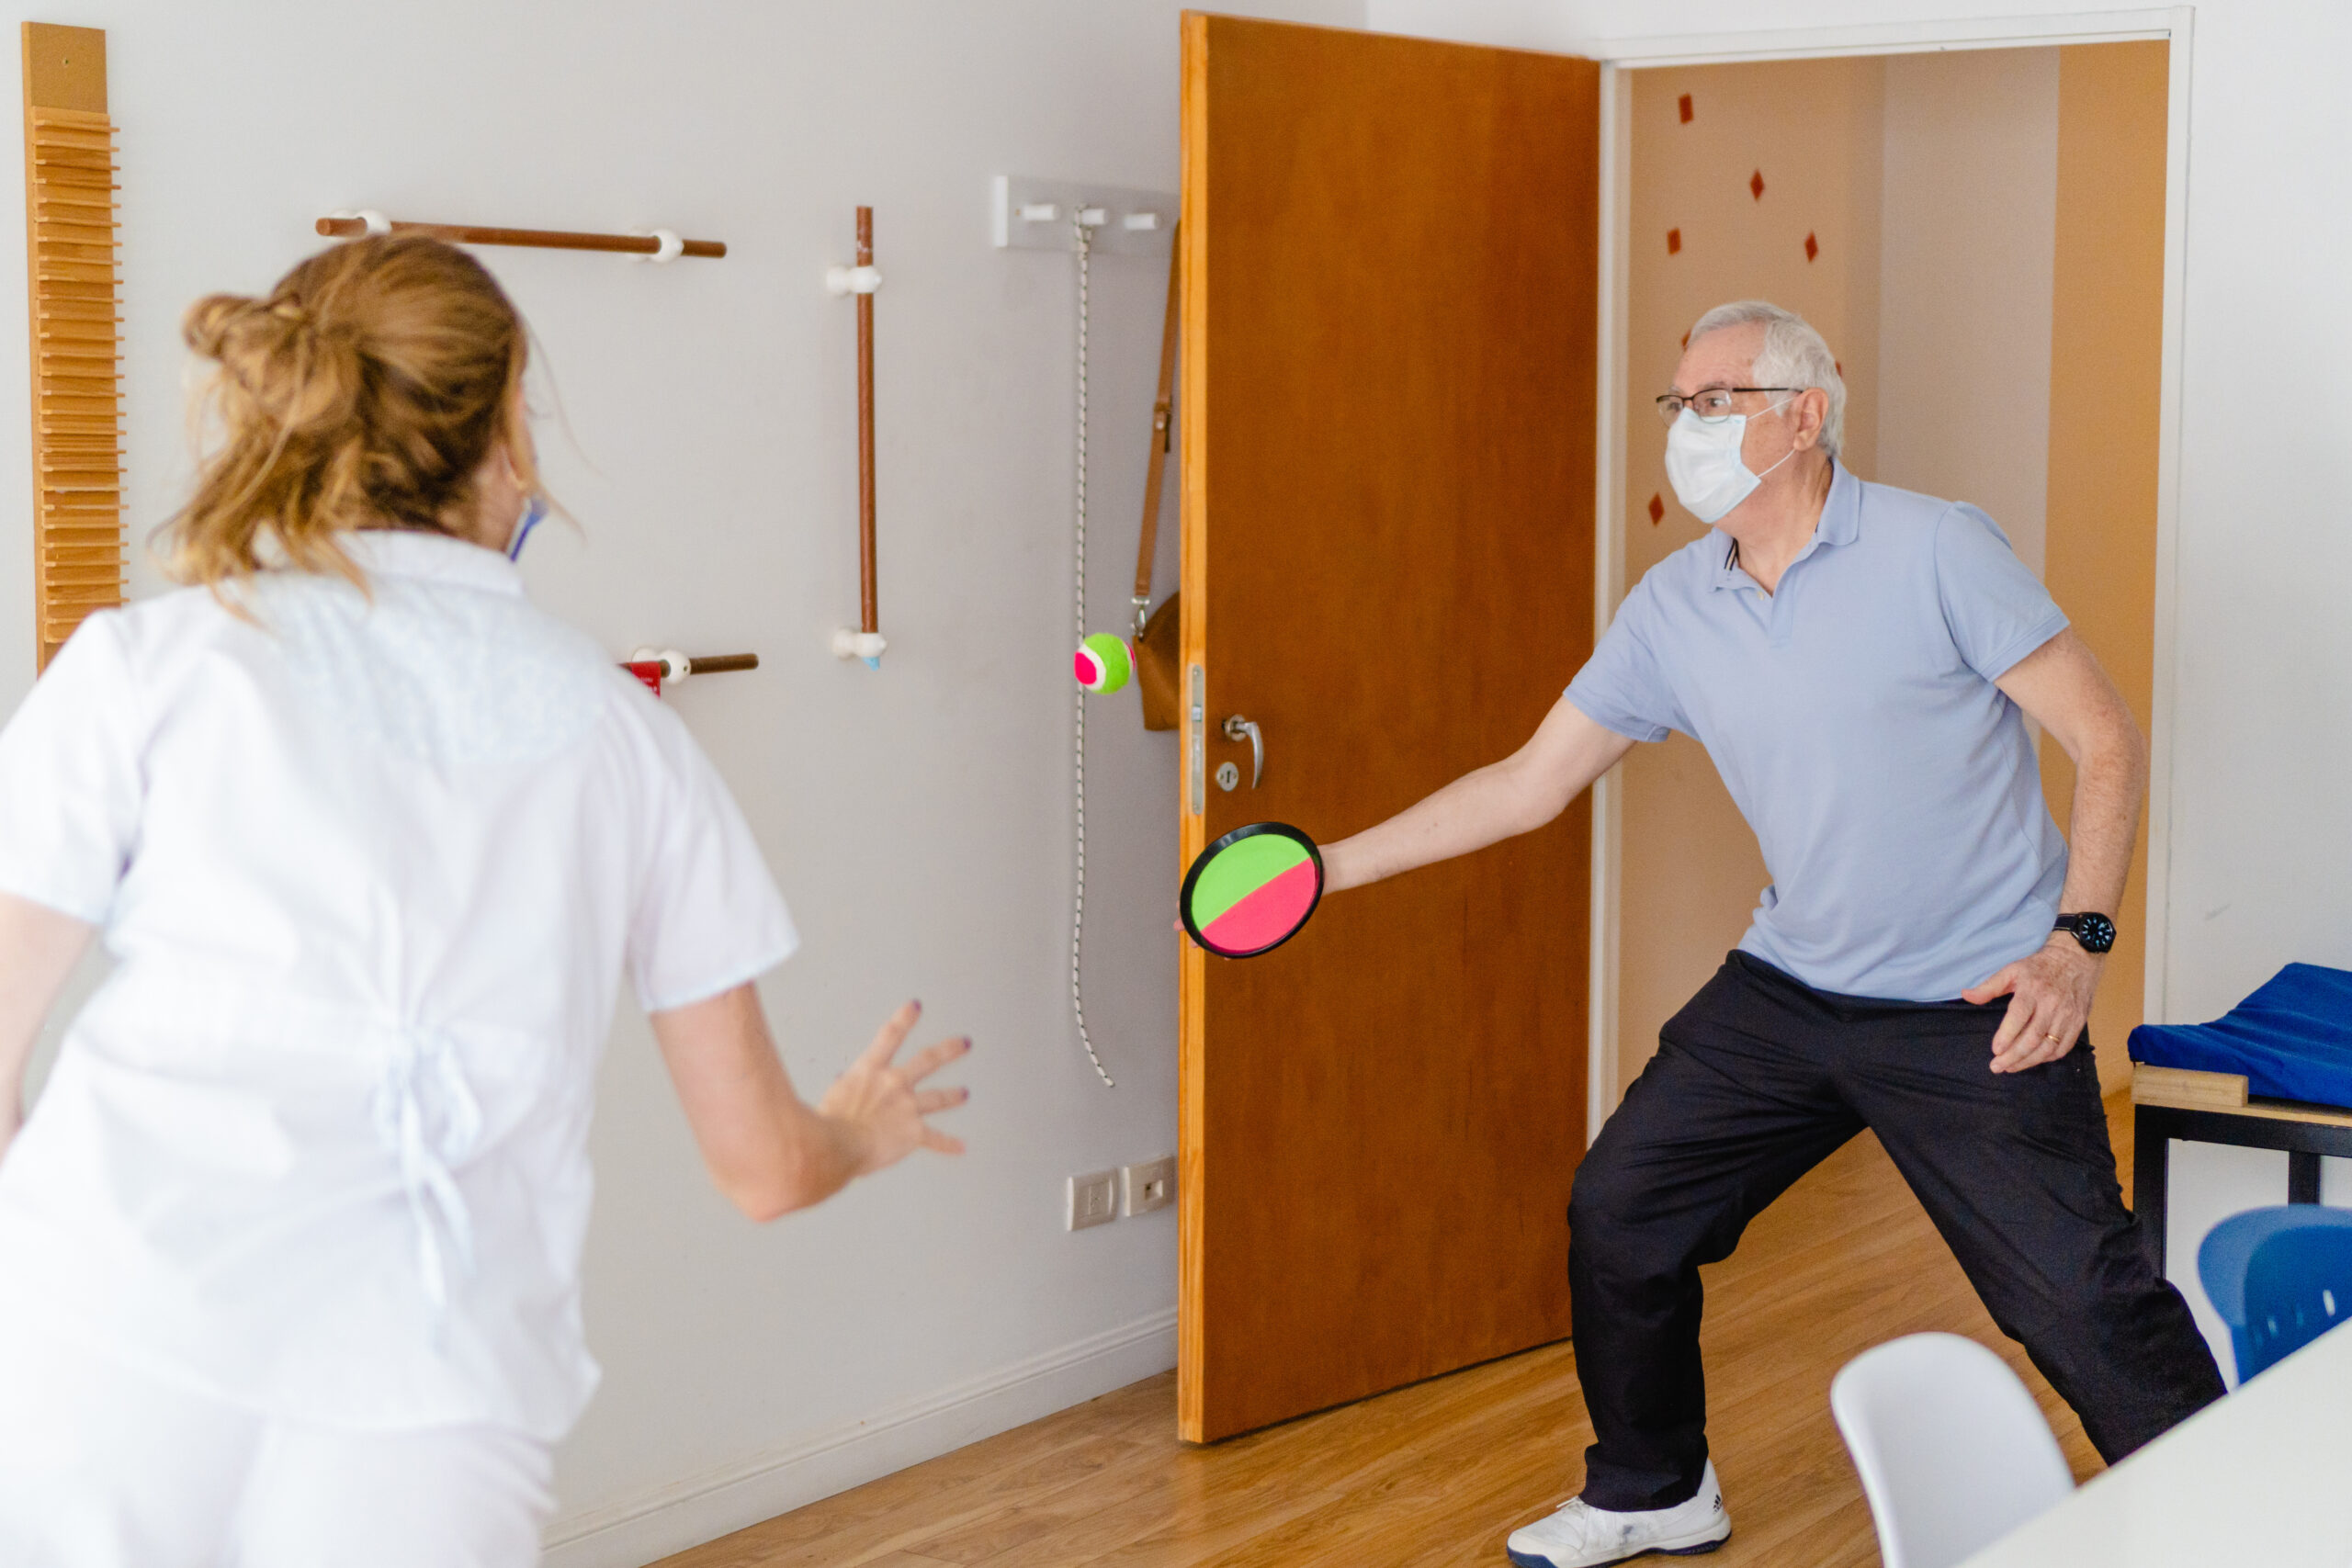
Fitness and Recreation

Types of Care at Creekside Village

Assisted Living Independent Living Memory Care Nursing Home

Health Inspection History

Inspections
Total health inspections 5

Maryland average 3.9


Last Health inspection on Oct 2025

Total health citations 109

Maryland average 49.9

Citations per inspection
21.8

Maryland average 12.81


Health citations are formal notices following inspections when they fail to comply with safety and care standards.

84 of 109 citations resulted from standard inspections; 18 of 109 resulted from complaint investigations; and 7 of 109 came from combined inspections (standard and complaint).

Breakdown of citation severity (last 3 years)
Critical Health citations More info 3
500% worse than Maryland average

Maryland average: 0.5


Serious Health citations More info 2
233% worse than Maryland average

Maryland average: 0.6

3 critical citations More info Maryland average: 0.5

2 serious citations More info Maryland average: 0.6

101 moderate citations More info Maryland average: 47.2

3 minor citations More info Maryland average: 1.7
Citations history (last 3 years)
Abuse/Neglect moderate citation Info Issues related to protecting resident's from harm, including abuse, neglect, or mistreatment. Oct 17, 2025
Corrected

Abuse/Neglect moderate citation Info Issues related to protecting resident's from harm, including abuse, neglect, or mistreatment. Oct 17, 2025
Corrected

Quality of Care serious citation Info Issues related to how well residents receive appropriate treatment and support for their medical and daily care needs. Oct 17, 2025
Corrected

Infection Control moderate citation Info Issues related to preventing and controlling infections, including hygiene practices and safety protocols. Feb 21, 2025
Corrected

Compare Assisted Living around Hagerstown The information below is reported by the Maryland Department of Health, Office of Health Care Quality.

Brookdale Hagerstown
AL

Assisted Living A licensed, long-term care setting for seniors or individuals with disabilities who need help with daily activities — like bathing, dressing, and medication management — but not 24-hour skilled nursing. Offers housing, meals, and around-the-clock support while aiming to maximize resident independence.

MC

Memory Care Secured, specialized care for people living with Alzheimer's or dementia. Staff trained in cognitive impairment, with higher staff-to-resident ratios and an environment designed to reduce confusion and wandering risk.

Hagerstown
110
Yes
-
30
Studio / Alcove / 1 Bed / 2 Bed
Creekside Village
AL

Assisted Living A licensed, long-term care setting for seniors or individuals with disabilities who need help with daily activities — like bathing, dressing, and medication management — but not 24-hour skilled nursing. Offers housing, meals, and around-the-clock support while aiming to maximize resident independence.

IL

Independent Living Lifestyle-focused communities for older adults offering dining, activities, and transportation with minimal personal care. Best for active, independent seniors who want community without medical support.

MC

Memory Care Secured, specialized care for people living with Alzheimer's or dementia. Staff trained in cognitive impairment, with higher staff-to-resident ratios and an environment designed to reduce confusion and wandering risk.

NH

Nursing Home Licensed facility providing 24/7 skilled nursing care for residents with complex, ongoing medical needs. Staffed by RNs, LPNs, and CNAs. Inspected and star-rated annually by CMS. Accepts Medicare (short-term rehab) and Medicaid (long-term care).

Hagerstown
80
No
-
22
Studio / Alcove / 1 Bed / 2 Bed
Somerford House & Place Hagerstown
AL

Assisted Living A licensed, long-term care setting for seniors or individuals with disabilities who need help with daily activities — like bathing, dressing, and medication management — but not 24-hour skilled nursing. Offers housing, meals, and around-the-clock support while aiming to maximize resident independence.

MC

Memory Care Secured, specialized care for people living with Alzheimer's or dementia. Staff trained in cognitive impairment, with higher staff-to-resident ratios and an environment designed to reduce confusion and wandering risk.

RC

Respite Care Short-term temporary care — days to weeks — to give family caregivers a break. Full care provided during the stay. Often used after hospitalization or to trial a facility before a permanent placement decision.

Hagerstown
55
Yes
A+
29
Studio / 1 Bed
Essex Drive Senior Living
AL

Assisted Living A licensed, long-term care setting for seniors or individuals with disabilities who need help with daily activities — like bathing, dressing, and medication management — but not 24-hour skilled nursing. Offers housing, meals, and around-the-clock support while aiming to maximize resident independence.

Hagerstown
-
No
-
-
Studio / Alcove / 1 Bed / 2 Bed
Elisabeth’s House
AL

Assisted Living A licensed, long-term care setting for seniors or individuals with disabilities who need help with daily activities — like bathing, dressing, and medication management — but not 24-hour skilled nursing. Offers housing, meals, and around-the-clock support while aiming to maximize resident independence.

Hagerstown
-
No
-
-
Studio / Alcove / 1 Bed / 2 Bed

Living Spaces & Floor Plans

Creekside Village P4
Creekside Village P3
Creekside Village P2
Creekside Village P1

Places of interest near Creekside Village

Address 2.2 miles from city center
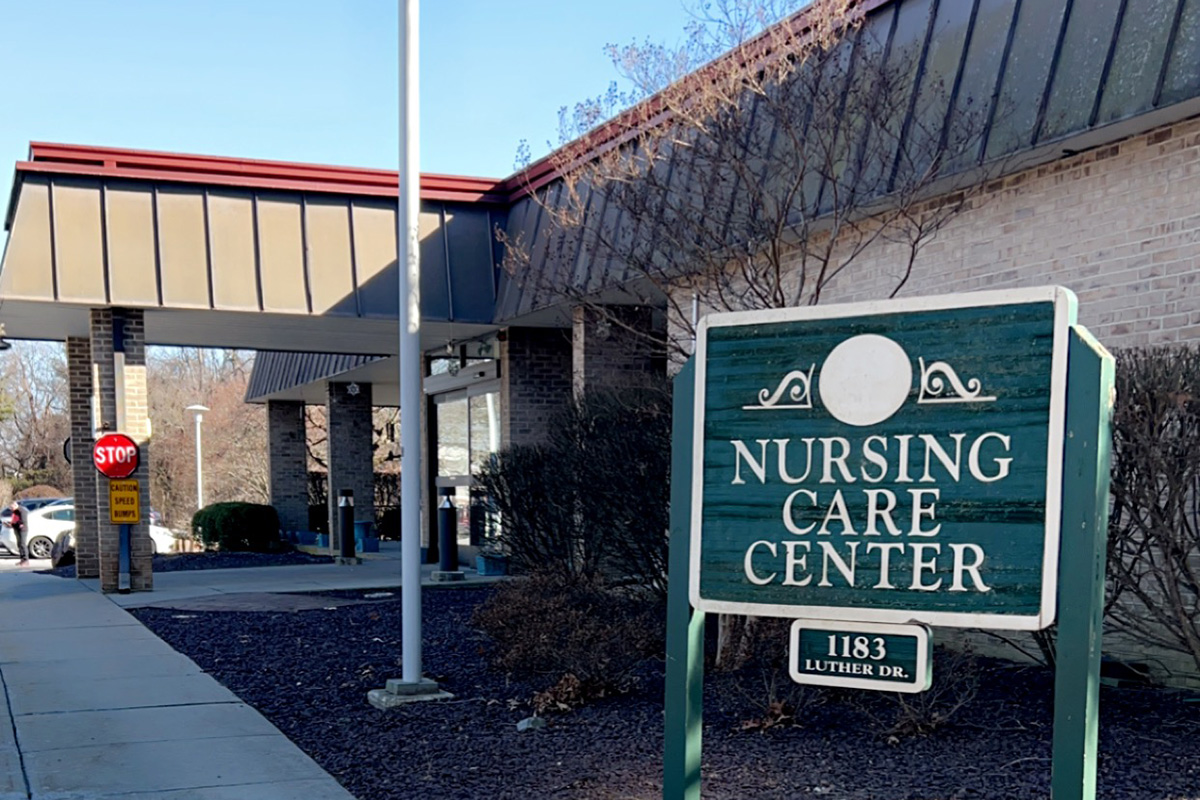
Address 1183 Luther Dr, Hagerstown, MD 21740

Calculate Travel Distance to Creekside Village

Add your location

Address

Staffing Data (Q2 2025)

This data corresponds to Q2 2025 and is based on CMS Payroll-Based Journal.

Total staff 225
Employees 67
Contractors 158
Staff to resident ratio 3.08:1
70% better than Maryland average

Maryland average ratio: 1.81:1

Avg staff/day 39
Average shift 8 hours
0% compared with Maryland average

Maryland average: 8 hours

Total staff hours (quarter) 28,218
Nursing staff breakdown
Registered Nurse

Manages medical care and health needs.

Total count 47
Average shift length Info Average shift length. Calculated as total hours divided by days worked and average staff per day. 7.4 hours

This role is partially covered by contractors.

Licensed Practical Nurse

Assists with medical care and medications.

Total count 38
Average shift length Info Average shift length. Calculated as total hours divided by days worked and average staff per day. 8.6 hours

This role is partially covered by contractors.

Certified Nursing Assistant

Helps with daily care and mobility.

Total count 105
Average shift length Info Average shift length. Calculated as total hours divided by days worked and average staff per day. 8.9 hours

This role is partially covered by contractors.

Contractor staffing

Total hours from contractors

40.6%

11,444 contractor hours this quarter

Certified Nursing Assistant: 92 Registered Nurse: 43 Licensed Practical Nurse: 20 Occupational Therapy Aide: 1 Occupational Therapy Assistant: 1 Medical Director: 1
Staff by category
Certified Nursing Assistant139210512,67391100%8.9
Licensed Practical Nurse1820385,84991100%8.6
Registered Nurse443472,24691100%7.4
Clinical Nurse Specialist6061,3317684%7.1
Therapeutic Recreation Specialist3031,1216875%7
Other Dietary Services Staff4048498593%6.4
Medication Aide/Technician2026455965%10.6
Respiratory Therapist3035476470%5.6
Administrator1014966268%8
Qualified Activities Professional1014966268%8
Dietitian1014886066%8.1
Nurse Practitioner1014846167%7.9
Occupational Therapy Aide0112366066%3.9
Respiratory Therapy Technician1011793943%4.6
Qualified Social Worker1011675156%3.3
Physical Therapy Assistant3031453640%3.8
Mental Health Service Worker2021441820%8
Dental Services Staff3036689%7.3
Occupational Therapy Assistant011291921%1.5
Medical Director01128910%3.1
105 Certified Nursing Assistant
% of Days 100%
38 Licensed Practical Nurse
% of Days 100%
47 Registered Nurse
% of Days 100%
6 Clinical Nurse Specialist
% of Days 84%
3 Therapeutic Recreation Specialist
% of Days 75%
4 Other Dietary Services Staff
% of Days 93%
2 Medication Aide/Technician
% of Days 65%
3 Respiratory Therapist
% of Days 70%
1 Administrator
% of Days 68%
1 Qualified Activities Professional
% of Days 68%
1 Dietitian
% of Days 66%
1 Nurse Practitioner
% of Days 67%
1 Occupational Therapy Aide
% of Days 66%
1 Respiratory Therapy Technician
% of Days 43%
1 Qualified Social Worker
% of Days 56%
3 Physical Therapy Assistant
% of Days 40%
2 Mental Health Service Worker
% of Days 20%
3 Dental Services Staff
% of Days 9%
1 Occupational Therapy Assistant
% of Days 21%
1 Medical Director
% of Days 10%

Facility Characteristics

Source: CMS Long-Term Care Facility Characteristics (Data as of Jan 2026)

Total census
73 residents
Residents by payment source
Medicare
15 residents (20.5%)
Medicaid
31 residents (42.5%)
Private pay or other
27 residents (37%)
Programs & Services
Residents' Group

Residents meet regularly to discuss policies, care quality, and activities

CCRC

Part of a Continuing Care Retirement Community offering multiple care levels

Active Resident Council

Organized group of residents that meets regularly to discuss facility policies, quality of life, and activities.

Quality of care over time

These measures show how residents usually do over time at this home, based on health outcomes and preventive care.

High-risk clinical events score Info A composite score based on pressure ulcers, falls with injury, weight loss, walking ability decline, and activities of daily living decline. 8.0
38% better than Maryland average

Maryland average: 12.9

Functional decline score Info A composite score based on activities of daily living decline, walking ability decline, and incontinence. 14.6
43% better than Maryland average

Maryland average: 25.7

Long-stay resident measures
Average Maryland avg: 3.8 Info CMS star rating based on long-stay quality measure performance. 5 stars = significantly above average, 1 star = significantly below average.
Need for Help with Daily Activities Increased Info Percent of long-stay residents whose need for help with daily activities has increased 6.5%
73% better than Maryland average

Maryland average: 23.7%

Walking Ability Worsened Info Percent of long-stay residents whose ability to move independently worsened 7.6%
72% better than Maryland average

Maryland average: 27.7%

Low Risk Residents with Bowel/Bladder Incontinence Info Percent of low risk long-stay residents who lose control of their bowels or bladder 29.6%
14% worse than Maryland average

Maryland average: 25.9%

Falls with Major Injury Info Percent of long-stay residents experiencing one or more falls with major injury 5.2%
127% worse than Maryland average

Maryland average: 2.3%

High Risk Residents with Pressure Ulcers Info Percent of long-stay high risk residents with pressure ulcers 6.9%
6% worse than Maryland average

Maryland average: 6.5%

Urinary Tract Infection Info Percent of long-stay residents with a urinary tract infection 2.2%
36% worse than Maryland average

Maryland average: 1.6%

Lost Too Much Weight Info Percent of long-stay residents who lose too much weight 14.0%
142% worse than Maryland average

Maryland average: 5.8%

Depressive Symptoms Info Percent of long-stay residents who have depressive symptoms 59.9%
196% worse than Maryland average

Maryland average: 20.2%

Antipsychotic Use Info Percent of long-stay residents who received an antipsychotic medication 17.0%
31% worse than Maryland average

Maryland average: 12.9%

Pneumococcal Vaccine Info Percent of long-stay residents assessed and appropriately given the pneumococcal vaccine 74.6%
19% worse than Maryland average

Maryland average: 92.0%

Influenza Vaccine Info Percent of long-stay residents assessed and appropriately given the seasonal influenza vaccine 95.2%
In line with Maryland average

Maryland average: 96.6%

Hospitalizations per 1,000 days Info Number of hospitalizations per 1,000 long-stay resident days. 2.26
71% worse than Maryland average

Maryland average: 1.32

ED visits per 1,000 days Info Number of outpatient emergency department visits per 1,000 long-stay resident days. 2.32
92% worse than Maryland average

Maryland average: 1.21

Short-stay resident measures
Below average Maryland avg: 3.7 Info CMS star rating based on short-stay quality measure performance. 5 stars = much above average, 1 star = much below average.
Pneumococcal Vaccine Info Percent of short-stay residents assessed and appropriately given the pneumococcal vaccine 42.9%
45% worse than Maryland average

Maryland average: 78.4%

Antipsychotic medication increase Info Percent of short-stay residents who newly received an antipsychotic medication 1.9%
33% worse than Maryland average

Maryland average: 1.4%

Influenza Vaccine Info Percent of short-stay residents assessed and appropriately given the seasonal influenza vaccine 62.0%
23% worse than Maryland average

Maryland average: 80.6%

Re-hospitalized after SNF stay Info Percentage of short-stay residents who were re-hospitalized after their nursing home admission. 16.7%
21% better than Maryland average

Maryland average: 21.2%

Emergency department visits Info Percentage of short-stay residents who had an outpatient emergency department visit. 16.6%
68% worse than Maryland average

Maryland average: 9.9%

Falls with major injury Info Percentage of SNF residents who experience falls with major injury during their stay. 0.0%
100% better than Maryland average

Maryland average: 0.8%

Ability to care for self at discharge Info Percentage of residents at or above expected ability to care for themselves at discharge. 50.6%
6% worse than Maryland average

Maryland average: 53.7%

Successful return to home or community Info Rate of successful return to home or community from a skilled nursing facility. 42.9%
15% worse than Maryland average

Maryland average: 50.6%

Penalties and fines

Federal penalties imposed by CMS for regulatory violations, including civil money penalties (fines) and denials of payment for new Medicare/Medicaid admissions.

Source: CMS Penalties Database (Data as of Jan 2026)

Total fines amount $101K
65% higher than Maryland average

Maryland average: $61K

Number of fines 1
33% fewer fines than Maryland average

Maryland average: 1.5

Payment Denials Info Serious action where Medicare and/or Medicaid temporarily stops payments for new residents until issues are fixed. 0
100% fewer payment denials than Maryland average

Maryland average: 0.1

Fines amount comparison
This facility $101K
Maryland average $61K
Penalty History

Penalties are imposed by CMS for violations of federal nursing home regulations.

Civil Money Penalty Info Fines imposed for noncompliance, which can be assessed per day or per instance of violation. Aug 5, 2024
$101K

Last updated: Jan 2026

Guides for Better Senior Living

Care Cost Calculator: See Prices in Your Area

Nursing Home Data Explorer

Don’t Wait Too Long: 7 Red Flag Signs Your Parent Needs Assisted Living Now

The True Cost of Assisted Living in 2025 – And How Families Are Paying For It

Understanding Senior Living Costs: Pricing Models, Discounts & Financial Assistance

Financial Aid for Maryland Seniors

Get financial aid guidance

Community Options Waiver

Maryland Medicaid Community Options Waiver

Age 65+ or disabled, Maryland resident, Medicaid- eligible, nursing home-level care need.

~$2,829/month (300% FBR, individual).

$2,000 (individual), $3,000 (couple) (excludes home, car).

High urban demand; rural outreach efforts.

Senior Care Program

Maryland Senior Care

Age 65+, Maryland resident, at risk of nursing home placement.

~$2,000/month (individual, varies by county).

$11,000 (individual).

Limited funding; waitlists common in high-demand areas.

Maryland Nursing Home Medicaid

Maryland Medical Assistance (Medicaid) Nursing Home Program

Age 65+, Maryland resident, Medicaid-eligible, requires nursing home-level care.

$943/month (individual); most income applied to care costs.

$2,500 (individual), $3,000 (couple); spousal protections up to $155,356.

Home equity limit $636,000; estate recovery applies post-55.

Senior Assisted Living Subsidy Program

Maryland Senior Assisted Living Group Home Subsidy

Age 62+, Maryland resident, in or moving to approved assisted living, low/moderate income.

~$34,000/year (individual, varies by county).

Not strict; prioritizes low-income.

Not available statewide; facility must be licensed by MDH.

Veterans Aid and Attendance (A&A) Benefit

Maryland VA Aid and Attendance

Wartime veteran/spouse, age 65+ or disabled, needs ADL help, Maryland resident.

Net income minus medical expenses < $1,984/month (individual with A&A).

$155,356 (net worth limit).

High veteran population in suburban/rural areas.

Senior Prescription Drug Assistance Program (SPDAP)

Maryland Senior Prescription Drug Assistance Program

Age 65+, Maryland resident (6+ months), Medicare Part D enrolled.

$48,560/year (individual, 300% FPL).

None specified.

Supplements Medicare Part D; annual enrollment required.

Medicare Savings Programs (MSP)

Maryland Medicare Savings Programs

Age 65+, Maryland resident, Medicare Part A/B enrollee.

$2,014/month (QMB), $2,706/month (SLMB/QI, individual).

$9,090 (individual), $13,630 (couple).

Includes QMB, SLMB, QI categories.

Community Personal Assistance Services (CPAS)

Maryland Medicaid Community Personal Assistance Services

Age 65+, Maryland resident, Medicaid-eligible, needs ADL assistance.

$943/month (individual); spend-down available.

$2,500 (individual), $3,000 (couple).

Consumer-directed option allows hiring family caregivers.

Tour Icon
Planning a tour? Check our touring checklist.
Chat Icon
Thinking of living here? We can help you speak to a current resident