


Total staff
109
Employees
109
Contractors
0
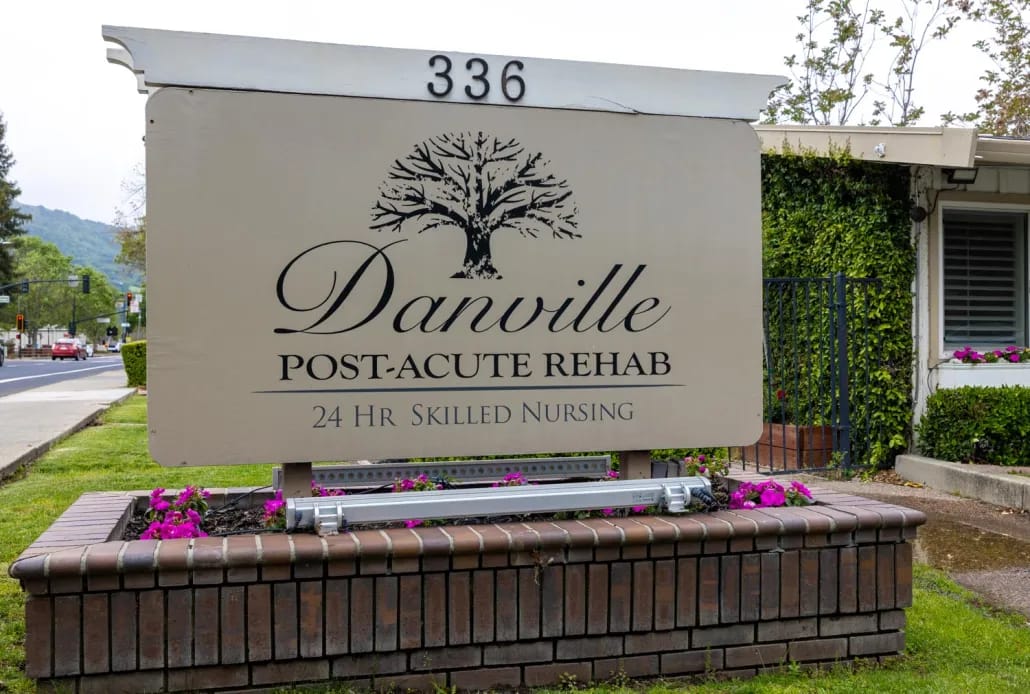

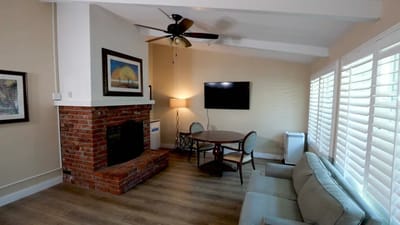

Danville Post-Acute Rehab is a well-regarded nursing home in Danville, CA, offering rehabilitation and skilled nursing. Promoting a warm and home-like environment, the community ensures older adults live comfortably in retirement. Therapy services, 24-hour care, and recreational activities are also offered to enrich residents’ living experiences. Through a holistic approach to care, the community strives to provide the best possible care tailored to residents’ ever-changing needs and habits.
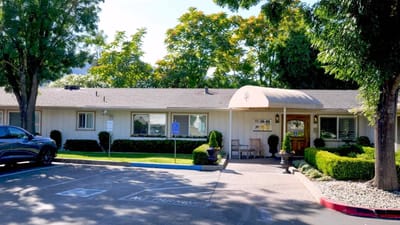
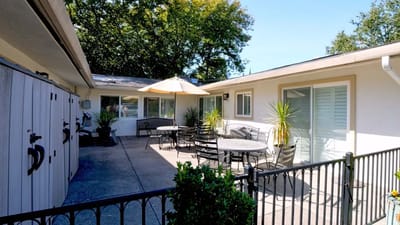
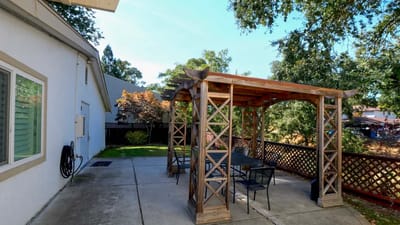
Arts and crafts classes, current events, and local trips provide residents with more opportunities to explore and have fun. Lively gathering areas and spacious rooms are also available, so residents can rest and move around comfortably. Situated near a highway, restaurants, and shops in Danville, the community guarantees accessibility and convenience. This nursing home has high standards of care and state-of-the-art amenities, making it one of the trusted options for senior living in California.
| Staff type | Hours / Day / Resident | vs state avg |
|---|---|---|
|
Registered Nurse (RN)
| 33m per day | ▼ 15% State avg: 39m per day · National avg: 41m per day |
|
LPN / LVN
| 1h 19m per day | ▲ 8% State avg: 1h 13m per day · National avg: 52m per day |
|
Nurse Aide
| 2h 35m per day | ▼ 3% State avg: 2h 39m per day · National avg: 2h 21m per day |
|
Weekend Total Nursing
| 4h 0m per day | ■ Avg State avg: 4h 5m per day · National avg: 3h 26m per day |
|
Physical Therapist
| 11m per day | ▲ 117% State avg: 5m per day · National avg: 4m per day |
|
Weekend RN
| 24m per day | ▼ 19% State avg: 30m per day · National avg: 29m per day |
Reporting period: October 1 – December 31, 2025 (Q4 2025). Source: CMS Payroll-Based Journal report.
Manages medical care and health needs.
Assists with medical care and medications.
Helps with daily care and mobility.
| Certified Nursing Assistant | 58 | 0 | 58 | 20,087 | 92 | 100% | 7.9 |
| Licensed Practical Nurse | 20 | 0 | 20 | 8,423 | 92 | 100% | 8.1 |
| Registered Nurse | 11 | 0 | 11 | 3,784 | 92 | 100% | 7.9 |
| RN Director of Nursing | 4 | 0 | 4 | 1,823 | 70 | 76% | 7.9 |
| Dental Services Staff | 3 | 0 | 3 | 1,481 | 66 | 72% | 7.9 |
| Respiratory Therapy Technician | 4 | 0 | 4 | 1,409 | 77 | 84% | 6.3 |
| Occupational Therapy Aide | 2 | 0 | 2 | 986 | 77 | 84% | 8 |
| Speech Language Pathologist | 3 | 0 | 3 | 682 | 80 | 87% | 6.3 |
| Therapeutic Recreation Specialist | 1 | 0 | 1 | 646 | 75 | 82% | 8.6 |
| Administrator | 1 | 0 | 1 | 528 | 66 | 72% | 8 |
| Nurse Practitioner | 1 | 0 | 1 | 496 | 62 | 67% | 8 |
| Qualified Social Worker | 1 | 0 | 1 | 302 | 45 | 49% | 6.7 |
Federal penalties imposed by CMS for regulatory violations, including civil money penalties (fines) and denials of payment for new Medicare/Medicaid admissions.
Source: CMS Penalties Database
No penalties in the past 3 years
No civil money penalties or payment denials were reported in the last 3 years.
These measures show how residents usually do over time at this home, based on health outcomes and preventive care.
California average: 6.6
California average: 11.3
California average: 11.1%
California average: 12.0%
California average: 11.3%
California average: 1.7%
California average: 5.0%
California average: 1.2%
California average: 4.2%
California average: 6.7%
California average: 10.1%
California average: 98.5%
California average: 98.2%
California average: 94.0%
California average: 1.5%
California average: 93.2%
California average: 23.2%
California average: 11.2%
California average: 0.8%
California average: 53.7%
California average: 50.6%
Quality measures are calculated from Minimum Data Set (MDS) assessments. For most measures, lower percentages indicate better care quality.
35% of new residents, usually for short-term rehab.
48% of new residents, often for short stays.
17% of new residents, often for long-term daily care.
Source: CMS Long-Term Care Facility Characteristics (Data as of Jan 2026)
Residents meet regularly to discuss policies, care quality, and activities
Organized group of residents that meets regularly to discuss facility policies, quality of life, and activities.
Data sourced from CMS Long-Term Care Facility Characteristics quarterly report. Payer mix reflects the current resident census by primary payment source.
Historical financial and operational data for Danville Post-Acute Rehab from 2011–2023, based on CMS SNF Cost Reports.
Key figures below are for fiscal year ending in 12/2023.
Based on CMS SNF Cost Report for fiscal year ending in 12/2023.
No pets allowed
Building Type: Single-story

On-site Medical Care and Health Services
Rehabilitative Support
Social and Recreational Activities
This home supports both short-term rehab and long-term care, with residents staying for a wide range of durations.
New residents most often arrive under private pay (48% of admissions), and a typical private pay stay runs around 24 days.
Coverage residents most often arrive under.
Coverage residents most often leave under.
![]() 0.8 miles from city center
0.8 miles from city center
![]() Estimated distance in miles from Danville's city center to Danville Post-Acute Rehab's address, calculated via Google Maps.
Estimated distance in miles from Danville's city center to Danville Post-Acute Rehab's address, calculated via Google Maps.
Add your location
Danville Post-Acute Rehab is located in Danville, California.
Here are the financial assistance programs available to residents in California.
Danville Post-Acute Rehab is in the Diablo Road neighborhood.
Danville Post-Acute Rehab has a walk score of 85. Very walkable. Most errands can be accomplished on foot, and many essentials are within a short walk.
Danville Post-Acute Rehab's occupancy is 89.2%.
No, Danville Post-Acute Rehab has a no-pet policy.
The team at Danville Post-Acute Rehab can be reached at contact-Danville@ensignservices.net.
Danville Post-Acute Rehab is registered as a for-profit.
Yes — there are 7 photos of Danville Post-Acute Rehab in the photo gallery on this page.
Care Cost Calculator: See Prices in Your Area
Nursing Home Data Explorer
Don’t Wait Too Long: 7 Red Flag Signs Your Parent Needs Assisted Living Now
The True Cost of Assisted Living in 2025 – And How Families Are Paying For It
Understanding Senior Living Costs: Pricing Models, Discounts & Financial Assistance


