Delano District Skilled Nursing
CMS overall rating Info CMS (the Centers for Medicare & Medicaid Services) is the federal agency that rates nursing home quality. Its Overall Rating runs from 1 to 5 stars, combining health inspections, staffing, and quality measures, with inspections weighted most heavily.

Delano District Skilled Nursing

CMS overall rating Info CMS (the Centers for Medicare & Medicaid Services) is the federal agency that rates nursing home quality. Its Overall Rating runs from 1 to 5 stars, combining health inspections, staffing, and quality measures, with inspections weighted most heavily.
Calculator: See prices in your area
Delano District Skilled Nursing accepts Medicare, Medicaid, and private pay.

Overview of Delano District Skilled Nursing

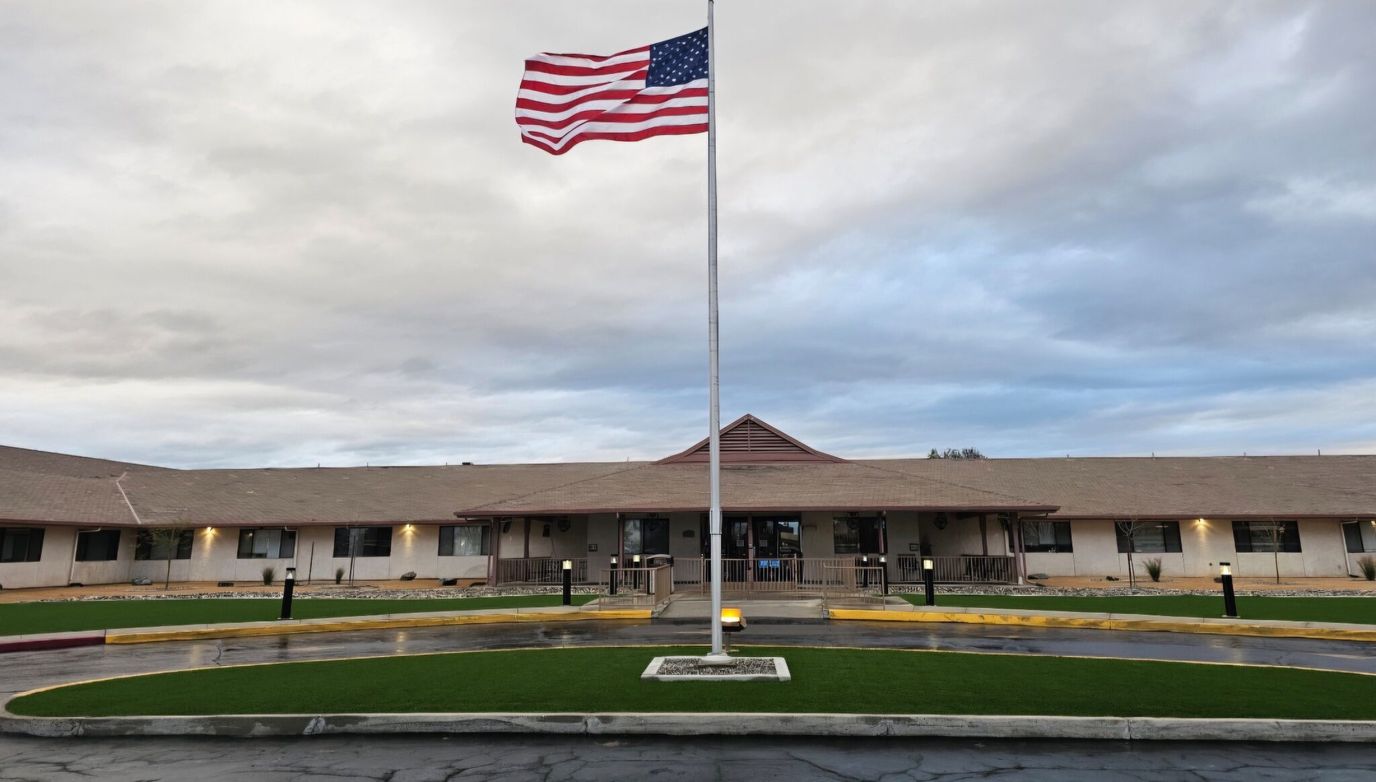
Delano District Skilled Nursing is a top-rated nursing home in Delano, CA, that specializes in nursing care. With its clean and thoughtfully designed setting, the community ensures older adults are comfortable and safe. Housekeeping, three well-balanced meals, and social services are also provided to enrich residents’ living experiences. The community also focuses on residents’ holistic wellness, providing care plans tailored to their unique needs and preferences.

Monthly trips, creative activities, and fitness programs allow residents to connect with friends and explore new interests. Physical, occupational, and speech therapy also help residents recover and return to their routines with ease. Adventist Health Delano, Delano Heritage Park, and public transportation are also located nearby, ensuring convenient access to healthcare and leisure. As one of the best choices for senior living in California, this nursing home continuously provides exceptional care to help older adults thrive in retirement.

Quality ratings

Measured by Centers for Medicare & Medicaid Services (CMS)

Overall rating Info The Overall CMS Rating combines results from health inspections, staffing levels and quality measures. Health inspections carry the most weight. Staffing and quality scores can increase or decrease the final rating based on performance compared to state and national standards.
▼ 68.2% Below CA avg. ▼ 68.2% Below CA avg.CA average: 3.1Click the badge to see the full State ranking.Click here to see the full State ranking.
Health Inspection Info Based on the results of the facility's three most recent standard inspections and any complaint investigations. CMS reviews the number, scope, and severity of deficiencies, with more recent findings weighted more heavily.
▼ 64.2% Below CA avg. ▼ 64.2% Below CA avg.CA average: 2.8Click the badge to see the full State ranking.Click here to see the full State ranking.
Staffing Info Measures average nursing staff hours per resident per day, including Registered Nurses (RNs) and total nursing staff. Ratings are adjusted based on the level of care residents require and are compared to state and national benchmarks.
▼ 68.1% Below CA avg. ▼ 68.1% Below CA avg.CA average: 3.1Click the badge to see the full State ranking.Click here to see the full State ranking.
Quality Measures Info Based on clinical and physical health indicators reported to CMS, such as hospital readmissions, falls, pressure ulcers, and improvements in mobility. These measures reflect how well residents' health needs are being managed.
▼ 26.6% Below CA avg. ▼ 26.6% Below CA avg.CA average: 4.1Click the badge to see the full State ranking.Click here to see the full State ranking.

Capacity and availability

This home usually has limited availability

Higher occupancy than the California average: 84.7%
Occupancy rate
92.6% Rank #254 / 1537Occupancy rate — State benchmarkedThis home is ranked 254th out of 1537 homes in California. Shows this facility's occupancy rate versus the California average, with its Statewide rank out of 1537. Higher occupancy signals strong local demand and financial stability.Rankings are based only on facilities in California that report data for that category. Facilities without available data are excluded from the ranking.Click the rank badge to see the full State ranking.Click here to see the full State ranking.
Avg. Length of Stay
405 days
Bed community size
141-bed community Rank #418 / 1657Bed count — State benchmarkedThis home is ranked 418th out of 1657 homes in California. Shows this facility's certified or reported bed count compared to other California facilities. Larger communities may offer more amenities, programs, and on-site services for residents and families.Rankings are based only on facilities in California that report data for that category. Facilities without available data are excluded from the ranking.Click the rank badge to see the full State ranking.Click here to see the full State ranking.
A larger shared setting that may offer more common spaces and organized community services.
Walk Score
Walk Score: 48 / 100 Rank #1392 / 2092Walk Score — State benchmarkedThis home is ranked 1392nd out of 2092 homes in California. Shows how walkable this facility's neighborhood is compared to the average Walk Score across California facilities. Higher scores benefit residents, families, and staff.Rankings are based only on facilities in California that report data for that category. Facilities without available data are excluded from the ranking.Click the rank badge to see the full State ranking.Click here to see the full State ranking.
Somewhat walkable. A few nearby services may be reachable on foot, but most trips require transportation.

Contact Delano District Skilled Nursing

Penalties and fines

Includes penalties issued in 2024

Federal penalties imposed by CMS for regulatory violations, including civil money penalties (fines) and denials of payment for new Medicare/Medicaid admissions.

Source: CMS Penalties Database (Data as of Jan 2026)

Total fines amount $18K Rank #263 / 362Federal fines — State benchmarkedThis home is ranked 263rd out of 362 homes in California. Shows this facility's cumulative CMS federal fine dollars versus the California average among facilities with fines, and where it ranks among 362 facilities in the pool. Lower total dollars mean a better rank.Rankings are based only on facilities in California that report data for that category. Facilities without available data are excluded from the ranking.Click the rank badge to see the full State ranking.Click here to see the full State ranking.
67% lower than California average

California average: $55K

Number of fines 2
15% fewer fines than California average

California average: 2.4

Payment Denials Info Serious action where Medicare and/or Medicaid temporarily stops payments for new residents until issues are fixed. 0
100% fewer payment denials than California average

California average: 0.5

Fines amount comparison
This facility $18K
California average $55K
Penalty History

Penalties are imposed by CMS for violations of federal nursing home regulations.

2 penalties in the past 3 years

Multiple penalties were reported in the last 3 years.

Civil Money Penalty Info Fines imposed for noncompliance, which can be assessed per day or per instance of violation. May 29, 2024
$9K
Civil Money Penalty Info Fines imposed for noncompliance, which can be assessed per day or per instance of violation. Jan 3, 2024
$9K

Last updated: Jan 2026

Quality of care over time

These measures show how residents usually do over time at this home, based on health outcomes and preventive care.

High-risk clinical events score Info A composite score based on pressure ulcers, falls with injury, weight loss, walking ability decline, and activities of daily living decline. 7.7
16% worse than California average

California average: 6.6

Functional decline score Info A composite score based on activities of daily living decline, walking ability decline, and incontinence. 16.1
42% worse than California average

California average: 11.3

Long-stay resident measures
Significantly above average Info CMS star rating based on long-stay quality measure performance. 5 stars = significantly above average, 1 star = significantly below average.
Need for Help with Daily Activities Increased Info Percent of long-stay residents whose need for help with daily activities has increased 13.8%
25% worse than California average

California average: 11.1%

Walking Ability Worsened Info Percent of long-stay residents whose ability to move independently worsened 17.8%
49% worse than California average

California average: 12.0%

Low Risk Residents with Bowel/Bladder Incontinence Info Percent of low risk long-stay residents who lose control of their bowels or bladder 16.8%
48% worse than California average

California average: 11.3%

Falls with Major Injury Info Percent of long-stay residents experiencing one or more falls with major injury 1.5%
7% better than California average

California average: 1.7%

High Risk Residents with Pressure Ulcers Info Percent of long-stay high risk residents with pressure ulcers 2.5%
49% better than California average

California average: 5.0%

Urinary Tract Infection Info Percent of long-stay residents with a urinary tract infection 0.6%
52% better than California average

California average: 1.2%

Lost Too Much Weight Info Percent of long-stay residents who lose too much weight 2.9%
32% better than California average

California average: 4.2%

Depressive Symptoms Info Percent of long-stay residents who have depressive symptoms 7.2%
7% worse than California average

California average: 6.7%

Antipsychotic Use Info Percent of long-stay residents who received an antipsychotic medication 8.8%
13% better than California average

California average: 10.1%

Pneumococcal Vaccine Info Percent of long-stay residents assessed and appropriately given the pneumococcal vaccine 99.0%
In line with California average

California average: 98.5%

Influenza Vaccine Info Percent of long-stay residents assessed and appropriately given the seasonal influenza vaccine 100.0%
In line with California average

California average: 98.2%

Hospitalizations per 1,000 days Info Number of hospitalizations per 1,000 long-stay resident days. 2.22
In line with California average

California average: 2.25

ED visits per 1,000 days Info Number of outpatient emergency department visits per 1,000 long-stay resident days. 3.46
118% worse than California average

California average: 1.59

Short-stay resident measures
Below average Info CMS star rating based on short-stay quality measure performance. 5 stars = much above average, 1 star = much below average.
Pneumococcal Vaccine Info Percent of short-stay residents assessed and appropriately given the pneumococcal vaccine 96.3%
In line with California average

California average: 94.0%

Antipsychotic medication increase Info Percent of short-stay residents who newly received an antipsychotic medication 1.6%
10% worse than California average

California average: 1.5%

Influenza Vaccine Info Percent of short-stay residents assessed and appropriately given the seasonal influenza vaccine 92.9%
In line with California average

California average: 93.2%

Re-hospitalized after SNF stay Info Percentage of short-stay residents who were re-hospitalized after their nursing home admission. 22.0%
5% better than California average

California average: 23.2%

Emergency department visits Info Percentage of short-stay residents who had an outpatient emergency department visit. 17.9%
60% worse than California average

California average: 11.2%

Falls with major injury Info Percentage of SNF residents who experience falls with major injury during their stay. 0.0%
100% better than California average

California average: 0.8%

Ability to care for self at discharge Info Percentage of residents at or above expected ability to care for themselves at discharge. 40.3%
25% worse than California average

California average: 53.7%

Successful return to home or community Info Rate of successful return to home or community from a skilled nursing facility. 31.1%
39% worse than California average

California average: 50.6%

Breakdown by payment type

Medicare

53% of new residents, usually for short-term rehab.

Typical stay 2 - 3 months

Private pay

20% of new residents, often for short stays.

Typical stay 2 - 3 months

Medicaid

27% of new residents, often for long-term daily care.

Typical stay 4 years

Facility Characteristics

Source: CMS Long-Term Care Facility Characteristics (Data as of Jan 2026)

Total residents 138
Medicare
11
8% of residents
Medicaid
121
87.7% of residents
Private pay or other
6
4.3% of residents
Programs & Services
Nurse Aide Training

State-approved Nurse Aide Training and Competency Evaluation Program on-site

Finances and operations

Based on CMS SNF Cost Report for fiscal year ending in 06/2024.

Nonprofit
Nonprofit Corporation
Net patient revenue Info Net patient revenue — what the home actually collects for resident care, after contractual allowances, bad debt and discounts are subtracted from its gross charges (CMS cost report, Worksheet G-3). It covers resident care only; money the home earns from other sources is shown separately as "Other income."
$26.4M
Net patient income Info Net patient income: net patient revenue minus the home's total operating expenses. A positive figure means it earns more from resident care than it spends to deliver it; a negative figure means the opposite. It excludes non-operating "other income."
-$2.1M
Nonprofit Nonprofit Corporation
Net patient revenue Info Net patient revenue — what the home actually collects for resident care, after contractual allowances, bad debt and discounts are subtracted from its gross charges (CMS cost report, Worksheet G-3). It covers resident care only; money the home earns from other sources is shown separately as "Other income."
$26.4M Rank #62 / 355Revenue — State benchmarkedThis home is ranked 62nd out of 355 homes in California. Shows this facility's annual revenue compared to the California average. Higher revenue generally means more resources for staffing and capital — read alongside Payroll %.Rankings are based only on facilities in California that report data for that category. Facilities without available data are excluded from the ranking.Click the rank badge to see the full State ranking.Click here to see the full State ranking.
Net patient income Info Net patient income: net patient revenue minus the home's total operating expenses. A positive figure means it earns more from resident care than it spends to deliver it; a negative figure means the opposite. It excludes non-operating "other income."
-$2.1M
Other income Info Money the home earns outside of resident care — such as investments, grants, rentals and other non-operating sources (CMS cost report, Worksheet G-3). It is tracked separately from net patient revenue: it is not part of that figure, and it is not included in net patient income.
$646.9K
Payroll costs Info Staff salaries plus wage-related costs — benefits such as payroll taxes, health insurance and retirement — from the home's own accounting records (CMS cost report, Worksheet A). Contract or agency labor is counted separately, under other operating costs. Rank #7 / 355Payroll — State benchmarkedThis home is ranked 7th out of 355 homes in California. Shows total annual staff payroll benchmarked to the California average. Higher payroll investment relative to peers often signals better staffing and less reliance on cheaper contract labor.Rankings are based only on facilities in California that report data for that category. Facilities without available data are excluded from the ranking.Click the rank badge to see the full State ranking.Click here to see the full State ranking.
$18.7M 70.7% of net patient revenue Info Payroll as a share of revenue: staff salaries and wage-related benefits divided by net patient revenue. A higher figure means more of each revenue dollar goes to staff pay. Rank #35 / 355Payroll % — State benchmarkedThis home is ranked 35th out of 355 homes in California. Shows payroll as a percentage of revenue versus the California average. Well-run California facilities typically land around 55–67% — the top third Statewide. Below 25% may signal understaffing or heavy agency use — read with Staffing ratings.Rankings are based only on facilities in California that report data for that category. Facilities without available data are excluded from the ranking.Click the rank badge to see the full State ranking.Click here to see the full State ranking.
Other operating costs Info Everything it costs to run the home apart from payroll — food, utilities, supplies, maintenance, contract labor and administration. Calculated as total operating expense minus payroll (staff salaries and wage-related benefits).
$9.9M
Total costs Info The home's total operating expense for the year — all the costs of running it, salaries included (CMS cost report, Worksheet G-3).
$28.6M

What does this home offer?

Building type icon
Building type icon

Building Type: Single-story

Housekeeping icon
Housekeeping icon

Housekeeping Services

Social and recreational activities icon

Social and Recreational Activities

On-site medical care and health services icon

On-site Medical Care and Health Services

Who this home usually serves

TYPE OF STAY

Mostly short-term rehab stays

Most residents typically stay for a few weeks or months before returning home or moving on.

Most new residents arrive under Medicare (53% of admissions), and a typical Medicare stay runs around 2 - 3 months.

Admissions
107 total

Coverage residents most often arrive under.

Medicare 53%
Private pay 20%
Medicaid 27%
Discharges
118 total

Coverage residents most often leave under.

Medicare 50%
Private pay 8%
Medicaid 42%

Places of interest near Delano District Skilled Nursing

Address 1.0 miles from city center Info Estimated distance in miles from Delano's city center to Delano District Skilled Nursing's address, calculated via Google Maps.

Calculate Travel Distance to Delano District Skilled Nursing

Add your location

Address

Compare Nursing Homes around Kern County

The information below is reported by the California Department of Social Services and Department of Public Health.

3 facilities compared · CMS & CA Dept. of Health data

Valley Healthcare
NH
Bakersfield (Oleander/Sunset)
87
Facility 87
CA AVG 103
Rank #874 / 1657
81.2%
Facility 81.2%
CA AVG 84.7%
Rank #662 / 1537
-4%
3.30
Facility 3.30
CA AVG 4.22
Rank #327 / 354
-26%-22%
$116.9k
Facility $116.9k
CA AVG $56.5k
Rank #352 / 362
-
90
Facility 90
CA AVG 50.2
Rank #327 / 361
3.3
Facility 3.3
CA AVG 4.6
Rank #90 / 361
382-
81
Facility 81
CA AVG 57
Rank #384 / 2092
Bradley Steege
$8.5M
Facility $8.5M
CA AVG $17.0M
Rank #313 / 355
$4.8M
Facility $4.8M
CA AVG $7.0M
Rank #303 / 355
56.4%
Facility 56.4%
CA AVG 45.2%
Rank #52 / 355
555229
Delano District Skilled Nursing
NH
Delano (Tokay Street)
141
Facility 141
CA AVG 103
Rank #418 / 1657
92.6%
Facility 92.6%
CA AVG 84.7%
Rank #254 / 1537
+9%- --
$18.0k
Facility $18.0k
CA AVG $56.5k
Rank #263 / 362
-
61
Facility 61
CA AVG 50.2
Rank #273 / 361
1.9
Facility 1.9
CA AVG 4.6
Rank #7 / 361
2128-
48
Facility 48
CA AVG 57
Rank #1392 / 2092
Bradford Barker
$26.4M
Facility $26.4M
CA AVG $17.0M
Rank #62 / 355
$18.7M
Facility $18.7M
CA AVG $7.0M
Rank #7 / 355
70.7%
Facility 70.7%
CA AVG 45.2%
Rank #35 / 355
555479
Parkview Julian Nursing & Rehab
NH
Bakersfield (Wible Orchard)
99
Facility 99
CA AVG 103
Rank #725 / 1657
92.9%
Facility 92.9%
CA AVG 84.7%
Rank #246 / 1537
+10%
3.36
Facility 3.36
CA AVG 4.22
Rank #316 / 354
-39%-20%
$59.6k
Facility $59.6k
CA AVG $56.5k
Rank #321 / 362
-
94
Facility 94
CA AVG 50.2
Rank #333 / 361
2.8
Facility 2.8
CA AVG 4.6
Rank #50 / 361
478-
64
Facility 64
CA AVG 57
Rank #923 / 2092
Unison Healthcare, LLC
$13.3M
Facility $13.3M
CA AVG $17.0M
Rank #203 / 355
$6.5M
Facility $6.5M
CA AVG $7.0M
Rank #241 / 355
49.2%
Facility 49.2%
CA AVG 45.2%
Rank #247 / 355
55601

Financial Assistance for
Nursing Home in California

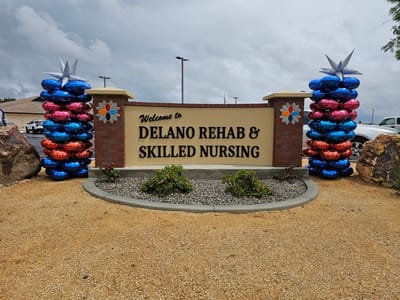
Delano District Skilled Nursing is located in Delano, California.
Here are the financial assistance programs available to residents in California.

Get Financial aid guidance

Multipurpose Senior Services Program

MSSP (Medi-Cal Waiver)

Age 65+
General California resident, Medi-Cal eligible, nursing home risk.
Income Limits (2025) ~$2,829/month 300% FBR, individual
Asset Limits $2,000 (individual), $3,000 (couple).
CA

County-managed; waitlists possible.

Benefits
In-home support (4-6 hours/day) Respite care (14 days/year) Meals (~$6/meal) Transportation (8 trips/month) Care management

In-Home Supportive Services (IHSS)

California IHSS

Age 65+
General California resident, Medicaid-eligible or low-income.
Income Limits ~$1,732/month individual, Medi-Cal threshold
Asset Limits $2,000 individual
CA

Can hire family as caregivers.

Benefits
Personal care (up to 283 hours/month) Homemaker services Respite (varies)

Multipurpose Senior Services Program (MSSP)

CA MSSP

Age 65+
General California resident, Medi-Cal-eligible, nursing home-eligible but community-capable.
Income Limits ~$2,829/month 300% FBR, individual
Asset Limits $2,000 individual
CA

Available in 38 counties; waitlists common.

Benefits
Case management Respite care (up to 10 days/year) Minor home mods (avg. $500) Adult day care (~$50/day)

Property Tax Postponement Program (PTP)

CA PTP

Age 62+
General California resident, own and live in home, 40% equity.
Income Limits (2025) ~$51,500/year household, adjusted annually
Asset Limits Equity-based; no strict asset cap.
CA

Deferred taxes accrue interest (5% as of 2024); repaid upon sale/death.

Benefits
Property tax deferral (avg. $1,000-$3,000/year, varies by county)

Assisted Living Waiver (ALW)

CA ALW

Age 65+ or disabled
General California resident, Medi-Cal-eligible, nursing home-eligible.
Income Limits ~$2,829/month 300% FBR, individual
Asset Limits $2,000 individual
CA

Available in 15 counties (e.g., LA, Sacramento); waitlists common.

Benefits
Personal care in ALFs (5-7 hours/day) Medication management Social services

California CARES Program

CA CARES

Age
General Caregivers of California residents 60+ needing help with 3+ daily activities; no caregiver age limit.
Income Limits No strict limit; cost-sharing above ~$2,500/month threshold.
Asset Limits Not applicable; need-based.
CA

High demand in urban areas; complements IHSS respite.

Benefits
Respite care (up to 10 days/year) Counseling (4-6 sessions/year) Training (2-3 workshops/year) Supplies (~$200/year)

Frequently Asked Questions about Delano District Skilled Nursing

What neighborhood is Delano District Skilled Nursing in?

Delano District Skilled Nursing is in the Tokay Street neighborhood.

Is Delano District Skilled Nursing in a walkable area?

Delano District Skilled Nursing has a walk score of 48. Somewhat walkable. A few nearby services may be reachable on foot, but most trips require transportation.

What is the occupancy rate at Delano District Skilled Nursing?

Delano District Skilled Nursing's occupancy is 92.6%.

Does Delano District Skilled Nursing operate as a for-profit or non-profit?

Delano District Skilled Nursing is registered as a non-profit.

Are there photos of Delano District Skilled Nursing?

Yes — there are 4 photos of Delano District Skilled Nursing in the photo gallery on this page.

What is the address of Delano District Skilled Nursing?

Delano District Skilled Nursing is located at 1509 Tokay St, Delano, CA 93215.

What is the phone number of Delano District Skilled Nursing?

(661) 720-2100 will put you in contact with the team at Delano District Skilled Nursing.

Guides for Better Senior Living

Care Cost Calculator: See Prices in Your Area

Nursing Home Data Explorer

Don’t Wait Too Long: 7 Red Flag Signs Your Parent Needs Assisted Living Now

The True Cost of Assisted Living in 2025 – And How Families Are Paying For It

Understanding Senior Living Costs: Pricing Models, Discounts & Financial Assistance