Occupancy rate
59%

We arrange tours, appointments, and even moving support so you don’t have to
Thank you for your interest!
Our team will be in touch shortly to help with next steps.
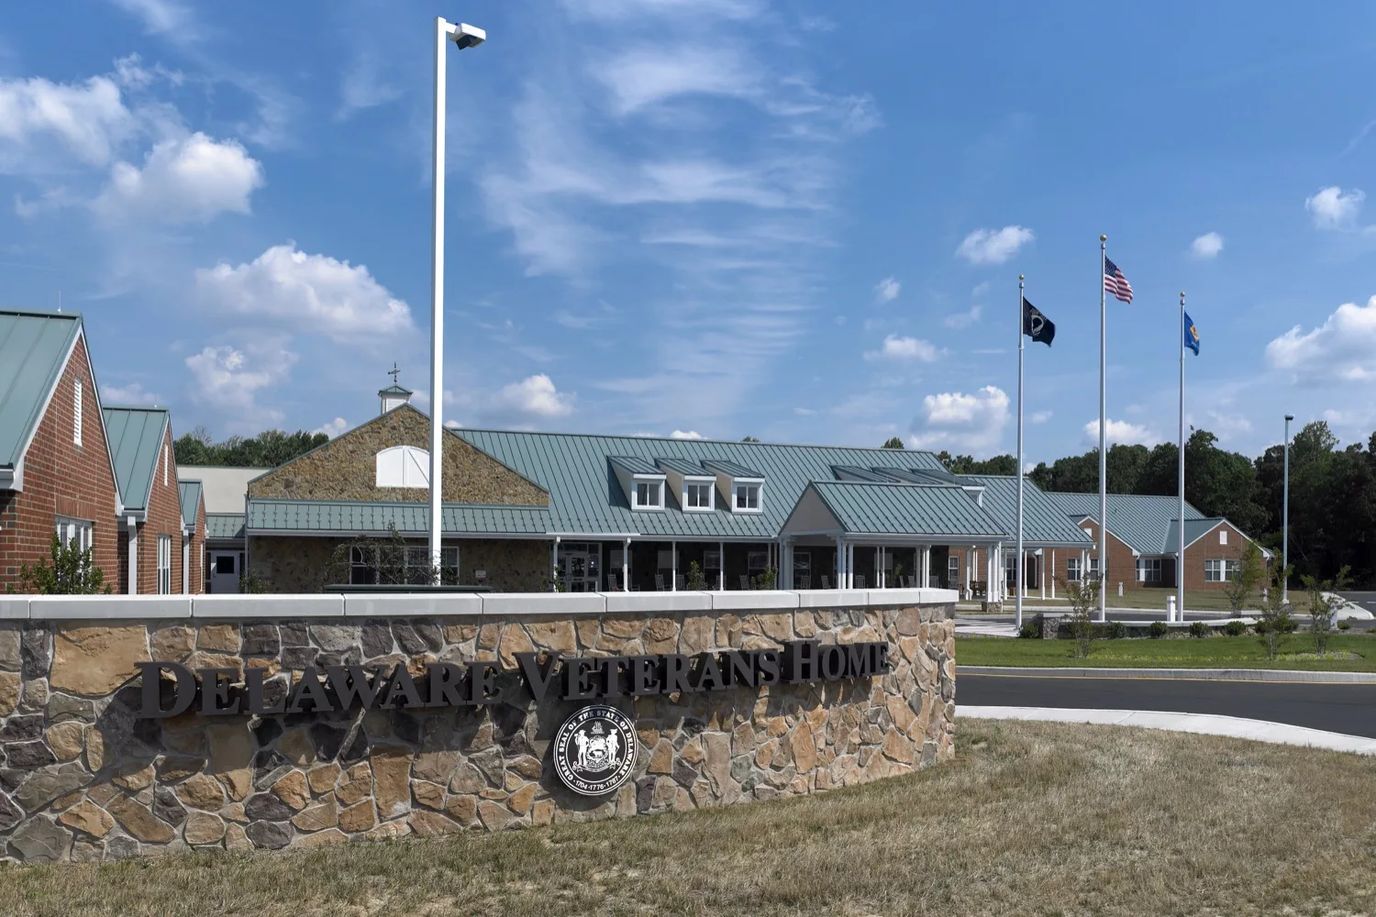
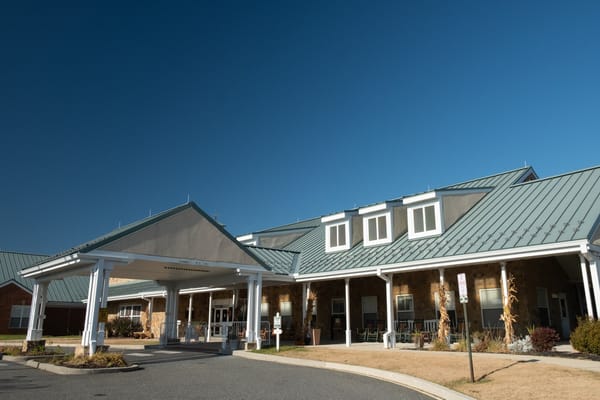
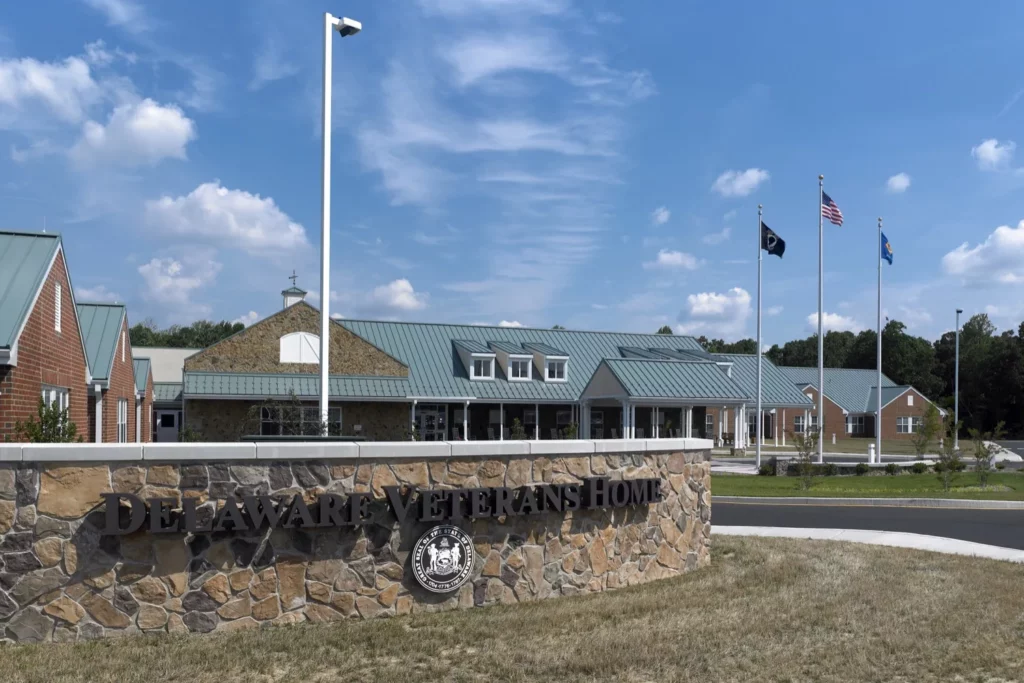
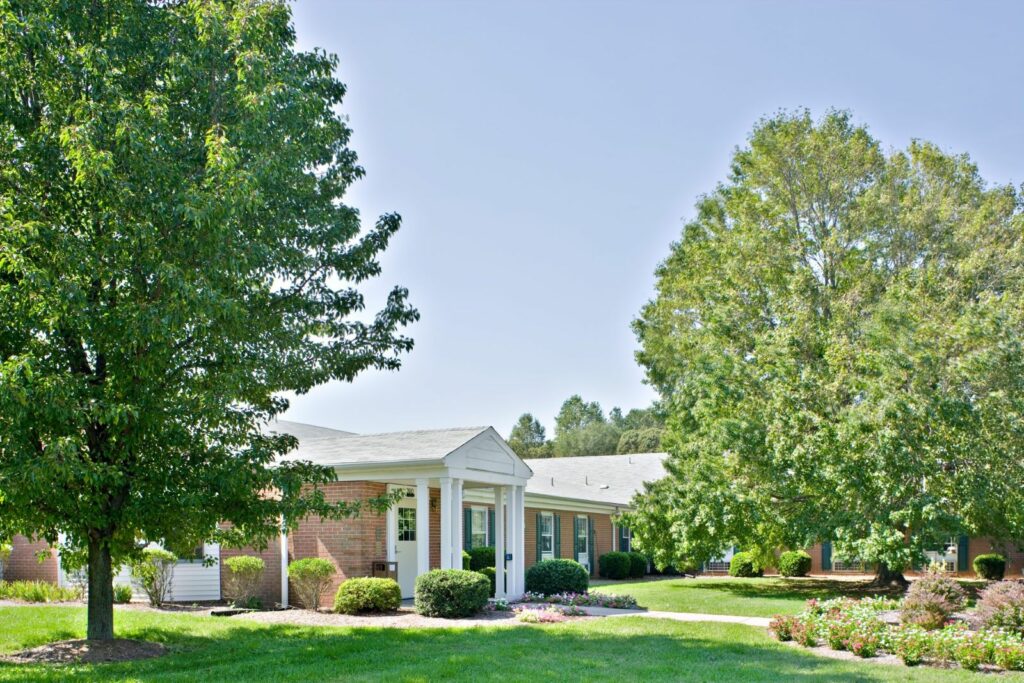
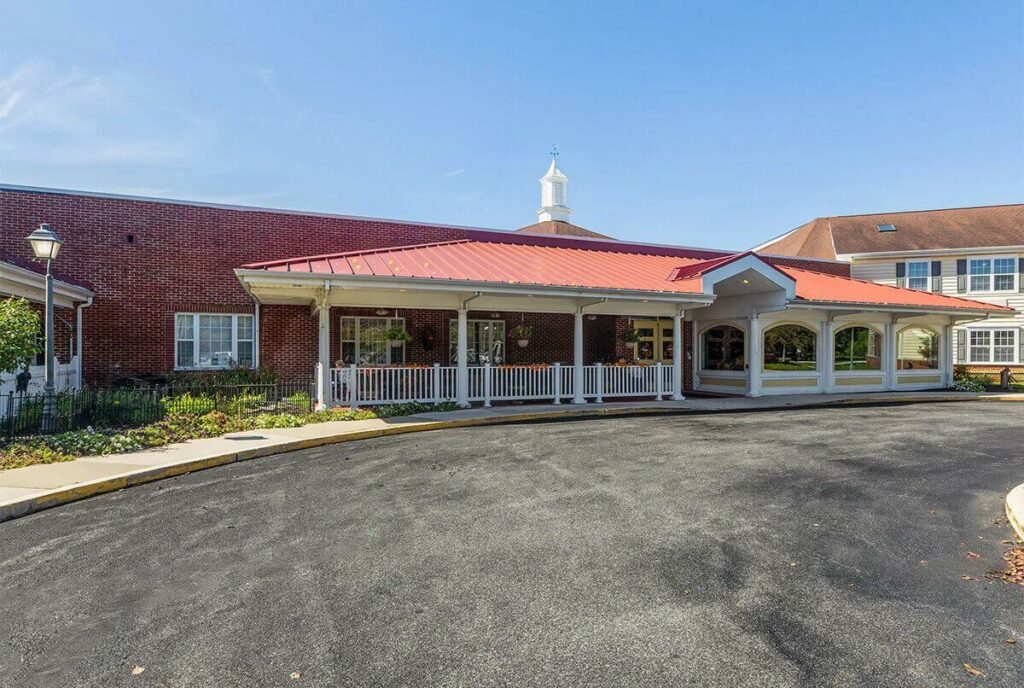
A community where patriotism and Delaware lifestyle meet, the Delaware Veterans Home encourages its veterans to find a new meaning of a quiet and peaceful way of life. Camaraderie is located in the atmosphere of the community and is found in how management and staff honor the retirement home. Seniors are ensured to maintain an active and enjoyable lifestyle in a restful new home.
In a nursing care home for veterans, residents are given fully-furnished bedrooms to enjoy leisure and spiritual activities, specialized programs, and healthy, delicious meals available. Its skilled nursing services include rehabilitative therapies– speech, occupational, and physical. A pathologist is available on-site.
Offers a balance of services and community atmosphere.
Lower occupancy suggests more openings may be available.
Delaware Veterans Home is administrated by Sandy Amaker.
Key information about the people who lead and staff this community.
In Delaware, the Department of Health and Social Services, Division of Health Care Quality is responsible for the oversight, unannounced inspection, and licensing of all long-term care settings.
Deficiencies indicate regulatory issues. A higher number implies the facility had several areas requiring improvement.
Delaware average: 64 deficiencies
The most recent inspection on August 1, 2025, found no deficiencies during a complaint investigation survey. Earlier inspections showed a mixed record, with prior reports citing deficiencies related mainly to resident care, medication administration, and safety, as well as staff training and infection control. A notable substantiated complaint in April 2024 involved abuse by nursing staff, resulting in termination of an employee, and other reports confirmed issues with emergency preparedness and documentation. Complaint investigations were mostly unsubstantiated except for a few substantiated cases involving abuse, fall reporting, and training deficiencies. The facility’s recent inspections indicate improvement, with the last two surveys showing no deficiencies after a period of multiple citations.
Delaware average 4.4
Last Health inspection on Mar 2025
Delaware average 38.9
Delaware average 8.72
Health citations are formal notices following inspections when they fail to comply with safety and care standards.
22 of 28 citations resulted from standard inspections; 5 of 28 resulted from complaint investigations; and 1 of 28 came from combined inspections (standard and complaint).
Delaware average: 0.9
Delaware average: 1.2
Data sourced from CMS Health Deficiencies reports. Citation severity codes range from A (least serious) to L (most serious). Immediate Jeopardy (J-L) citations indicate situations where the facility's noncompliance has placed residents at risk of death or serious harm.
Nursing Home Licensed facility providing 24/7 skilled nursing care for residents with complex, ongoing medical needs. Staffed by RNs, LPNs, and CNAs. Inspected and star-rated annually by CMS. Accepts Medicare (short-term rehab) and Medicaid (long-term care).
Assisted Living A licensed, long-term care setting for seniors or individuals with disabilities who need help with daily activities — like bathing, dressing, and medication management — but not 24-hour skilled nursing. Offers housing, meals, and around-the-clock support while aiming to maximize resident independence.
Respite Care Short-term temporary care — days to weeks — to give family caregivers a break. Full care provided during the stay. Often used after hospitalization or to trial a facility before a permanent placement decision.
Assisted Living A licensed, long-term care setting for seniors or individuals with disabilities who need help with daily activities — like bathing, dressing, and medication management — but not 24-hour skilled nursing. Offers housing, meals, and around-the-clock support while aiming to maximize resident independence.
Memory Care Secured, specialized care for people living with Alzheimer's or dementia. Staff trained in cognitive impairment, with higher staff-to-resident ratios and an environment designed to reduce confusion and wandering risk.
![]() 3.2 miles from city center — 2.28 miles to nearest hospital (Milford Wellness Village)
3.2 miles from city center — 2.28 miles to nearest hospital (Milford Wellness Village)
Add your location
This data corresponds to Q2 2025 and is based on CMS Payroll-Based Journal.
Delaware average ratio: 1.61:1
Delaware average: 7.6 hours
Manages medical care and health needs.
This role is partially covered by contractors.
Assists with medical care and medications.
This role is partially covered by contractors.
Helps with daily care and mobility.
This role is partially covered by contractors.
Total hours from contractors
17,207 contractor hours this quarter
| Certified Nursing Assistant | 33 | 29 | 62 | 21,070 | 91 | 100% | 10.5 |
| Registered Nurse | 14 | 15 | 29 | 7,715 | 91 | 100% | 10.4 |
| Clinical Nurse Specialist | 14 | 1 | 15 | 5,854 | 91 | 100% | 8.9 |
| Licensed Practical Nurse | 7 | 10 | 17 | 4,807 | 91 | 100% | 10.4 |
| Other Dietary Services Staff | 6 | 0 | 6 | 2,383 | 91 | 100% | 7.7 |
| Dental Services Staff | 2 | 0 | 2 | 839 | 61 | 67% | 7.4 |
| Nurse Practitioner | 2 | 0 | 2 | 465 | 62 | 68% | 7.5 |
| Mental Health Service Worker | 1 | 0 | 1 | 459 | 62 | 68% | 7.4 |
| Administrator | 1 | 0 | 1 | 458 | 61 | 67% | 7.5 |
| Dietitian | 1 | 0 | 1 | 398 | 53 | 58% | 7.5 |
| Physical Therapy Aide | 0 | 1 | 1 | 372 | 47 | 52% | 7.9 |
| Speech Language Pathologist | 0 | 3 | 3 | 361 | 38 | 42% | 7.2 |
| Respiratory Therapy Technician | 0 | 3 | 3 | 329 | 44 | 48% | 6.9 |
| Qualified Social Worker | 0 | 4 | 4 | 72 | 24 | 26% | 3 |
| Physical Therapy Assistant | 0 | 5 | 5 | 70 | 22 | 24% | 3.2 |
Source: CMS Long-Term Care Facility Characteristics (Data as of Jan 2026)
Residents meet regularly to discuss policies, care quality, and activities
Family members meet regularly to discuss policies, care quality, and activities
Organized group of family members that meets regularly to discuss facility policies, resident care, and activities.
Organized group of residents that meets regularly to discuss facility policies, quality of life, and activities.
Data sourced from CMS Long-Term Care Facility Characteristics quarterly report. Payer mix reflects the current resident census by primary payment source.
These measures show how residents usually do over time at this home, based on health outcomes and preventive care.
Delaware average: 9.6
Delaware average: 19.0
Delaware average: 15.4%
Delaware average: 19.8%
Delaware average: 22.1%
Delaware average: 3.0%
Delaware average: 4.4%
Delaware average: 2.1%
Delaware average: 5.8%
Delaware average: 6.0%
Delaware average: 11.0%
Delaware average: 95.3%
Delaware average: 97.4%
Delaware average: 82.1%
Quality measures are calculated from Minimum Data Set (MDS) assessments. For most measures, lower percentages indicate better care quality.
Federal penalties imposed by CMS for regulatory violations, including civil money penalties (fines) and denials of payment for new Medicare/Medicaid admissions.
Source: CMS Penalties Database (Data as of Jan 2026)
Delaware average: $98K
Delaware average: 1.9
Delaware average: 0.2
Penalties are imposed by CMS for violations of federal nursing home regulations.
Last updated: Jan 2026
Historical financial and operational data for Delaware Veterans Home based on CMS SNF Cost Reports.
Loading trend charts...
Care Cost Calculator: See Prices in Your Area
Nursing Home Data Explorer
Don’t Wait Too Long: 7 Red Flag Signs Your Parent Needs Assisted Living Now
The True Cost of Assisted Living in 2025 – And How Families Are Paying For It
Understanding Senior Living Costs: Pricing Models, Discounts & Financial Assistance

Touring a community? Use this expert-backed checklist to stay organized, ask the right questions, and find the perfect fit.
We'll send you a PDF version of the touring checklist.