Divine Rehabilitation and Nursing at Pearlview
Nursing Home, Memory Care & Nursing Care · Brunswick, OH
CMS overall rating Info CMS (the Centers for Medicare & Medicaid Services) is the federal agency that rates nursing home quality. Its Overall Rating runs from 1 to 5 stars, combining health inspections, staffing, and quality measures, with inspections weighted most heavily.

Divine Rehabilitation and Nursing at Pearlview

Nursing Home, Memory Care & Nursing Care · Brunswick, OH
CMS overall rating Info CMS (the Centers for Medicare & Medicaid Services) is the federal agency that rates nursing home quality. Its Overall Rating runs from 1 to 5 stars, combining health inspections, staffing, and quality measures, with inspections weighted most heavily.
Calculator: See prices in your area
Divine Rehabilitation and Nursing at Pearlview accepts Medicare, Medicaid, and private pay.

Overview of Divine Rehabilitation and Nursing at Pearlview

Meet your healthcare needs with Divine at Pearlview, a trusted community set in the harmonious neighborhood of Homestead Drive, Brunswick, OH, offering rehabilitation and nursing care. Here, residents receive the highest quality of care and assistance for their special needs with a responsible and specially trained team available 24/7. The community utilizes a holistic approach to care and a team comprised of highly qualified professionals, ensuring residents live their golden years without worries.

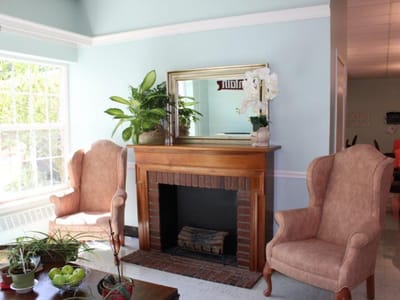
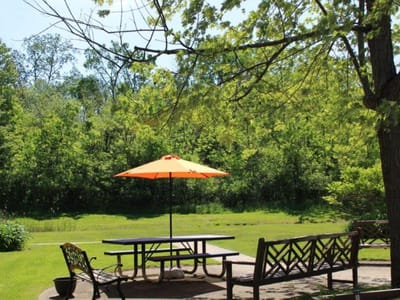
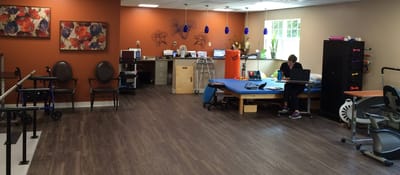
With its serene country setting, residents are guaranteed to enjoy a relaxing lifestyle. Diverse dining options are also provided to meet residents’ dietary needs and tastes. The community also provides specialized therapy for sports injuries, pre- and post-operation orthopedics, geriatric rehab, and fall prevention to enhance residents’ living conditions. Keep peace of mind and live your life to the fullest while receiving the community’s comprehensive care.

Quality ratings

Measured by Centers for Medicare & Medicaid Services (CMS)

Overall rating Info The Overall CMS Rating combines results from health inspections, staffing levels and quality measures. Health inspections carry the most weight. Staffing and quality scores can increase or decrease the final rating based on performance compared to state and national standards.
▲ 25.7% Above OH avg. ▲ 25.7% Above OH avg.OH average: 3.2Click the badge to see the full State ranking.Click here to see the full State ranking.
Health Inspection Info Based on the results of the facility's three most recent standard inspections and any complaint investigations. CMS reviews the number, scope, and severity of deficiencies, with more recent findings weighted more heavily.
▲ 7.1% Above OH avg. ▲ 7.1% Above OH avg.OH average: 2.8Click the badge to see the full State ranking.Click here to see the full State ranking.
Staffing Info Measures average nursing staff hours per resident per day, including Registered Nurses (RNs) and total nursing staff. Ratings are adjusted based on the level of care residents require and are compared to state and national benchmarks.
▲ 22.8% Above OH avg. ▲ 22.8% Above OH avg.OH average: 2.4Click the badge to see the full State ranking.Click here to see the full State ranking.
Quality Measures Info Based on clinical and physical health indicators reported to CMS, such as hospital readmissions, falls, pressure ulcers, and improvements in mobility. These measures reflect how well residents' health needs are being managed.
▲ 14.7% Above OH avg. ▲ 14.7% Above OH avg.OH average: 4.4Click the badge to see the full State ranking.Click here to see the full State ranking.

Staffing hours breakdown

Info Daily nursing hours per resident by staff type, reported to CMS. Higher is generally better — compare this facility to state and national averages to see where staffing stands.

Hours per resident per day — compared to Ohio state averages

Total nursing care / resident Info This home is ranked 177th out of 210 homes in Ohio for nurse hours. Total adjusted nursing hours per resident per day, combining RN, LPN, and aide time. CMS adjusts this for case-mix so facilities can be fairly compared.
3h 2m per day
Rank #177 / 210Nurse hours — State benchmarkedThis home is ranked 177th out of 210 homes in Ohio. Shows adjusted nurse hours per resident per day benchmarked to the Ohio average, with a ranking across 210 Ohio facilities. More hours mean more direct care. The national average is about 3.5 hrs; below 3.0 is a red flag.Rankings are based only on facilities in Ohio that report data for that category. Facilities without available data are excluded from the ranking.Click the rank badge to see the full State ranking.Click here to see the full State ranking.
This facility Ohio avg (3h 32m per day)
vs Ohio avg
-14%

4 of 6 metrics below state avg

Standout metric Weekend RN is +63% above state avg
Staff typeHours / Day / Residentvs state avg
Registered Nurse (RN) Info RNs hold the highest nursing license and can assess residents, interpret test results, and direct care plans. More RN hours per day often signals stronger clinical oversight and faster response to health changes. 57m per day ▲ 49% State avg: 38m per day · National avg: 41m per day
LPN / LVN Info Licensed Practical Nurses (LPNs) or Licensed Vocational Nurses (LVNs) deliver routine hands-on care — medication administration, wound dressing, and monitoring vital signs. They work under RN supervision and make up a large share of daily bedside care. 49m per day ▼ 15% State avg: 58m per day · National avg: 52m per day
Nurse Aide Info Certified Nurse Aides (CNAs) provide the most direct day-to-day assistance: bathing, dressing, feeding, and mobility. Nurse aide hours are typically the largest staffing category and directly affect residents' quality of life. 1h 45m per day ▼ 18% State avg: 2h 8m per day · National avg: 2h 21m per day
Weekend Total Nursing Info Combined nursing hours (RN + LPN + Nurse Aide) per resident per day on weekends. Staffing often drops on weekends — this figure reveals whether the facility maintains adequate coverage outside of weekday hours. 3h 9m per day ▼ 4% State avg: 3h 17m per day · National avg: 3h 26m per day
Physical Therapist Info Hours per resident per day provided by licensed Physical Therapists (PTs) or PT Assistants. PT services help residents recover mobility after injury or illness and are especially important for post-acute (short-stay) rehabilitation. 1m per day ▼ 65% State avg: 3m per day · National avg: 4m per day
Weekend RN Info Registered nurse hours specifically on weekends. Facilities sometimes reduce RN presence on Saturdays and Sundays — a low weekend RN figure compared to weekday hours can indicate reduced clinical oversight when most administrative staff are absent. 41m per day ▲ 63% State avg: 25m per day · National avg: 29m per day

Capacity and availability

This home usually has availability

Lower occupancy than the Ohio average: 78.7%
Occupancy rate
62.8% Rank #185 / 211Occupancy rate — State benchmarkedThis home is ranked 185th out of 211 homes in Ohio. Shows this facility's occupancy rate versus the Ohio average, with its Statewide rank out of 211. Higher occupancy signals strong local demand and financial stability.Rankings are based only on facilities in Ohio that report data for that category. Facilities without available data are excluded from the ranking.Click the rank badge to see the full State ranking.Click here to see the full State ranking.
Avg. Length of Stay
92 days
Bed community size
68-bed community Rank #176 / 323Bed count — State benchmarkedThis home is ranked 176th out of 323 homes in Ohio. Shows this facility's certified or reported bed count compared to other Ohio facilities. Larger communities may offer more amenities, programs, and on-site services for residents and families.Rankings are based only on facilities in Ohio that report data for that category. Facilities without available data are excluded from the ranking.Click the rank badge to see the full State ranking.Click here to see the full State ranking.
A moderately sized community that may balance personal attention with shared amenities and social activities.
Walk Score
Walk Score: 45 / 100 Rank #310 / 705Walk Score — State benchmarkedThis home is ranked 310th out of 705 homes in Ohio. Shows how walkable this facility's neighborhood is compared to the average Walk Score across Ohio facilities. Higher scores benefit residents, families, and staff.Rankings are based only on facilities in Ohio that report data for that category. Facilities without available data are excluded from the ranking.Click the rank badge to see the full State ranking.Click here to see the full State ranking.
Somewhat walkable. A few nearby services may be reachable on foot, but most trips require transportation.

Payment & Insurance

2 services
Accept Medicaid
Accept Medicare

Therapy & Rehabilitation

1 service
Rehabilitation Services

Staffing & Medical

1 service
24-Hour Staffing

Amenities & Lifestyle

Private Rehab Suites
Dining With Menu Selections
Home Style Cooking
Complimentary Cable Tv
Wifi
Laundry
& Housekeeping
Family Party Room
Quiet Country Setting
Lounges & Sun Room For Visiting
Specific ProgramsSpecialized therapies for Sports Injuries, Pre/Post Op Orthopedics, Geriatric Rehab, Fall Prevention, Outings
Operating Hours24/7 direct admissions from the local hospitals.

Contact Divine Rehabilitation and Nursing at Pearlview

Staffing Data

Reporting period: October 1 – December 31, 2025 (Q4 2025). Source: CMS Payroll-Based Journal report.

Total staff 132
Employees 49
Contractors 83
Staff to resident ratio 3.38 : 1
66% more staff per resident than Ohio average
Ohio average ratio: 2.04 : 1 Ohio average ratio: 2.04 : 1See full Ohio ranking
Avg staff/day 21
Average shift 7 hours
14% worse than Ohio average
Ohio average: 8.1 hours Ohio average shift: 8.1 hoursSee full Ohio ranking
Total staff hours (quarter) 13,491

Nursing staff breakdown

Q4 2025 · Oct 1 – Dec 31 More info This data comes from the CMS Payroll-Based Journal report covering October 1 – December 31, 2025.
Registered Nurse

Manages medical care and health needs.

RN Staff Info 27 total: 8 full-time employees and 19 contractors. 27
Average shift length Info Average shift length. Calculated as total hours divided by days worked and average staff per day. 8.8 hours
Licensed Practical Nurse

Assists with medical care and medications.

LPN Staff Info 21 total: 9 full-time employees and 12 contractors. 21
Average shift length Info Average shift length. Calculated as total hours divided by days worked and average staff per day. 8.1 hours
Certified Nursing Assistant

Helps with daily care and mobility.

CNA Staff Info 58 total: 17 full-time employees and 41 contractors. 58
Average shift length Info Average shift length. Calculated as total hours divided by days worked and average staff per day. 6.9 hours

Contractor staffing

Q4 2025 · Oct 1 – Dec 31 More info This data comes from the CMS Payroll-Based Journal report covering October 1 – December 31, 2025.

Total hours from contractors

11.1%

1,492 contractor hours this quarter

Certified Nursing Assistant: 41 Registered Nurse: 19 Licensed Practical Nurse: 12 Physical Therapy Aide: 3 Speech Language Pathologist: 2 Physical Therapy Assistant: 1 Medical Director: 1 Qualified Social Worker: 1 Occupational Therapy Aide: 1 Feeding Assistant: 1 Respiratory Therapy Technician: 1

Staff by category

Q4 2025 · Oct 1 – Dec 31 More info This data comes from the CMS Payroll-Based Journal report covering October 1 – December 31, 2025.
Certified Nursing Assistant1741585,58892100%6.9
Licensed Practical Nurse912212,62892100%8.1
Registered Nurse819272,43292100%8.8
Nurse Practitioner1014776065%8
Other Dietary Services Staff2024417379%5.8
Dental Services Staff2023704650%7.5
Physical Therapy Aide2353316874%4.2
Dietitian1012613740%7
Administrator1012323033%7.7
Clinical Nurse Specialist1011111718%6.5
Feeding Assistant0111041314%8
Occupational Therapy Aide0111041314%8
Medical Director0111002527%4
Speech Language Pathologist123852628%3.3
Qualified Social Worker112834549%1.9
Physical Therapy Assistant112752830%2.7
Respiratory Therapy Technician112561921%2.9
Occupational Therapy Assistant1011333%4.3
58 Certified Nursing Assistant
% of Days 100%
21 Licensed Practical Nurse
% of Days 100%
27 Registered Nurse
% of Days 100%
1 Nurse Practitioner
% of Days 65%
2 Other Dietary Services Staff
% of Days 79%
2 Dental Services Staff
% of Days 50%
5 Physical Therapy Aide
% of Days 74%
1 Dietitian
% of Days 40%
1 Administrator
% of Days 33%
1 Clinical Nurse Specialist
% of Days 18%
1 Feeding Assistant
% of Days 14%
1 Occupational Therapy Aide
% of Days 14%
1 Medical Director
% of Days 27%
3 Speech Language Pathologist
% of Days 28%
2 Qualified Social Worker
% of Days 49%
2 Physical Therapy Assistant
% of Days 30%
2 Respiratory Therapy Technician
% of Days 21%
1 Occupational Therapy Assistant
% of Days 3%

Penalties and fines

Federal penalties imposed by CMS for regulatory violations, including civil money penalties (fines) and denials of payment for new Medicare/Medicaid admissions.

Source: CMS Penalties Database

No penalties in the past 3 years

No civil money penalties or payment denials were reported in the last 3 years.

Quality of care over time

These measures show how residents usually do over time at this home, based on health outcomes and preventive care.

High-risk clinical events score Info A composite score based on pressure ulcers, falls with injury, weight loss, walking ability decline, and activities of daily living decline. 2.9
50% better than Ohio average

Ohio average: 5.8

Functional decline score Info A composite score based on activities of daily living decline, walking ability decline, and incontinence. 7.1
44% better than Ohio average

Ohio average: 12.7

Long-stay resident measures
Significantly above average Ohio avg: 4.7 Info CMS star rating based on long-stay quality measure performance. 5 stars = significantly above average, 1 star = significantly below average.
Need for Help with Daily Activities Increased Info Percent of long-stay residents whose need for help with daily activities has increased 1.0%
85% better than Ohio average

Ohio average: 6.8%

Walking Ability Worsened Info Percent of long-stay residents whose ability to move independently worsened 2.4%
73% better than Ohio average

Ohio average: 8.9%

Low Risk Residents with Bowel/Bladder Incontinence Info Percent of low risk long-stay residents who lose control of their bowels or bladder 17.8%
19% better than Ohio average

Ohio average: 22.0%

Falls with Major Injury Info Percent of long-stay residents experiencing one or more falls with major injury 3.7%
7% worse than Ohio average

Ohio average: 3.4%

High Risk Residents with Pressure Ulcers Info Percent of long-stay high risk residents with pressure ulcers 2.6%
33% better than Ohio average

Ohio average: 3.9%

Urinary Tract Infection Info Percent of long-stay residents with a urinary tract infection 0.0%
100% better than Ohio average

Ohio average: 0.5%

Lost Too Much Weight Info Percent of long-stay residents who lose too much weight 5.0%
20% better than Ohio average

Ohio average: 6.2%

Depressive Symptoms Info Percent of long-stay residents who have depressive symptoms 65.0%
171% worse than Ohio average

Ohio average: 24.0%

Antipsychotic Use Info Percent of long-stay residents who received an antipsychotic medication 7.6%
10% better than Ohio average

Ohio average: 8.4%

Pneumococcal Vaccine Info Percent of long-stay residents assessed and appropriately given the pneumococcal vaccine 96.3%
In line with Ohio average

Ohio average: 92.4%

Influenza Vaccine Info Percent of long-stay residents assessed and appropriately given the seasonal influenza vaccine 100.0%
6% better than Ohio average

Ohio average: 94.5%

Short-stay resident measures
Pneumococcal Vaccine Info Percent of short-stay residents assessed and appropriately given the pneumococcal vaccine 83.5%
7% better than Ohio average

Ohio average: 78.0%

Antipsychotic medication increase Info Percent of short-stay residents who newly received an antipsychotic medication 0.0%
100% better than Ohio average

Ohio average: 1.3%

Breakdown by payment type

Medicare

19% of new residents, usually for short-term rehab.

Typical stay 27 days

Private pay

73% of new residents, often for short stays.

Typical stay 3 - 4 months

Medicaid

8% of new residents, often for long-term daily care.

Typical stay 9 - 10 months

Facility Characteristics

Source: CMS Long-Term Care Facility Characteristics (Data as of Jan 2026)

Total residents 39
Medicare
1
2.6% of residents
Medicaid
29
74.4% of residents
Private pay or other
9
23.1% of residents
Programs & Services
Residents Group

Residents meet regularly to discuss policies, care quality, and activities

Nurse Aide Training

State-approved Nurse Aide Training and Competency Evaluation Program on-site

Active Resident Council

Organized group of residents that meets regularly to discuss facility policies, quality of life, and activities.

Finances and operations

Based on CMS SNF Cost Report for fiscal year ending in 12/2023.

For-profit
Operated by a single business entity.
Net patient revenue Info Net patient revenue — what the home actually collects for resident care, after contractual allowances, bad debt and discounts are subtracted from its gross charges (CMS cost report, Worksheet G-3). It covers resident care only; money the home earns from other sources is shown separately as "Other income."
$4.6M
Net patient income Info Net patient income: net patient revenue minus the home's total operating expenses. A positive figure means it earns more from resident care than it spends to deliver it; a negative figure means the opposite. It excludes non-operating "other income."
-$657.7K
For-profit Operated by a single business entity.
Net patient revenue Info Net patient revenue — what the home actually collects for resident care, after contractual allowances, bad debt and discounts are subtracted from its gross charges (CMS cost report, Worksheet G-3). It covers resident care only; money the home earns from other sources is shown separately as "Other income."
$4.6M Rank #202 / 210Revenue — State benchmarkedThis home is ranked 202nd out of 210 homes in Ohio. Shows this facility's annual revenue compared to the Ohio average. Higher revenue generally means more resources for staffing and capital — read alongside Payroll %.Rankings are based only on facilities in Ohio that report data for that category. Facilities without available data are excluded from the ranking.Click the rank badge to see the full State ranking.Click here to see the full State ranking.
Net patient income Info Net patient income: net patient revenue minus the home's total operating expenses. A positive figure means it earns more from resident care than it spends to deliver it; a negative figure means the opposite. It excludes non-operating "other income."
-$657.7K
Other income Info Money the home earns outside of resident care — such as investments, grants, rentals and other non-operating sources (CMS cost report, Worksheet G-3). It is tracked separately from net patient revenue: it is not part of that figure, and it is not included in net patient income.
$238.3K
Payroll costs Info Staff salaries plus wage-related costs — benefits such as payroll taxes, health insurance and retirement — from the home's own accounting records (CMS cost report, Worksheet A). Contract or agency labor is counted separately, under other operating costs. Rank #190 / 210Payroll — State benchmarkedThis home is ranked 190th out of 210 homes in Ohio. Shows total annual staff payroll benchmarked to the Ohio average. Higher payroll investment relative to peers often signals better staffing and less reliance on cheaper contract labor.Rankings are based only on facilities in Ohio that report data for that category. Facilities without available data are excluded from the ranking.Click the rank badge to see the full State ranking.Click here to see the full State ranking.
$2.7M 58.8% of net patient revenue Info Payroll as a share of revenue: staff salaries and wage-related benefits divided by net patient revenue. A higher figure means more of each revenue dollar goes to staff pay. Rank #9 / 210Payroll % — State benchmarkedThis home is ranked 9th out of 210 homes in Ohio. Shows payroll as a percentage of revenue versus the Ohio average. Well-run Ohio facilities typically land around 54–64% — the top third Statewide. Below 25% may signal understaffing or heavy agency use — read with Staffing ratings.Rankings are based only on facilities in Ohio that report data for that category. Facilities without available data are excluded from the ranking.Click the rank badge to see the full State ranking.Click here to see the full State ranking.
Other operating costs Info Everything it costs to run the home apart from payroll — food, utilities, supplies, maintenance, contract labor and administration. Calculated as total operating expense minus payroll (staff salaries and wage-related benefits).
$2.6M
Total costs Info The home's total operating expense for the year — all the costs of running it, salaries included (CMS cost report, Worksheet G-3).
$5.3M

What does this home offer?

Housing options icon

Housing Options: Private Suites

Building type icon
Building type icon

Building Type: 2-story

Beauty services icon

Beauty Services

Housekeeping icon
Housekeeping icon

Housekeeping Services

Recreational activities icon

Recreational Activities

Exercise program icon

Exercise Programs

Who this home usually serves

TYPE OF STAY

Primarily short stays

Residents typically stay for brief periods, with frequent admissions and discharges throughout the year.

Most new residents arrive under private pay (73% of admissions), and a typical private pay stay runs around 3 - 4 months.

Admissions
151 total

Coverage residents most often arrive under.

Medicare 19%
Private pay 73%
Medicaid 8%
Discharges
169 total

Coverage residents most often leave under.

Medicare 12%
Private pay 76%
Medicaid 11%

Places of interest near Divine Rehabilitation and Nursing at Pearlview

Address 1.0 miles from city center Info Estimated distance in miles from Brunswick's city center to Divine Rehabilitation and Nursing at Pearlview's address, calculated via Google Maps.

Calculate Travel Distance to Divine Rehabilitation and Nursing at Pearlview

Add your location

Address

Frequently Asked Questions about Divine Rehabilitation and Nursing at Pearlview

Is Divine Rehabilitation and Nursing at Pearlview in a walkable area?

Divine Rehabilitation and Nursing at Pearlview has a walk score of 45. Somewhat walkable. A few nearby services may be reachable on foot, but most trips require transportation.

What is the occupancy rate at Divine Rehabilitation and Nursing at Pearlview?

Divine Rehabilitation and Nursing at Pearlview's occupancy is 62.8%.

Does Divine Rehabilitation and Nursing at Pearlview operate as a for-profit or non-profit?

Divine Rehabilitation and Nursing at Pearlview is registered as a for-profit.

Are there photos of Divine Rehabilitation and Nursing at Pearlview?

Yes — there are 5 photos of Divine Rehabilitation and Nursing at Pearlview in the photo gallery on this page.

What is the address of Divine Rehabilitation and Nursing at Pearlview?

Divine Rehabilitation and Nursing at Pearlview is located at 4426 Homestead Dr, Brunswick, OH 44212.

What is the phone number of Divine Rehabilitation and Nursing at Pearlview?

(330) 225-9121 will put you in contact with the team at Divine Rehabilitation and Nursing at Pearlview.

Is Divine Rehabilitation and Nursing at Pearlview Medicare or Medicaid certified?

Yes — Divine Rehabilitation and Nursing at Pearlview is a CMS-certified provider of Medicare and Medicaid.

Guides for Better Senior Living

Care Cost Calculator: See Prices in Your Area

Nursing Home Data Explorer

Don’t Wait Too Long: 7 Red Flag Signs Your Parent Needs Assisted Living Now

The True Cost of Assisted Living in 2025 – And How Families Are Paying For It

Understanding Senior Living Costs: Pricing Models, Discounts & Financial Assistance