East Longmeadow Memory Care Assisted Living
Nursing Home · Springfield, MA
CMS overall rating Info The Overall CMS Rating is scored from 1 to 5 stars and combines results from health inspections, staffing levels, and quality measures. Health inspections carry the most weight. Staffing and quality scores can increase or decrease the final rating based on performance compared to state and national standards.

East Longmeadow Memory Care Assisted Living

Nursing Home · Springfield, MA
CMS overall rating Info The Overall CMS Rating is scored from 1 to 5 stars and combines results from health inspections, staffing levels, and quality measures. Health inspections carry the most weight. Staffing and quality scores can increase or decrease the final rating based on performance compared to state and national standards.
Calculator: See prices in your area
East Longmeadow Memory Care Assisted Living accepts Medicare, Medicaid, and private pay.

Overview of East Longmeadow Memory Care Assisted Living

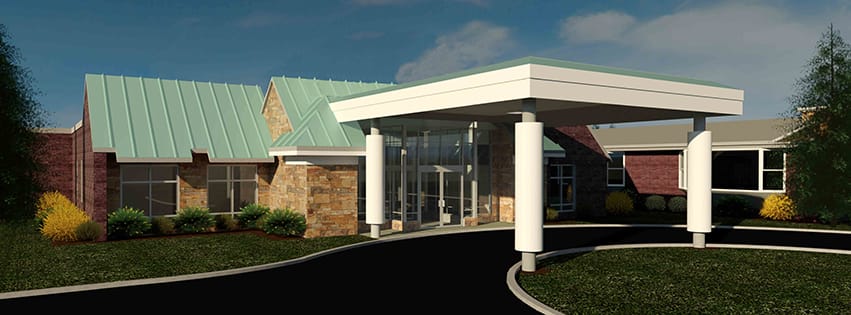
East Longmeadow Memory Care Assisted Living residence unfolds as a beautifully renovated haven in Massachusetts, devoted to providing unwavering care day after day. With its intimate setting of 20 specialized memory care units, this community stands as a testament to the art of holistic memory care, embracing residents within an engaging and inclusive environment. Skilled nursing and rehabilitation services stand poised to provide short-term care and support, while specialist memory care ensures personalized attention that honors each resident’s unique journey. Convenient local transportation stands ready to whisk residents away to appointments, ensuring seamless access to essential services.
The home boasts a vibrant tapestry of enriching activities, ranging from the creative allure of arts and crafts to invigorating exercise classes, captivating movies, therapeutic encounters, and intergenerational connections that foster profound bonds. As residents gather around the dining table, it is not just sustenance they savor, but a harmonious blend of nutrition and culinary delight, tailored to their individual preferences. With their steadfast commitment to fostering a genuine sense of belonging, this not-for-profit community offers a transparent experience, accompanied by a one-time assessment fee that underscores their unwavering dedication to the well-being and happiness of every resident.

(413) 525-6361

Quality ratings

Measured by Centers for Medicare & Medicaid Services (CMS)

Overall rating Info The Overall CMS Rating combines results from health inspections, staffing levels and quality measures. Health inspections carry the most weight. Staffing and quality scores can increase or decrease the final rating based on performance compared to state and national standards.
▲ 24.6% Above MA avg. ▲ 24.6% Above MA avg.Click the badge to see the full State ranking.Click here to see the full State ranking.
Health Inspection Info Based on the results of the facility's three most recent standard inspections and any complaint investigations. CMS reviews the number, scope, and severity of deficiencies, with more recent findings weighted more heavily.
▲ 33.3% Above MA avg. ▲ 33.3% Above MA avg.Click the badge to see the full State ranking.Click here to see the full State ranking.
Staffing Info Measures average nursing staff hours per resident per day, including Registered Nurses (RNs) and total nursing staff. Ratings are adjusted based on the level of care residents require and are compared to state and national benchmarks.
▼ 12.5% Below MA avg. ▼ 12.5% Below MA avg.Click the badge to see the full State ranking.Click here to see the full State ranking.
Quality Measures Info Based on clinical and physical health indicators reported to CMS, such as hospital readmissions, falls, pressure ulcers, and improvements in mobility. These measures reflect how well residents' health needs are being managed.
▼ 8.8% Below MA avg. ▼ 8.8% Below MA avg.Click the badge to see the full State ranking.Click here to see the full State ranking.

Staffing hours breakdown

Info Daily nursing hours per resident by staff type, reported to CMS. Higher is generally better — compare this facility to state and national averages to see where staffing stands.

Hours per resident per day — compared to Massachusetts state averages

Total nursing care / resident Info This home is ranked 48th out of 89 homes in Massachusetts. Total adjusted nursing hours per resident per day, combining RN, LPN, and aide time. CMS adjusts this for case-mix so facilities can be fairly compared.
3h 51m per day
Rank #48 / 89Nurse hours — State benchmarkedThis home is ranked 48th out of 89 homes in Massachusetts. Shows adjusted nurse hours per resident per day benchmarked to the Massachusetts average, with a ranking across 89 Massachusetts SNFs. More hours mean more direct care. The national average is about 3.5 hrs; below 3.0 is a red flag.Click the rank badge to see the full State ranking.Click here to see the full State ranking.
This facility Massachusetts avg (4h 18m per day)
vs Massachusetts avg
-11%
Staff typeHours / Day / Residentvs state avg
Weekend Total Nursing Info Combined nursing hours (RN + LPN + Nurse Aide) per resident per day on weekends. Staffing often drops on weekends — this figure reveals whether the facility maintains adequate coverage outside of weekday hours. 3h 26m per day

Capacity and availability

This home is often near full

Occupancy higher than 95% suggests steady demand, but availability may be limited.

Higher occupancy than the Massachusetts average: 82%
Occupancy rate 96.5% Rank #6 / 91Occupancy rate — State benchmarkedThis home is ranked 6th out of 91 homes in Massachusetts. Shows this facility's occupancy rate versus the Massachusetts average, with its Statewide rank out of 91. Higher occupancy signals strong local demand and financial stability.Click the rank badge to see the full State ranking.Click here to see the full State ranking.
Avg. Length of Stay 92 days
Occupancy rate
96.5% Rank #6 / 91Occupancy rate — State benchmarkedThis home is ranked 6th out of 91 homes in Massachusetts. Shows this facility's occupancy rate versus the Massachusetts average, with its Statewide rank out of 91. Higher occupancy signals strong local demand and financial stability.Click the rank badge to see the full State ranking.Click here to see the full State ranking.
Avg. Length of Stay
92 days
Bed community size
20-bed community Rank #93 / 93Bed count — State benchmarkedThis home is ranked 93rd out of 93 homes in Massachusetts. Shows this facility's certified or reported bed count compared to other Massachusetts SNFs. Larger communities may offer more amenities, programs, and on-site services for residents and families.Click the rank badge to see the full State ranking.Click here to see the full State ranking.
A smaller, more intimate setting that may offer a quieter environment and closer staff-resident interactions.
Walk Score
Walk Score: 20 / 100 Rank #78 / 93Walk Score — State benchmarkedThis home is ranked 78th out of 93 homes in Massachusetts. Shows how walkable this facility's neighborhood is compared to the average Walk Score across Massachusetts SNFs. Higher scores benefit residents, families, and staff.Click the rank badge to see the full State ranking.Click here to see the full State ranking.
Car-dependent. Most errands require a car, with limited nearby walkable options.

About this community

Ownership & Operating Entity

Nonprofit OwnershipNo

Type Of Units

Special Care
20 units
Total beds
20 units

Therapy & Rehabilitation

1 service
Rehabilitation Services

Additional Services

1 service
Skilled Nursing And Rehabilitation

Dining & Nutrition

Food DescriptionAll-Inclusive Memory Care with meals provided.

Contact East Longmeadow Memory Care Assisted Living

Health Inspection History

Inspections since 2022
Total health inspections 3

Massachusetts average 4.5


Last Health inspection on Jul 2025

Total health citations
30 Rank #52 / 89Health citations — State benchmarkedThis home is ranked 52nd out of 89 homes in Massachusetts. Shows this facility's total health deficiency citations benchmarked to the Massachusetts State average, with a ranking across all 89 MA SNFs. Lower citation counts earn a better rank.Click the rank badge to see the full State ranking.Click here to see the full State ranking.

Massachusetts average 32.7

Citations per inspection
10 Rank #77 / 89Citations per inspection — State benchmarkedThis home is ranked 77th out of 89 homes in Massachusetts. Shows average deficiency citations per CMS inspection for this facility versus the Massachusetts mean across 89 SNFs with citation data. Lower is better.Click the rank badge to see the full State ranking.Click here to see the full State ranking.

Massachusetts average 7.24


Health citations are formal notices following inspections when they fail to comply with safety and care standards.

All 30 citations resulted from standard inspections.

Breakdown of citation severity (last 4 years)
Critical Health citations
0
100% better than Massachusetts average

Massachusetts average: 0.3


Serious Health citations
0
100% better than Massachusetts average

Massachusetts average: 1.5

0 critical citations Massachusetts average: 0.3

0 serious citations Massachusetts average: 1.5

28 moderate citations Massachusetts average: 29.7

2 minor citations Massachusetts average: 1.3
Citations history (last 4 years)
Abuse/Neglect moderate citation Jul 22, 2025
Corrected

Infection Control moderate citation Jul 22, 2025
Corrected

Pharmacy moderate citation Jul 22, 2025
Corrected

Quality of Care moderate citation Jul 22, 2025
Corrected

Staffing Data

Reporting period: October 1 – December 31, 2025 (Q4 2025). Source: CMS Payroll-Based Journal report.

Total staff 288
Employees 166
Contractors 122
Staff to resident ratio 2.23:1
31% better than Massachusetts average
Massachusetts average ratio: 1.70:1 Massachusetts average ratio: 1.70:1See full Massachusetts ranking
Avg staff/day 79
Average shift 7.7 hours
0% compared with Massachusetts average
Massachusetts average: 7.9 hours Massachusetts average shift: 7.9 hoursSee full Massachusetts ranking
Total staff hours (quarter) 55,795

Nursing staff breakdown

Q4 2025 · Oct 1 – Dec 31 More info This data comes from the CMS Payroll-Based Journal report covering October 1 – December 31, 2025.
Registered Nurse

Manages medical care and health needs.

RN Staff 29
Average shift length Info Average shift length. Calculated as total hours divided by days worked and average staff per day. 7.9 hours

This role is partially covered by contractors.

Licensed Practical Nurse

Assists with medical care and medications.

LPN Staff 53
Average shift length Info Average shift length. Calculated as total hours divided by days worked and average staff per day. 8.5 hours

This role is partially covered by contractors.

Certified Nursing Assistant

Helps with daily care and mobility.

CNA Staff 161
Average shift length Info Average shift length. Calculated as total hours divided by days worked and average staff per day. 7.4 hours

This role is partially covered by contractors.

Contractor staffing

Q4 2025 · Oct 1 – Dec 31 More info This data comes from the CMS Payroll-Based Journal report covering October 1 – December 31, 2025.

Total hours from contractors

14%

7,799 contractor hours this quarter

Certified Nursing Assistant: 58 Licensed Practical Nurse: 28 Registered Nurse: 16 Respiratory Therapy Technician: 7 Physical Therapy Assistant: 4 Qualified Social Worker: 4 Speech Language Pathologist: 3 Physical Therapy Aide: 2

Staff by category

Q4 2025 · Oct 1 – Dec 31 More info This data comes from the CMS Payroll-Based Journal report covering October 1 – December 31, 2025.
Certified Nursing Assistant1035816127,85892100%7.4
Licensed Practical Nurse25285311,02692100%8.5
Registered Nurse1316293,63492100%7.9
Clinical Nurse Specialist6063,3158795%8.5
Other Dietary Services Staff9091,76492100%6.3
RN Director of Nursing3031,4337076%7.6
Physical Therapy Assistant0441,0287076%7.6
Physical Therapy Aide0229166672%7.7
Dietitian2028746470%7.8
Mental Health Service Worker2027946267%7.8
Respiratory Therapy Technician0776976773%5.7
Speech Language Pathologist0336926773%7
Qualified Social Worker0445166975%7.2
Nurse Practitioner1014966267%8
Administrator1014485661%8
Occupational Therapy Aide1013065155%6
161 Certified Nursing Assistant
% of Days 100%
53 Licensed Practical Nurse
% of Days 100%
29 Registered Nurse
% of Days 100%
6 Clinical Nurse Specialist
% of Days 95%
9 Other Dietary Services Staff
% of Days 100%
3 RN Director of Nursing
% of Days 76%
4 Physical Therapy Assistant
% of Days 76%
2 Physical Therapy Aide
% of Days 72%
2 Dietitian
% of Days 70%
2 Mental Health Service Worker
% of Days 67%
7 Respiratory Therapy Technician
% of Days 73%
3 Speech Language Pathologist
% of Days 73%
4 Qualified Social Worker
% of Days 75%
1 Nurse Practitioner
% of Days 67%
1 Administrator
% of Days 61%
1 Occupational Therapy Aide
% of Days 55%

Penalties and fines

Federal penalties imposed by CMS for regulatory violations, including civil money penalties (fines) and denials of payment for new Medicare/Medicaid admissions.

Source: CMS Penalties Database

No penalties in the past 3 years

No civil money penalties or payment denials were reported in the last 3 years.

Quality of care over time

These measures show how residents usually do over time at this home, based on health outcomes and preventive care.

High-risk clinical events score Info A composite score based on pressure ulcers, falls with injury, weight loss, walking ability decline, and activities of daily living decline. 13.1
28% worse than Massachusetts average

Massachusetts average: 10.2

Functional decline score Info A composite score based on activities of daily living decline, walking ability decline, and incontinence. 27.1
36% worse than Massachusetts average

Massachusetts average: 20.0

Long-stay resident measures
Need for Help with Daily Activities Increased Info Percent of long-stay residents whose need for help with daily activities has increased 22.7%
22% worse than Massachusetts average

Massachusetts average: 18.7%

Walking Ability Worsened Info Percent of long-stay residents whose ability to move independently worsened 26.9%
39% worse than Massachusetts average

Massachusetts average: 19.3%

Low Risk Residents with Bowel/Bladder Incontinence Info Percent of low risk long-stay residents who lose control of their bowels or bladder 31.7%
43% worse than Massachusetts average

Massachusetts average: 22.1%

Falls with Major Injury Info Percent of long-stay residents experiencing one or more falls with major injury 2.3%
37% better than Massachusetts average

Massachusetts average: 3.6%

High Risk Residents with Pressure Ulcers Info Percent of long-stay high risk residents with pressure ulcers 6.8%
47% worse than Massachusetts average

Massachusetts average: 4.7%

Urinary Tract Infection Info Percent of long-stay residents with a urinary tract infection 1.3%
39% better than Massachusetts average

Massachusetts average: 2.1%

Lost Too Much Weight Info Percent of long-stay residents who lose too much weight 6.8%
32% worse than Massachusetts average

Massachusetts average: 5.2%

Depressive Symptoms Info Percent of long-stay residents who have depressive symptoms 11.7%
10% worse than Massachusetts average

Massachusetts average: 10.7%

Antipsychotic Use Info Percent of long-stay residents who received an antipsychotic medication 17.6%
13% better than Massachusetts average

Massachusetts average: 20.3%

Pneumococcal Vaccine Info Percent of long-stay residents assessed and appropriately given the pneumococcal vaccine 98.2%
7% better than Massachusetts average

Massachusetts average: 91.9%

Influenza Vaccine Info Percent of long-stay residents assessed and appropriately given the seasonal influenza vaccine 97.3%
In line with Massachusetts average

Massachusetts average: 94.8%

Short-stay resident measures
Pneumococcal Vaccine Info Percent of short-stay residents assessed and appropriately given the pneumococcal vaccine 92.2%
20% better than Massachusetts average

Massachusetts average: 76.7%

Antipsychotic medication increase Info Percent of short-stay residents who newly received an antipsychotic medication 1.9%
44% worse than Massachusetts average

Massachusetts average: 1.3%

Influenza Vaccine Info Percent of short-stay residents assessed and appropriately given the seasonal influenza vaccine 90.5%
16% better than Massachusetts average

Massachusetts average: 77.7%

Breakdown by payment type

Medicare

57% of new residents, usually for short-term rehab.

Typical stay 20 days

Private pay

33% of new residents, often for short stays.

Typical stay 1 - 2 months

Medicaid

10% of new residents, often for long-term daily care.

Typical stay 1 - 2 years

Facility Characteristics

Source: CMS Long-Term Care Facility Characteristics (Data as of Jan 2026)

Total residents 129
Medicare
13
10.1% of residents
Medicaid
63
48.8% of residents
Private pay or other
53
41.1% of residents
Programs & Services
Residents Group

Residents meet regularly to discuss policies, care quality, and activities

Active Resident Council

Organized group of residents that meets regularly to discuss facility policies, quality of life, and activities.

Finances and operations

Voluntary non-profit community
Home revenue
$29.0M
Operating deficit
-$1.1M
Voluntary non-profit community
Home revenue
$29.0M Rank #18 / 92Revenue — State benchmarkedThis home is ranked 18th out of 92 homes in Massachusetts. Shows this facility's annual revenue compared to the Massachusetts SNF average. Higher revenue generally means more resources for staffing and capital — read alongside Payroll %.Click the rank badge to see the full State ranking.Click here to see the full State ranking.
Operating deficit
-$1.1M
Payroll costs Info The portion of the home's budget spent on staff, including nurses, caregivers, and other employees who support care and operations. Rank #31 / 92Payroll — State benchmarkedThis home is ranked 31st out of 92 homes in Massachusetts. Shows total annual staff payroll benchmarked to the Massachusetts average. Higher payroll investment relative to peers often signals better staffing and less reliance on cheaper contract labor.Click the rank badge to see the full State ranking.Click here to see the full State ranking.
$11.5M
39.6% of revenue Rank #83 / 92Payroll % — State benchmarkedThis home is ranked 83rd out of 92 homes in Massachusetts. Shows payroll as a percentage of revenue versus the Massachusetts average. Well-run Massachusetts SNFs typically land around 54–65% — the top third Statewide. Below 25% may signal understaffing or heavy agency use — read with Staffing ratings.Click the rank badge to see the full State ranking.Click here to see the full State ranking.
Other operating costs Info All remaining costs needed to run the home, such as food, utilities, building maintenance, supplies and administrative expenses.
$18.6M
Total costs $30.1M

Who this home usually serves

TYPE OF STAY

Mostly short-term rehab stays

Most residents typically stay for a few weeks or months before returning home or moving on.

Places of interest near East Longmeadow Memory Care Assisted Living

Address 1.2 miles from city center Info Estimated distance in miles from East Longmeadow's city center to East Longmeadow Memory Care Assisted Living's address, calculated via Google Maps. — 4.79 miles to nearest hospital (Mercy Medical Center)

Calculate Travel Distance to East Longmeadow Memory Care Assisted Living

Add your location

Address

Financial Assistance for
Nursing Home in Massachusetts

East Longmeadow Memory Care Assisted Living is located in East Longmeadow, Massachusetts.
Here are the financial assistance programs available to residents in Massachusetts.

Get Financial aid guidance

Home Care Program

MassHealth Home Care

Age 60+
General Massachusetts resident, at risk of nursing home placement.
Income Limits (2025) ~$1,500/month individual, varies by region
Asset Limits $2,000 individual, excludes home, car
MA

Coordinated through Aging Services Access Points (ASAPs); high demand in urban areas.

Benefits
In-home care (3-5 hours/day) Homemaker services Respite care (up to 14 days/year) Adult day care (~$75/day)

Frail Elder Waiver

Massachusetts Medicaid FE Waiver

Age 65+
General Massachusetts resident, Medicaid-eligible, nursing home-level care need.
Income Limits (2025) ~$2,829/month 300% FBR, individual
Asset Limits $2,000 (individual), $3,000 (couple).
MA

Requires clinical eligibility determination.

Benefits
Personal care (5-7 hours/day) Respite care (240 hours/year) Adult day care (~$75/day) Home health services

Senior Care Options (SCO)

Massachusetts Senior Care Options

Age 65+
General Massachusetts resident, eligible for MassHealth (Medicare optional), nursing home-level care need.
Income Limits (2025) ~$2,829/month (300% FBR, individual); QIT allowed.
Asset Limits $2,000 (individual), $3,000 (couple) (excludes home up to $713,000, car).
MA

Not available in Dukes/Nantucket Counties; multiple SCO providers (e.g., CCA, Tufts).

Benefits
Personal care (5-7 hours/day) Medical care Respite (240 hours/year) Adult

Medicare Savings Program (MSP)

Massachusetts Medicare Savings Program (MassHealth Buy-In)

Age 65+ or disabled
General Massachusetts resident, Medicare Part A/B.
Income Limits (2025) ~$2,510/month (QMB), ~$3,380/month (SLMB), ~$3,598/month (QI)—individual.
Asset Limits $9,430 (individual), $14,130 (couple).
MA

Three tiers; no waitlist; includes Extra Help for Part D.

Benefits
Covers Part B premiums ($174.70/month) Deductibles ($240/year) Copays (~20%)

National Family Caregiver Support Program (NFCSP) Respite

Massachusetts NFCSP Respite Care

Age
General Caregivers of 60+ needing care or 55+ caregivers of others; Massachusetts resident; functional needs (2+ ADLs).
Income Limits (2025) Prioritizes ~$24,980/year (individual); no strict cap.
Asset Limits Not assessed; need-based.
MA

27 ASAPs; prioritizes low-income, rural caregivers.

Benefits
Respite (4-6 hours/week or 5 days/year) Adult day care ($60/day) Caregiver training Supplies (~$500/year)

Prescription Advantage

Massachusetts Prescription Advantage

Age 65+ or disabled
General Massachusetts resident, enrolled in Medicare Part D (or ineligible for Medicare).
Income Limits (2025) No strict limit; copays vary by income ~$24,980-$75,000/year individual
Asset Limits Not assessed.
MA

Supplements Medicare Part D; no enrollment fee for low-income.

Benefits
Covers prescription copays ($5-$40/drug) Fills coverage gaps Catastrophic cost protection ($4,000+ covered)

VA Aid and Attendance (A&A) and Housebound Benefits

Massachusetts VA Aid and Attendance/Housebound

Age 65+ or disabled veteran/spouse
General Massachusetts resident, wartime service, need for ADL help (A&A) or homebound.
Income Limits (2025) Net income < ~$1,984/month (veteran with dependent, A&A); pension offsets income.
Asset Limits ~$155,356 net worth limit
MA

High veteran demand statewide.

Benefits
Cash (~$1,433-$2,642/month veteran, ~$951-$1,318 spouse) for care costs (e.g., in-home, assisted living)

Frequently Asked Questions about East Longmeadow Memory Care Assisted Living

Is East Longmeadow Memory Care Assisted Living in a walkable area?

East Longmeadow Memory Care Assisted Living has a walk score of 20. Car-dependent. Most errands require a car, with limited nearby walkable options.

Does East Longmeadow Memory Care Assisted Living have different floorplan options?

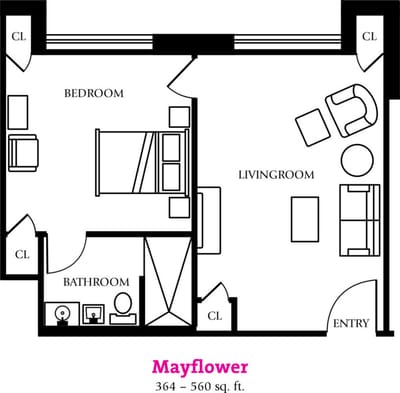
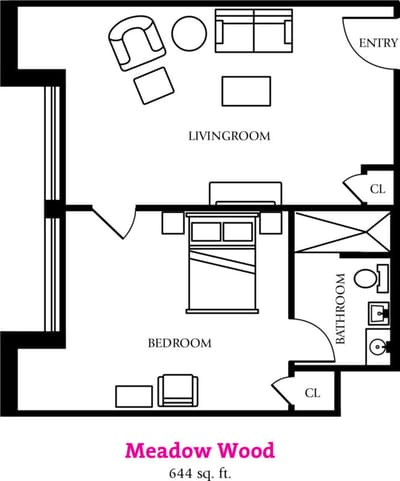
Yes — see the floorplan options available at East Longmeadow Memory Care Assisted Living on this page.

Does East Longmeadow Memory Care Assisted Living operate as a for-profit or non-profit?

East Longmeadow Memory Care Assisted Living is registered as a for-profit in MA.

How many beds does East Longmeadow Memory Care Assisted Living have?

East Longmeadow Memory Care Assisted Living has 20 beds.

Are there photos of East Longmeadow Memory Care Assisted Living?

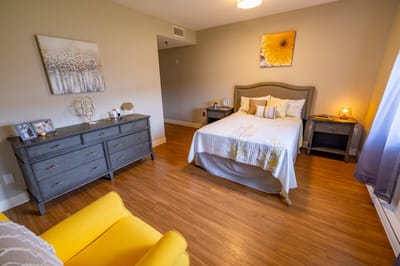
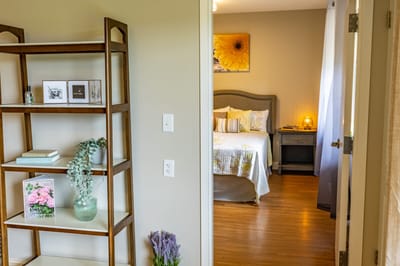
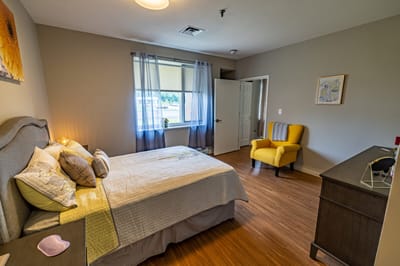
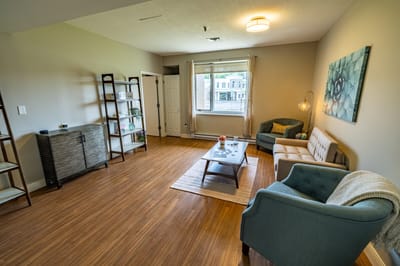
Yes — there are 12 photos of East Longmeadow Memory Care Assisted Living in the photo gallery on this page.

What is the phone number of East Longmeadow Memory Care Assisted Living?

(413) 525-6361 will put you in contact with the team at East Longmeadow Memory Care Assisted Living.

Is East Longmeadow Memory Care Assisted Living Medicare or Medicaid certified?

Yes — East Longmeadow Memory Care Assisted Living is a CMS-certified provider of Medicare and Medicaid.

Guides for Better Senior Living

Care Cost Calculator: See Prices in Your Area

Nursing Home Data Explorer

Don’t Wait Too Long: 7 Red Flag Signs Your Parent Needs Assisted Living Now

The True Cost of Assisted Living in 2025 – And How Families Are Paying For It

Understanding Senior Living Costs: Pricing Models, Discounts & Financial Assistance

Explore Open Rooms
1 Contact details
2 What type of senior care service are you looking for?
3 What budget do you have in mind for senior care?
4 How soon do you need to find care?
5 Additional details

Thank you for your interest!

Our team will be in touch shortly to help with next steps.