Nursing Home

Ebony Lake Nursing and Rehabilitation Center

Nursing Home

Ebony Lake Nursing and Rehabilitation Center

1001 Central Blvd, Brownsville, TX 78520 View map
Overview of Ebony Lake Nursing and Rehabilitation Center

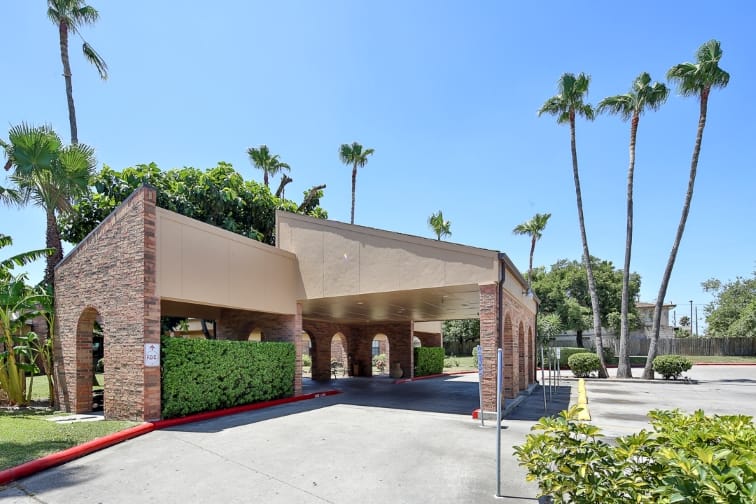
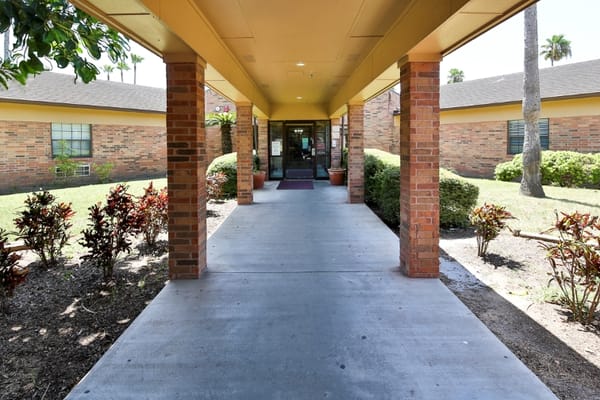
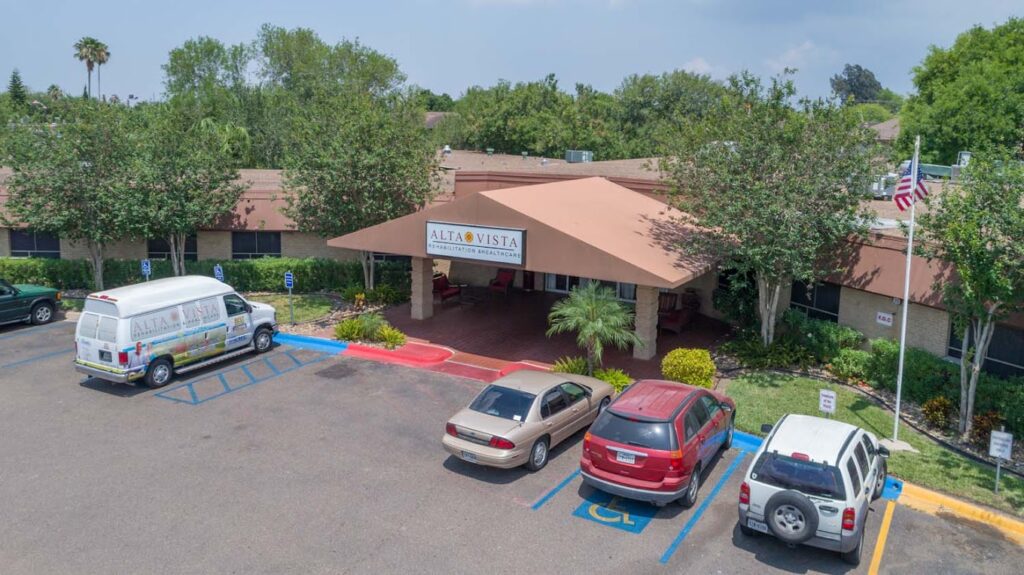
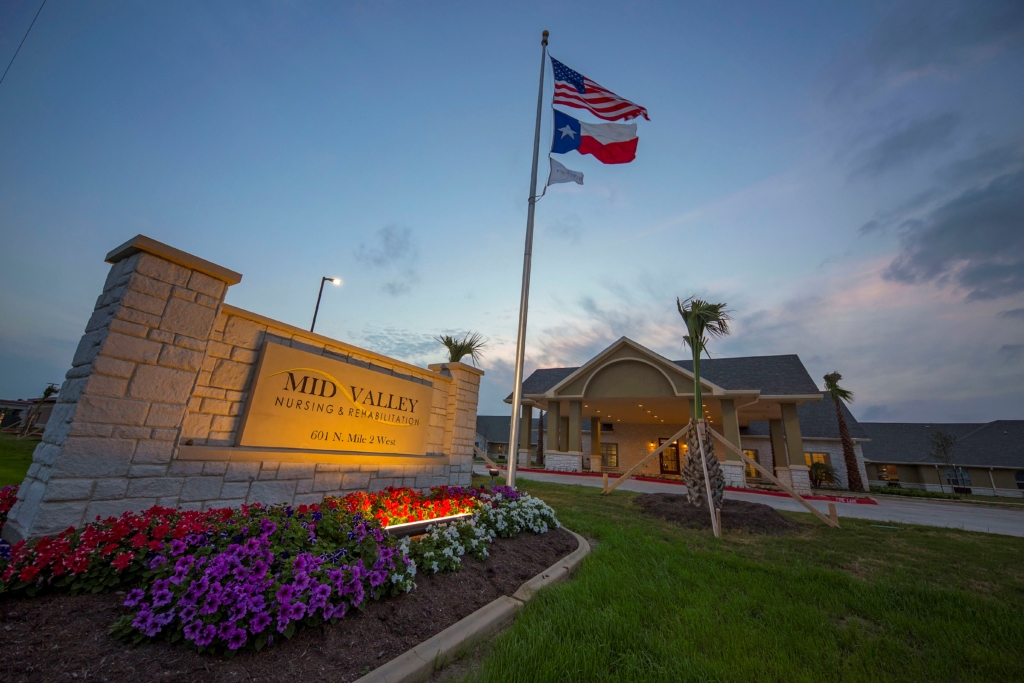
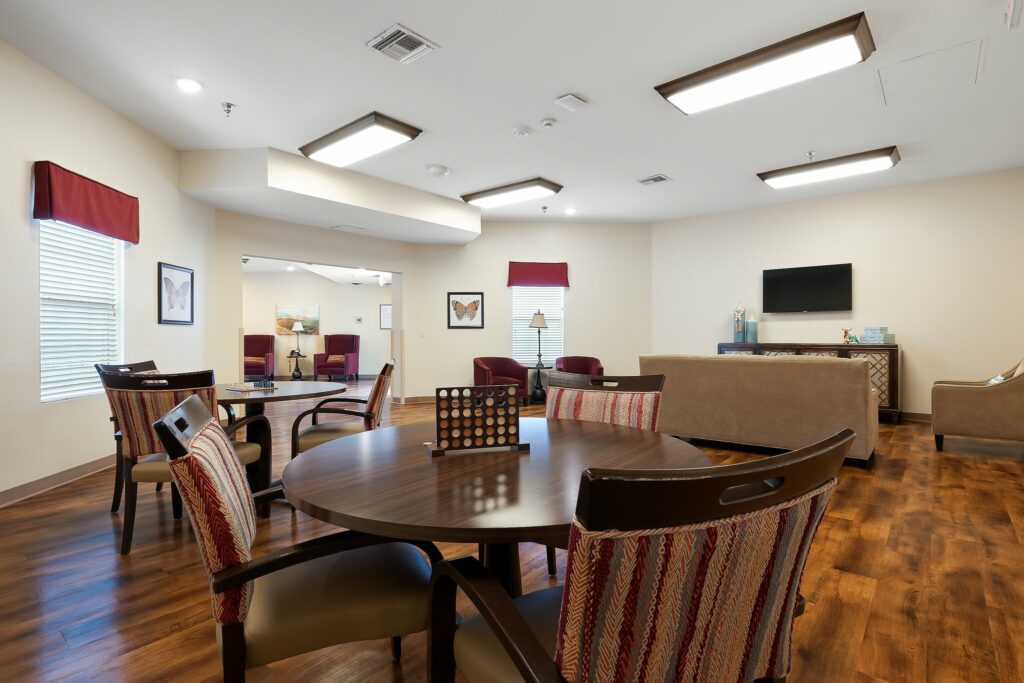
Burrowed in the peaceful town of Brownsville, TX, Ebony Lake Nursing and Rehabilitation Center is a dedicated senior living community offering skilled nursing, memory care, therapy and rehabilitation, hospice and palliative care, and home health services. A wide array of spacious and comfortable accommodations with several floor plans are available for its residents based on their preferences. With a highly skilled and compassionate team, the community ensures that its residents are given with round-the-clock utmost care and and support.

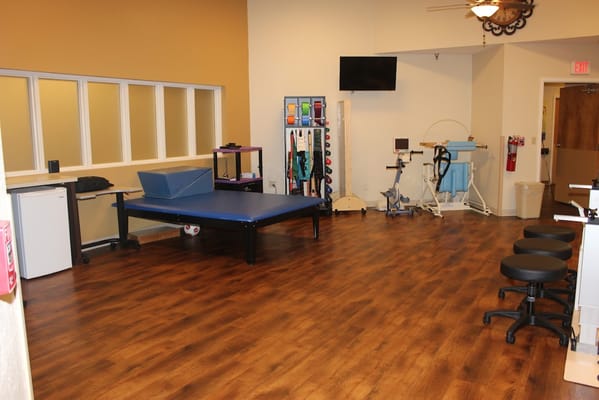
Having top-tier care and services focused on physical and mental health, residents can receive cardiac, care, diabetes care and management and stroke care for skilled nursing. As for therapy and rehabilitation, aquatic therapy, occupation therapy, physical therapy, and speech therapy are some of the services being offered. Equipped with the right tools and people, seniors can enjoy worry-free care and support with Ebony Lake Nursing and Rehabilitation Center.

(956) 541-0917

Quality ratings

Measured by Centers for Medicare & Medicaid Services (CMS)

Overall rating Info Official CMS rating based on health inspections, staffing and quality measures.
3/5
Texas average: 3.0/5
Health Inspection Info Official CMS rating based on deficiencies found during state health inspections.
4/5
Texas average: 2.9/5
Staffing Info Official CMS rating based on nurse staffing hours per resident per day.
1/5
Texas average: 2.4/5
Quality Measures Info Official CMS rating based on clinical outcomes for residents.
4/5
Texas average: 4.0/5

Nursing care per resident

Info Average daily nursing hours per resident (adjusted for acuity). Higher values indicate more nursing time per resident.
2h 59m per day

This home provides 21% less nursing time per resident than the Texas average.

Texas average: 3h 46m per day

Staffing hours breakdown

Info Hours of care per resident per day, broken down by staff type. Data from CMS Medicare.
Staff type Facility State avg National avg
Registered Nurse (RN) Info Registered nurse hours per resident per day. 17m per day 21m per day 29m per day

Capacity and availability

Medium-capacity home

Offers a balance of services and community atmosphere.

Total beds 122

This home usually has availability

Lower occupancy suggests more openings may be available.

Lower demand than the Texas average
Occupancy rate 59.3%
Residents per day (avg) 88
Occupancy rate
59.3%
Residents per day (avg)
88

Who this home usually serves

TYPE OF STAY

Mix of rehab and long-term care

This home supports both short-term rehab and long-term care, with residents staying for a wide range of durations.

Breakdown by payment type

Medicare

26% of new residents, usually for short-term rehab.

Typical stay 1 - 2 months

Private pay

58% of new residents, often for short stays.

Typical stay 1 - 2 months

Medicaid

16% of new residents, often for long-term daily care.

Typical stay 3 years

Finances and operations

Privately-owned community
Home revenue
$7.3M
Operating loss
-$818.0K
Privately-owned community
Home revenue
$7,280,885.00
Operating loss
$-817,953.00
Payroll costs Info The portion of the home's budget spent on staff, including nurses, caregivers, and other employees who support care and operations.
$2.8M
38.9% of revenue
Other operating costs Info All remaining costs needed to run the home, such as food, utilities, building maintenance, supplies and administrative expenses.
$5.3M
Total costs $8.1M
Bed community size
122-bed community
A larger shared setting that may offer more common spaces and organized community services.
Years in operation
37 years in operation
A longer operating history, which may indicate experience navigating regulations and delivering ongoing care.
Walk Score
Walk Score: 63 / 100
Moderately walkable. Some errands can be accomplished on foot, with a mix of nearby amenities.

Services

Medicare/medicaid

About this community

License details

Facility type
Nursing
Status Active
Issuance January 4, 2025
Expiration January 4, 2028
County: CAMERON

Additional licensing details

License number: 308572
Year opened: 7/12/1988

Ownership & operating entity

Ebony Lake Nursing and Rehabilitation Center is administrated by NANETTE D SPEAR.

Management company: REGENCY IHS OF EBONY LAKE, LLC
Owner: VAL VERDE COUNTY HOSPITAL DISTRICT
Ownership type: HOSPITAL DISTRICT/AUTHORITY

Type Of Units

Medicare
4 units
Medicaid and Medicare
118 units
Total beds
122 units

Staffing

Key information about the people who lead and staff this community.

Leadership

Administrator email: [email protected]

What does this home offer?

Accepts Medicaid icon

Accept Medicaid: Yes

Total residents icon

Total Residents: 122

Building type icon
Building type icon

Building Type: Single-story

Transportation services icon

Transportation Services

Types of Care at Ebony Lake Nursing and Rehabilitation Center

Nursing Home
Contact Ebony Lake Nursing and Rehabilitation Center

Health Inspection History

Inspections
Total health inspections 6

Texas average 7.4


Last Health inspection on Sep 2025

Total health citations 15
Citations per inspection
2.5

Health citations are formal notices following inspections when they fail to comply with safety and care standards.

9 of 15 citations resulted from standard inspections; 5 of 15 resulted from complaint investigations; and 1 of 15 came from combined inspections (standard and complaint).

Breakdown of citation severity (last 3 years)
Critical Health citations More info 0
100% better than Texas average

Texas average: 2


Serious Health citations More info 0
100% better than Texas average

Texas average: 0.4

0 critical citations More info Texas average: 2

0 serious citations More info Texas average: 0.4

15 moderate citations More info Texas average: 23

0 minor citations More info Texas average: 0.4
Citations history (last 3 years)
Care Planning moderate citation Sep 18, 2025
Corrected

Resident Rights moderate citation Sep 18, 2025
Corrected

Pharmacy moderate citation May 13, 2025
Corrected

Care Planning moderate citation May 13, 2025
Corrected

Compare Nursing Homes around Cameron County

The information below is reported by the Texas Health and Human Services Commission.
Veranda Rehabilitation and Healthcare
SNF

Nursing Homes 24/7 care needed

Harlingen
100
33
HARLINGEN HEALTHCARE, INC.
81.2%
$13,876,974.00
$5,022,875.00
36.2%
86.50
5/5
2.9604
4/5
2/5
5/5
1
12
1
-31%
-18%
+28%
Ebony Lake Nursing and Rehabilitation Center
SNF

Nursing Homes 24/7 care needed

Brownsville
122
63
REGENCY IHS OF EBONY LAKE LLC
59.3%
$6,131,614.00
$2,833,753.00
46.2%
88.00
3/5
2.9782
4/5
1/5
4/5
-
15
-
+11%
-18%
-7%
Alta Vista Rehabilitation and Healthcare
SNF

Nursing Homes 24/7 care needed

Brownsville
100
71
BROWNSVILLE CARE ASSOCIATES, INC
82.0%
$12,084,404.00
$4,455,937.00
36.9%
79.70
3/5
3.2565
2/5
2/5
5/5
2
16
4
-36%
-10%
+29%
Mid Valley Nursing & Rehabilitation
SNF

Nursing Homes 24/7 care needed

Mercedes
123
25
ROEL, ALICE
75.3%
$11,674,112.00
$3,454,976.00
29.6%
80.40
2/5
2.7193
1/5
1/5
5/5
2
22
4
-77%
-25%
+19%
Brownsville Nursing and Rehabilitation Center
SNF

Nursing Homes 24/7 care needed

Brownsville
120
34
REGENCY IHS OF BROWNSVILLE LLC
81.2%
$9,198,367.00
$3,241,010.00
35.2%
111.10
1/5
2.6430
1/5
1/5
4/5
2
40
3
+20%
-27%
+28%

Places of interest near Ebony Lake Nursing and Rehabilitation Center

Address 1.7 miles from city center

Address 1001 Central Blvd, Brownsville, TX 78520

Calculate Travel Distance to Ebony Lake Nursing and Rehabilitation Center

Add your location

Address

Staffing Data

Source: CMS Payroll-Based Journal (Q2 2025)

72
Total Staff
66
Employees
6
Contractors
26,206
Total Hours (Quarter)
33
Avg Staff/Day
8.7
Avg Shift (hrs)
Nursing Staff Breakdown
Role Count Avg Shift (hrs) Uses Contractors?
Registered Nurse69.3 No
Licensed Practical Nurse168.7 No
Certified Nursing Assistant229.1 No
Staff by Category
Administration
2 staff
7.4hs shift avg
Nursing Staff
57 staff
8.9hs shift avg
Physicians & Practitioners
1 staff
9hs shift avg
Therapy Services
5 staff
6.9hs shift avg
Activities & Recreation
0 staff
0hs shift avg
Social Services
0 staff
0hs shift avg
Dietary Services
6 staff
7.6hs shift avg
Other Services
1 staff
6.2hs shift avg
Contractor Analysis
3.8%
of total hours from contractors
990 contractor hours this quarter
Physical Therapy Assistant: 1 Medical Director: 1 Respiratory Therapy Technician: 1 Occupational Therapy Aide: 1 Physical Therapy Aide: 1 Occupational Therapy Assistant: 1
Role Employees Contractors Total Staff Total Hours Days Worked % of Days Avg Shift (hrs)
Certified Nursing Assistant2202212,47691100%9.1
Licensed Practical Nurse160164,06091100%8.7
Medication Aide/Technician8082,43691100%8.7
Registered Nurse6061,88891100%9.3
RN Director of Nursing5051,6268290%8.1
Other Dietary Services Staff5056227684%7.6
Nurse Practitioner1015916673%9
Administrator1015536571%8.5
Dietitian1015457279%7.6
Respiratory Therapy Technician0114636369%7.3
Physical Therapy Assistant0114236571%6.5
Mental Health Service Worker1014216875%6.2
Occupational Therapy Aide0114767%7.8
Occupational Therapy Assistant0113267%5.3
Medical Director011211213%1.8
Physical Therapy Aide011411%3.8

Facility Characteristics

Source: CMS Long-Term Care Facility Characteristics (Data as of Jan 2026)

Total census
75 residents
Residents by payment source
Medicare
2 residents (2.7%)
Medicaid
46 residents (61.3%)
Private pay or other
27 residents (36%)
Programs & Services
Residents' Group

Residents meet regularly to discuss policies, care quality, and activities

Active Resident Council

Organized group of residents that meets regularly to discuss facility policies, quality of life, and activities.

Quality of care over time

These measures show how residents usually do over time at this home, based on health outcomes and preventive care.

High-risk clinical events score Info A composite score based on pressure ulcers, falls with injury, weight loss, walking ability decline, and activities of daily living decline. 5.3
38% better than Texas average

Texas average: 8.6

Functional decline score Info A composite score based on activities of daily living decline, walking ability decline, and incontinence. 12.6
21% better than Texas average

Texas average: 16.0

Long-stay resident measures
Significantly above average Texas avg: 4.2 Info CMS star rating based on long-stay quality measure performance. 5 stars = significantly above average, 1 star = significantly below average.
Need for Help with Daily Activities Increased Info Percent of long-stay residents whose need for help with daily activities has increased 13.4%
17% better than Texas average

Texas average: 16.2%

Walking Ability Worsened Info Percent of long-stay residents whose ability to move independently worsened 8.7%
46% better than Texas average

Texas average: 16.2%

Low Risk Residents with Bowel/Bladder Incontinence Info Percent of low risk long-stay residents who lose control of their bowels or bladder 15.9%
In line with Texas average

Texas average: 15.7%

Falls with Major Injury Info Percent of long-stay residents experiencing one or more falls with major injury 0.4%
89% better than Texas average

Texas average: 3.2%

High Risk Residents with Pressure Ulcers Info Percent of long-stay high risk residents with pressure ulcers 2.9%
34% better than Texas average

Texas average: 4.4%

Urinary Tract Infection Info Percent of long-stay residents with a urinary tract infection 0.0%
100% better than Texas average

Texas average: 0.8%

Lost Too Much Weight Info Percent of long-stay residents who lose too much weight 1.2%
65% better than Texas average

Texas average: 3.5%

Depressive Symptoms Info Percent of long-stay residents who have depressive symptoms 2.2%
25% better than Texas average

Texas average: 2.9%

Antipsychotic Use Info Percent of long-stay residents who received an antipsychotic medication 4.2%
47% better than Texas average

Texas average: 7.9%

Pneumococcal Vaccine Info Percent of long-stay residents assessed and appropriately given the pneumococcal vaccine 98.9%
In line with Texas average

Texas average: 97.3%

Influenza Vaccine Info Percent of long-stay residents assessed and appropriately given the seasonal influenza vaccine 98.7%
In line with Texas average

Texas average: 97.9%

Short-stay resident measures
Above average Texas avg: 2.9 Info CMS star rating based on short-stay quality measure performance. 5 stars = much above average, 1 star = much below average.
Pneumococcal Vaccine Info Percent of short-stay residents assessed and appropriately given the pneumococcal vaccine 100.0%
11% better than Texas average

Texas average: 90.4%

Antipsychotic medication increase Info Percent of short-stay residents who newly received an antipsychotic medication 0.4%
72% better than Texas average

Texas average: 1.4%

Influenza Vaccine Info Percent of short-stay residents assessed and appropriately given the seasonal influenza vaccine 96.9%
10% better than Texas average

Texas average: 88.0%

Re-hospitalized after SNF stay Info Percentage of short-stay residents who were re-hospitalized after their nursing home admission. 17.5%
32% better than Texas average

Texas average: 25.9%

Emergency department visits Info Percentage of short-stay residents who had an outpatient emergency department visit. 13.5%
13% worse than Texas average

Texas average: 12.0%

Falls with major injury Info Percentage of SNF residents who experience falls with major injury during their stay. 0.0%
100% better than Texas average

Texas average: 0.8%

Ability to care for self at discharge Info Percentage of residents at or above expected ability to care for themselves at discharge. 40.0%
25% worse than Texas average

Texas average: 53.7%

Successful return to home or community Info Rate of successful return to home or community from a skilled nursing facility. 57.8%
14% better than Texas average

Texas average: 50.6%

Guides for Better Senior Living

Care Cost Calculator: See Prices in Your Area

Nursing Home Data Explorer

Don’t Wait Too Long: 7 Red Flag Signs Your Parent Needs Assisted Living Now

The True Cost of Assisted Living in 2025 – And How Families Are Paying For It

Understanding Senior Living Costs: Pricing Models, Discounts & Financial Assistance

Financial Aid for Texas Seniors

Get financial aid guidance

Community Care for the Aged and Disabled (CCAD)

TX Medicaid CCAD

Age 65+ or disabled, Texas resident, Medicaid-eligible, care need (not always nursing home level).

~$2,829/month (300% FBR, individual).

$2,000 (individual), $3,000 (couple).

Large state; rural access challenges.

Texas Community Care Services

TX CCS

Age 60+, Texas resident, at risk of decline.

~$2,000/month (individual, varies).

$5,000 (individual).

Limited funding; high demand in urban areas.

Area Agency on Aging (AAA) Services

Texas AAA Services

Age 60+, TX resident; no income/asset limits.

None; donations encouraged.

Not assessed.

28 AAAs; includes Meals on Wheels in some areas.

Medicare Savings Program (MSP)

Texas Medicare Savings Program

Age 65+ or disabled, TX resident, Medicare Part A/B.

~$2,510/month (QMB), ~$3,380/month (SLMB), ~$3,598/month (QI)—individual.

$9,430 (individual), $14,130 (couple).

Includes Extra Help for Part D; no waitlist.

Low-Income Home Energy Assistance Program (LIHEAP)

Texas Comprehensive Energy Assistance Program (CEAP)

Age 60+ prioritized, TX resident, low-income.

~$3,970/month (185% FPL).

Not assessed.

Priority for elderly/disabled; covers gas, electric, propane.

Family Caregiver Support Program (FCSP)

Texas Family Caregiver Support Program

Caregivers of 60+ needing care or 55+ caregivers of others; TX resident; 2+ ADLs.

No strict cap; prioritizes low-income (~$24,980/year).

Not assessed.

High rural demand; includes grandparent caregivers.

Senior Community Service Employment Program (SCSEP)

Texas SCSEP

Age 55+, unemployed, low-income, TX resident.

~$1,983/month (125% FPL).

Not specified.

Priority for veterans, rural residents; AARP partnership.

VA Aid and Attendance (A&A) and Housebound Benefits

Texas VA Aid and Attendance/Housebound

Age 65+ or disabled veteran/spouse, TX resident, wartime service, ADL help (A&A) or homebound.

Net income < ~$1,984/month (veteran with dependent, A&A); pension offsets income.

~$155,356 (net worth).

High veteran population; supports rural/urban needs.

Property Tax Exemption for Seniors

Texas Senior Property Tax Exemption

Age 65+, TX resident, homeowner (homestead).

None; tax-based eligibility.

Not assessed.

$25,000+ exemption; optional freeze in some counties; saves ~$500-$1,000/year.

Senior Farmers’ Market Nutrition Program (SFMNP)

Texas SFMNP

Age 60+, TX resident, low-income.

~$2,322/month (185% FPL).

Not assessed.

Vouchers (~$50/season); serves ~20,000 via 28 AAAs.