Explore Open Rooms

1 Contact details
2 What type of senior care service are you looking for?
3 What budget do you have in mind for senior care?
4 How soon do you need to find care?
5 Additional details

Thank you for your interest!

Our team will be in touch shortly to help with next steps.

Nursing Home

Edmonds Care

Nursing Home

Edmonds Care

21400 72nd Ave W, Edmonds, WA 98026 View map
Overview of Edmonds Care

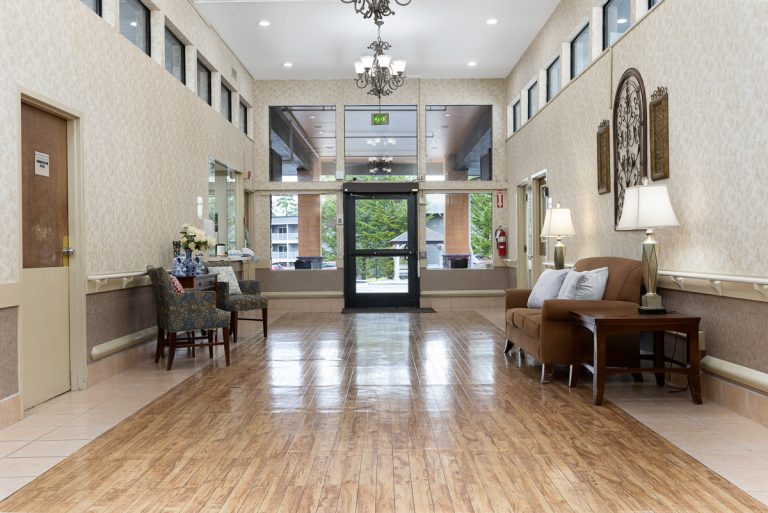
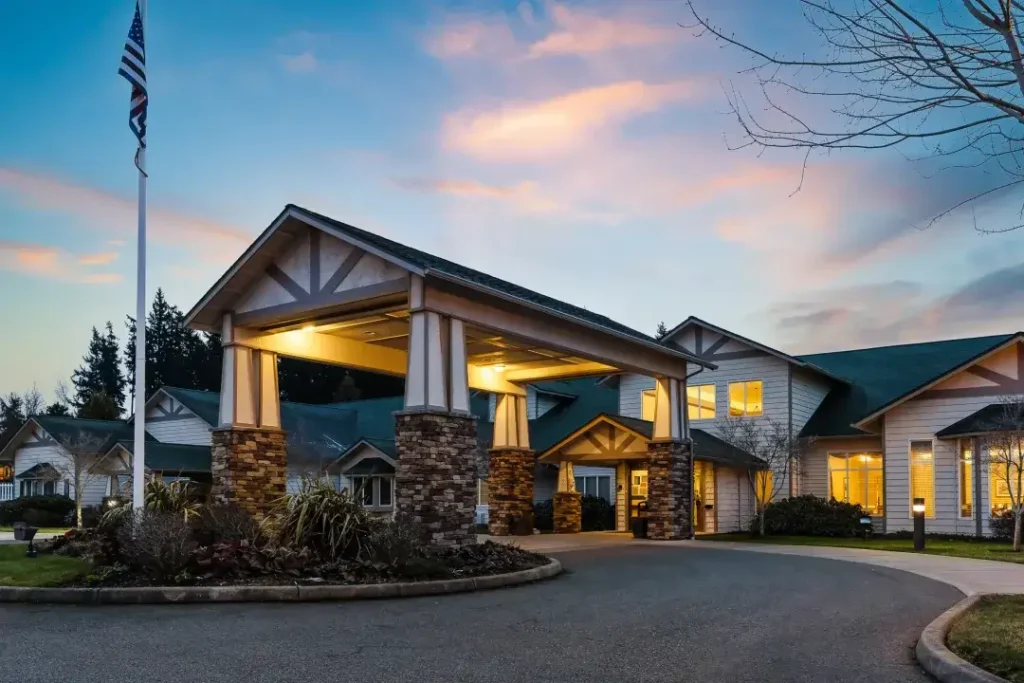
Edmonds Care is a premiere senior living community in Edmonds, WA, offering long-term skilled nursing, short-term rehabilitation, and an array of therapy services. The community offers warmly decorated private and semi-private rooms with access to free, in-room cable services, WiFi, and comfortable lounge areas. Residents are well-supported throughout their recovery with 24-hour support and care from a consistent, compassionate, and well-trained team of professionals.

The community adopts a resident-centered approach to care, offering personalized care, comprehensive therapies, specialized care services, and support services for residents and their families. To make residents’ stay more comfortable and fun, the community also offers life enrichment services, such as quality-time with residents, celebrations, learning and recreation opportunities, along with a variety of engaging activities. With a supportive environment, compassionate care team, convenient amenities, and innovative healthcare, residents are guaranteed a comfortable healing journey at Edmonds Care.

(425) 670-5326

Quality ratings

Measured by Centers for Medicare & Medicaid Services (CMS)

Overall rating Info The Overall CMS Rating combines results from health inspections, staffing levels and quality measures. Health inspections carry the most weight. Staffing and quality scores can increase or decrease the final rating based on performance compared to state and national standards.
2/5
Washington average: 3.2/5
Health Inspection Info Based on the results of the facility's three most recent standard inspections and any complaint investigations. CMS reviews the number, scope, and severity of deficiencies, with more recent findings weighted more heavily.
2/5
Washington average: 2.8/5
Staffing Info Measures average nursing staff hours per resident per day, including Registered Nurses (RNs) and total nursing staff. Ratings are adjusted based on the level of care residents require and are compared to state and national benchmarks.
3/5
Washington average: 3.4/5
Quality Measures Info Based on clinical and physical health indicators reported to CMS, such as hospital readmissions, falls, pressure ulcers, and improvements in mobility. These measures reflect how well residents' health needs are being managed.
4/5
Washington average: 3.9/5

Nursing care per resident

Info This shows how many total hours of nursing staff time are available per resident each day. Higher numbers usually mean more staff support.
4h 21m per day

This home provides 3% more nursing time per resident than the Washington average.

Washington average: 4h 13m per day

Staffing hours breakdown

Info Hours of care per resident per day, broken down by staff type. Data from CMS Medicare.
Staff type Facility State avg National avg
Registered Nurse (RN) Info Registered nurse hours per resident per day. 47m per day 53m per day 41m per day
Nurse Aide Info Nurse aide hours per resident per day. 2h 25m per day 2h 41m per day 2h 21m per day
Total Nursing (Weekend) Info Total number of nurse staff hours per resident per day on weekends. 3h 32m per day 3h 47m per day 3h 26m per day
Physical Therapist Info Physical therapist staff hours per resident per day. 3m per day 5m per day 4m per day
RN (Weekend) Info Registered nurse hours per resident per day on weekends. 40m per day 38m per day 29m per day

Capacity and availability

Medium-capacity home

Offers a balance of services and community atmosphere.

Total beds 128

This home usually has availability

Lower occupancy suggests more openings may be available.

Lower demand than the Washington average
Occupancy rate 63.8%
Residents per day (avg) 75
Occupancy rate
63.8%
Residents per day (avg)
75

Who this home usually serves

TYPE OF STAY

Primarily short stays

Residents typically stay for brief periods, with frequent admissions and discharges throughout the year.

Might be optimal for
Post-acute recovery Temporary care Transitional stays

Breakdown by payment type

Medicare

24% of new residents, usually for short-term rehab.

Typical stay 23 days

Private pay

67% of new residents, often for short stays.

Typical stay 28 days

Medicaid

9% of new residents, often for long-term daily care.

Typical stay 2 - 3 years

Finances and operations

Privately-owned community
Operated by a business corporation.
Home revenue
$13.5M
Profit
$834.7K
Privately-owned community Operated by a business corporation.
Home revenue
$13,494,725.00
Profit
$834,670.00
Payroll costs Info The portion of the home's budget spent on staff, including nurses, caregivers, and other employees who support care and operations.
$5.1M
37.5% of revenue
Other operating costs Info All remaining costs needed to run the home, such as food, utilities, building maintenance, supplies and administrative expenses.
$7.6M
Total costs $12.7M

What does this home offer?

Building type icon
Building type icon

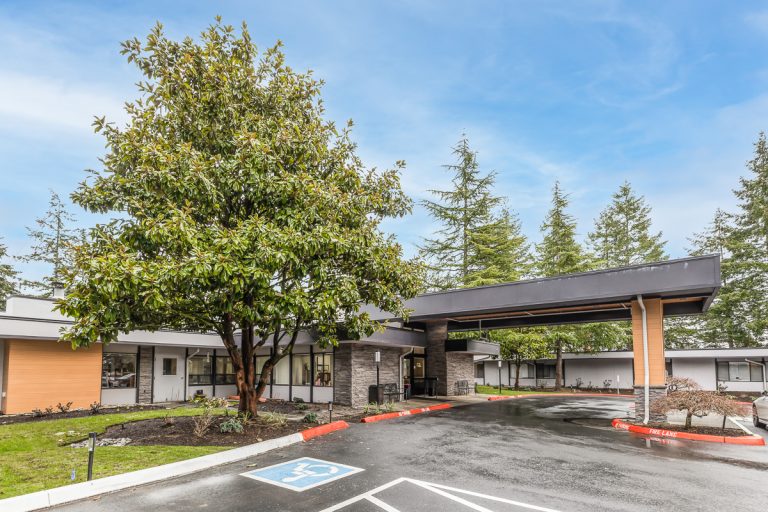
Building Type: Single-story

Fitness and recreation icon

Fitness and Recreation

Types of Care at Edmonds Care

Skilled Nursing

Health Inspection History

Inspections
Total health inspections 16

Washington average 7.8


Last Health inspection on Nov 2025

Total health citations 97

Washington average 48.9

Citations per inspection
6.06

Washington average 6.92


Health citations are formal notices following inspections when they fail to comply with safety and care standards.

75 of 97 citations resulted from standard inspections; and 22 of 97 resulted from complaint investigations.

Breakdown of citation severity (last 3 years)
Critical Health citations More info 0
100% better than Washington average

Washington average: 0.3


Serious Health citations More info 1
41% better than Washington average

Washington average: 1.7

0 critical citations More info Washington average: 0.3

1 serious citation More info Washington average: 1.7

95 moderate citations More info Washington average: 46.3

1 minor citation More info Washington average: 0.5
Citations history (last 3 years)
Resident Rights moderate citation Info Issues related to resident's rights, including dignity, privacy, and the ability to make decisions about their care. Nov 17, 2025
Corrected

Infection Control moderate citation Info Issues related to preventing and controlling infections, including hygiene practices and safety protocols. Apr 21, 2025
Corrected

Care Planning moderate citation Info Issues related to creating and updating personalized care plans for residents based on their needs and conditions. Apr 21, 2025
Corrected

Abuse/Neglect moderate citation Info Issues related to protecting resident's from harm, including abuse, neglect, or mistreatment. Mar 14, 2025
Corrected

Compare Nursing Homes around Edmonds The information below is reported by the Washington Department of Social and Health Services, Residential Care Services.

2 facilities compared · CMS & WA Dept. of Health data · Updated Mar 2026

Sequim Health & Rehabilitation
NH

Nursing Home Licensed facility providing 24/7 skilled nursing care for residents with complex, ongoing medical needs. Staffed by RNs, LPNs, and CNAs. Inspected and star-rated annually by CMS. Accepts Medicare (short-term rehab) and Medicaid (long-term care).

Sequim
100
70.6%
-3%
4.22
-36%
0%
1
56
2
72
A+
49
Aldred, James
$11,5M
$4,5M
38.9%
505128
Edmonds Care
NH

Nursing Home Licensed facility providing 24/7 skilled nursing care for residents with complex, ongoing medical needs. Staffed by RNs, LPNs, and CNAs. Inspected and star-rated annually by CMS. Accepts Medicare (short-term rehab) and Medicaid (long-term care).

Edmonds
128
63.8%
-12%
4.35
+48%
+3%
1
97
1
75
-
61
-
$12,8M
$5,1M
39.4%
505236

Places of interest near Edmonds Care

Address 2.6 miles from city center — 0.16 miles to nearest hospital (Swedish Edmonds Campus)

Address 21400 72nd Ave W, Edmonds, WA 98026

Calculate Travel Distance to Edmonds Care

Add your location

Address

Staffing Data (Q2 2025)

This data corresponds to Q2 2025 and is based on CMS Payroll-Based Journal.

Total staff 148
Employees 108
Contractors 40
Staff to resident ratio 1.61:1
13% worse than Washington average

Washington average ratio: 1.85:1

Avg staff/day 47
Average shift 7.9 hours
0% compared with Washington average

Washington average: 8.1 hours

Total staff hours (quarter) 33,756
Nursing staff breakdown
Registered Nurse

Manages medical care and health needs.

Total count 30
Average shift length Info Average shift length. Calculated as total hours divided by days worked and average staff per day. 8.5 hours

This role is partially covered by contractors.

Licensed Practical Nurse

Assists with medical care and medications.

Total count 35
Average shift length Info Average shift length. Calculated as total hours divided by days worked and average staff per day. 9.7 hours

This role is partially covered by contractors.

Certified Nursing Assistant

Helps with daily care and mobility.

Total count 49
Average shift length Info Average shift length. Calculated as total hours divided by days worked and average staff per day. 7.7 hours

No contractors work on this role.

Contractor staffing

Total hours from contractors

3.7%

1,234 contractor hours this quarter

Registered Nurse: 17 Licensed Practical Nurse: 16 Occupational Therapy Assistant: 3 Medical Director: 2 Administrator: 1 Occupational Therapy Aide: 1
Staff by category
Certified Nursing Assistant4904916,93891100%7.7
Licensed Practical Nurse1916355,32791100%9.7
Registered Nurse1317303,49691100%8.5
RN Director of Nursing3031,5887684%8.4
Clinical Nurse Specialist4049446976%8.7
Physical Therapy Aide2028726571%8
Dental Services Staff2028607380%8.1
Other Dietary Services Staff2026588897%7.5
Administrator1125206571%8
Nurse Practitioner2025206571%8
Speech Language Pathologist2024916571%6.2
Respiratory Therapy Technician1014138088%5.2
Dietitian1014055965%6.9
Qualified Social Worker2022614246%6.2
Mental Health Service Worker1011712123%8.2
Physical Therapy Assistant3031305156%2.5
Occupational Therapy Aide1121122224%5.1
Occupational Therapy Assistant033282831%1
Medical Director022241618%1.5
49 Certified Nursing Assistant
% of Days 100%
35 Licensed Practical Nurse
% of Days 100%
30 Registered Nurse
% of Days 100%
3 RN Director of Nursing
% of Days 84%
4 Clinical Nurse Specialist
% of Days 76%
2 Physical Therapy Aide
% of Days 71%
2 Dental Services Staff
% of Days 80%
2 Other Dietary Services Staff
% of Days 97%
2 Administrator
% of Days 71%
2 Nurse Practitioner
% of Days 71%
2 Speech Language Pathologist
% of Days 71%
1 Respiratory Therapy Technician
% of Days 88%
1 Dietitian
% of Days 65%
2 Qualified Social Worker
% of Days 46%
1 Mental Health Service Worker
% of Days 23%
3 Physical Therapy Assistant
% of Days 56%
2 Occupational Therapy Aide
% of Days 24%
3 Occupational Therapy Assistant
% of Days 31%
2 Medical Director
% of Days 18%

Facility Characteristics

Source: CMS Long-Term Care Facility Characteristics (Data as of Jan 2026)

Total census
92 residents
Residents by payment source
Medicare
18 residents (19.6%)
Medicaid
64 residents (69.6%)
Private pay or other
10 residents (10.9%)
Programs & Services
Residents' Group

Residents meet regularly to discuss policies, care quality, and activities

Active Resident Council

Organized group of residents that meets regularly to discuss facility policies, quality of life, and activities.

Quality of care over time

These measures show how residents usually do over time at this home, based on health outcomes and preventive care.

High-risk clinical events score Info A composite score based on pressure ulcers, falls with injury, weight loss, walking ability decline, and activities of daily living decline. 9.1
9% better than Washington average

Washington average: 10.0

Functional decline score Info A composite score based on activities of daily living decline, walking ability decline, and incontinence. 17.7
15% better than Washington average

Washington average: 20.9

Long-stay resident measures
Above average Washington avg: 3.6 Info CMS star rating based on long-stay quality measure performance. 5 stars = significantly above average, 1 star = significantly below average.
Need for Help with Daily Activities Increased Info Percent of long-stay residents whose need for help with daily activities has increased 12.1%
26% better than Washington average

Washington average: 16.4%

Walking Ability Worsened Info Percent of long-stay residents whose ability to move independently worsened 19.9%
9% better than Washington average

Washington average: 21.8%

Low Risk Residents with Bowel/Bladder Incontinence Info Percent of low risk long-stay residents who lose control of their bowels or bladder 21.0%
14% better than Washington average

Washington average: 24.3%

Falls with Major Injury Info Percent of long-stay residents experiencing one or more falls with major injury 2.2%
16% better than Washington average

Washington average: 2.6%

High Risk Residents with Pressure Ulcers Info Percent of long-stay high risk residents with pressure ulcers 5.5%
12% worse than Washington average

Washington average: 4.9%

Urinary Tract Infection Info Percent of long-stay residents with a urinary tract infection 1.5%
16% better than Washington average

Washington average: 1.7%

Lost Too Much Weight Info Percent of long-stay residents who lose too much weight 5.8%
In line with Washington average

Washington average: 5.8%

Depressive Symptoms Info Percent of long-stay residents who have depressive symptoms 2.0%
88% better than Washington average

Washington average: 16.2%

Antipsychotic Use Info Percent of long-stay residents who received an antipsychotic medication 15.9%
10% worse than Washington average

Washington average: 14.5%

Pneumococcal Vaccine Info Percent of long-stay residents assessed and appropriately given the pneumococcal vaccine 99.3%
In line with Washington average

Washington average: 96.2%

Influenza Vaccine Info Percent of long-stay residents assessed and appropriately given the seasonal influenza vaccine 97.4%
In line with Washington average

Washington average: 93.8%

Short-stay resident measures
Above average Washington avg: 3.6 Info CMS star rating based on short-stay quality measure performance. 5 stars = much above average, 1 star = much below average.
Pneumococcal Vaccine Info Percent of short-stay residents assessed and appropriately given the pneumococcal vaccine 92.6%
5% better than Washington average

Washington average: 88.1%

Antipsychotic medication increase Info Percent of short-stay residents who newly received an antipsychotic medication 1.9%
32% worse than Washington average

Washington average: 1.4%

Influenza Vaccine Info Percent of short-stay residents assessed and appropriately given the seasonal influenza vaccine 88.1%
7% better than Washington average

Washington average: 82.0%

Re-hospitalized after SNF stay Info Percentage of short-stay residents who were re-hospitalized after their nursing home admission. 25.4%
28% worse than Washington average

Washington average: 19.9%

Emergency department visits Info Percentage of short-stay residents who had an outpatient emergency department visit. 12.2%
8% better than Washington average

Washington average: 13.2%

Falls with major injury Info Percentage of SNF residents who experience falls with major injury during their stay. 2.5%
225% worse than Washington average

Washington average: 0.8%

Ability to care for self at discharge Info Percentage of residents at or above expected ability to care for themselves at discharge. 41.7%
22% worse than Washington average

Washington average: 53.7%

Successful return to home or community Info Rate of successful return to home or community from a skilled nursing facility. 59.9%
19% better than Washington average

Washington average: 50.6%

Penalties and fines

Federal penalties imposed by CMS for regulatory violations, including civil money penalties (fines) and denials of payment for new Medicare/Medicaid admissions.

Source: CMS Penalties Database (Data as of Jan 2026)

Total fines amount $27K
68% lower than Washington average

Washington average: $82K

Number of fines 1
46% fewer fines than Washington average

Washington average: 1.8

Payment Denials Info Serious action where Medicare and/or Medicaid temporarily stops payments for new residents until issues are fixed. 0
100% fewer payment denials than Washington average

Washington average: 0.3

Fines amount comparison
This facility $27K
Washington average $82K
Penalty History

Penalties are imposed by CMS for violations of federal nursing home regulations.

Civil Money Penalty Info Fines imposed for noncompliance, which can be assessed per day or per instance of violation. Apr 13, 2023
$27K

Last updated: Jan 2026

Guides for Better Senior Living

Care Cost Calculator: See Prices in Your Area

Nursing Home Data Explorer

Don’t Wait Too Long: 7 Red Flag Signs Your Parent Needs Assisted Living Now

The True Cost of Assisted Living in 2025 – And How Families Are Paying For It

Understanding Senior Living Costs: Pricing Models, Discounts & Financial Assistance

Financial Aid for Washington Seniors

Get financial aid guidance

Community Options Program Entry System (COPES)

WA Medicaid COPES

Age 65+ or disabled, Washington resident, Medicaid-eligible, nursing home-level care need.

~$2,829/month (300% FBR, individual).

$2,000 (individual), $3,000 (couple).

High demand in urban areas (e.g., Seattle).

Washington Family Caregiver Support Program

WA NFCSP

Caregiver of someone 60+ (or with dementia), Washington resident.

No strict limit; prioritizes low-income.

Not applicable.

High urban demand; rural outreach.

Community First Choice (CFC)

Washington Community First Choice

Age 65+ (or disabled 18+), WA resident, Medicaid-eligible, need help with 2+ ADLs/IADLs.

~$2,829/month; QIT optional.

$2,000 (individual), $3,000 (couple).

Broader than COPES; serves ~20,000; self-directed option.

Older Americans Act (OAA) Services

Washington OAA Services

Age 60+, WA resident; no income/asset limits.

None; donations encouraged.

Not assessed.

13 AAAs; includes Meals on Wheels; rural focus.

Medicare Savings Program (MSP)

Washington Medicare Savings Program

Age 65+ or disabled, WA resident, Medicare Part A/B.

~$2,510/month (QMB), ~$3,380/month (SLMB), ~$3,598/month (QI)—individual.

$9,430 (individual), $14,130 (couple).

Includes Extra Help for Part D; no waitlist.

Low-Income Home Energy Assistance Program (LIHEAP)

Washington LIHEAP

Age 60+ prioritized, WA resident, low-income household.

~$3,970/month (185% FPL).

Not assessed.

Covers gas, electric, wood; emergency aid available.

Senior Community Service Employment Program (SCSEP)

Washington SCSEP

Age 55+, unemployed, low-income, WA resident.

~$1,983/month (125% FPL).

Not specified.

Priority for veterans, rural residents; AARP partnership.

VA Aid and Attendance (A&A) and Housebound Benefits

Washington VA Aid and Attendance/Housebound

Age 65+ or disabled veteran/spouse, WA resident, wartime service, ADL help (A&A) or homebound.

Net income < ~$1,984/month (veteran with dependent, A&A); pension offsets income.

~$155,356 (net worth).

High veteran use; supports rural/urban needs.

Senior Citizens Property Tax Exemption

Washington Senior Property Tax Exemption

Age 61+ or disabled retiree, WA resident, homeowner, income-based.

~$45,000-$70,000/year (varies by county, e.g., King: $70,000).

Not assessed; home value cap varies (~$250,000-$400,000).

Saves ~$500-$1,500/year; offered statewide.

Senior Farmers’ Market Nutrition Program (SFMNP)

Washington SFMNP

Age 60+, WA resident, low-income.

~$2,322/month (185% FPL).

Not assessed.

Vouchers (~$80/season); serves ~20,000 via AAAs.

Tour Icon
Planning a tour? Check our touring checklist.
Chat Icon
Thinking of living here? We can help you speak to a current resident