Sequim Health & Rehabilitation
CMS overall rating Info CMS (the Centers for Medicare & Medicaid Services) is the federal agency that rates nursing home quality. Its Overall Rating runs from 1 to 5 stars, combining health inspections, staffing, and quality measures, with inspections weighted most heavily.

Sequim Health & Rehabilitation

CMS overall rating Info CMS (the Centers for Medicare & Medicaid Services) is the federal agency that rates nursing home quality. Its Overall Rating runs from 1 to 5 stars, combining health inspections, staffing, and quality measures, with inspections weighted most heavily.
Calculator: See prices in your area
Sequim Health & Rehabilitation accepts Medicare, Medicaid, and private pay.

Overview of Sequim Health & Rehabilitation

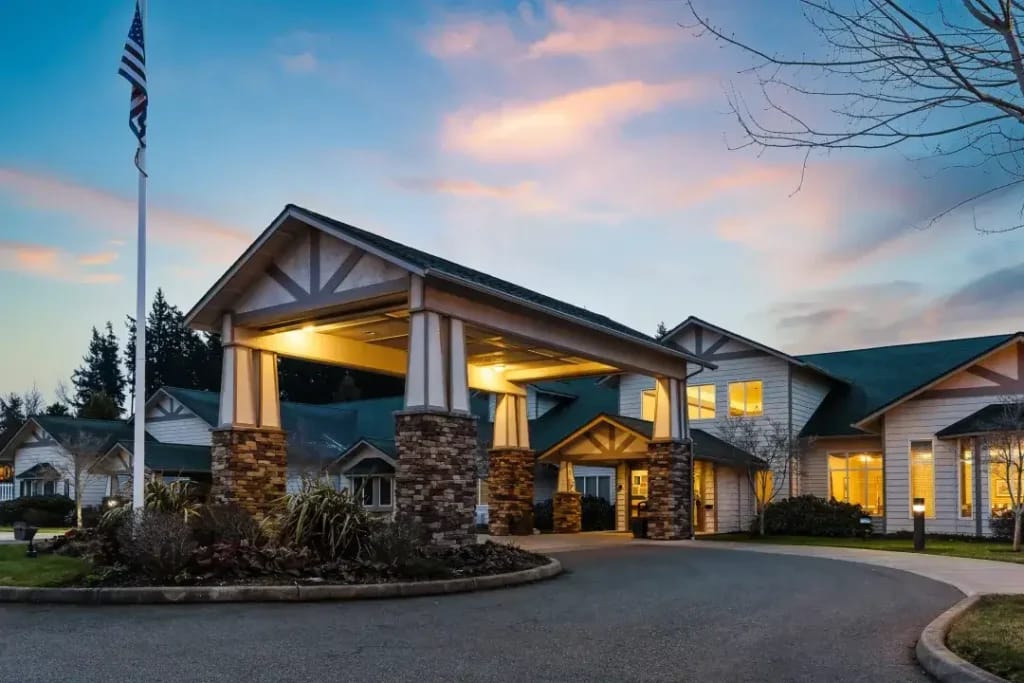
Sequim Health and Rehabilitation is a remarkable senior living community situated on Hemlock Street, Sequim, WA, providing short-term rehab, long-term skilled nursing, and therapy services. With round-the-clock skilled nursing, residents may let go of their worries, and families ease their minds knowing their loved ones are well taken care of. The community also offers speech, occupational, and physical therapy ensuring residents’ overall wellness.

By conducting wellness-focused activities, the community encourages residents to live an active and engaged lifestyle. The community takes pride in a team of experienced and compassionate professionals, who exceed expectations in delivering the highest quality of care. Sequim Health and Rehabilitation ensures residents live their golden years in comfort and style with its serene grounds.

(360) 582-2400

Quality ratings

Measured by Centers for Medicare & Medicaid Services (CMS)

Overall rating Info The Overall CMS Rating combines results from health inspections, staffing levels and quality measures. Health inspections carry the most weight. Staffing and quality scores can increase or decrease the final rating based on performance compared to state and national standards.
▼ 7.0% Below WA avg. ▼ 7.0% Below WA avg.WA average: 3.2Click the badge to see the full State ranking.Click here to see the full State ranking.
Health Inspection Info Based on the results of the facility's three most recent standard inspections and any complaint investigations. CMS reviews the number, scope, and severity of deficiencies, with more recent findings weighted more heavily.
▲ 6.5% Above WA avg. ▲ 6.5% Above WA avg.WA average: 2.8Click the badge to see the full State ranking.Click here to see the full State ranking.
Staffing Info Measures average nursing staff hours per resident per day, including Registered Nurses (RNs) and total nursing staff. Ratings are adjusted based on the level of care residents require and are compared to state and national benchmarks.
▼ 12.4% Below WA avg. ▼ 12.4% Below WA avg.WA average: 3.4Click the badge to see the full State ranking.Click here to see the full State ranking.
Quality Measures Info Based on clinical and physical health indicators reported to CMS, such as hospital readmissions, falls, pressure ulcers, and improvements in mobility. These measures reflect how well residents' health needs are being managed.
▲ 1.7% Above WA avg. ▲ 1.7% Above WA avg.WA average: 3.9Click the badge to see the full State ranking.Click here to see the full State ranking.

Staffing hours breakdown

Info Daily nursing hours per resident by staff type, reported to CMS. Higher is generally better — compare this facility to state and national averages to see where staffing stands.

Hours per resident per day — compared to Washington state averages

Total nursing care / resident Info This home is ranked 38th out of 90 homes in Washington for nurse hours. Total adjusted nursing hours per resident per day, combining RN, LPN, and aide time. CMS adjusts this for case-mix so facilities can be fairly compared.
4h 13m per day
Rank #38 / 90Nurse hours — State benchmarkedThis home is ranked 38th out of 90 homes in Washington. Shows adjusted nurse hours per resident per day benchmarked to the Washington average, with a ranking across 90 Washington facilities. More hours mean more direct care. The national average is about 3.5 hrs; below 3.0 is a red flag.Rankings are based only on facilities in Washington that report data for that category. Facilities without available data are excluded from the ranking.Click the rank badge to see the full State ranking.Click here to see the full State ranking.
This facility Washington avg (4h 13m per day)
vs Washington avg
+0%

6 of 6 metrics below state avg

Staff typeHours / Day / Residentvs state avg
Registered Nurse (RN) Info RNs hold the highest nursing license and can assess residents, interpret test results, and direct care plans. More RN hours per day often signals stronger clinical oversight and faster response to health changes. 39m per day ▼ 26% State avg: 53m per day · National avg: 41m per day
LPN / LVN Info Licensed Practical Nurses (LPNs) or Licensed Vocational Nurses (LVNs) deliver routine hands-on care — medication administration, wound dressing, and monitoring vital signs. They work under RN supervision and make up a large share of daily bedside care. 47m per day ▼ 4% State avg: 49m per day · National avg: 52m per day
Nurse Aide Info Certified Nurse Aides (CNAs) provide the most direct day-to-day assistance: bathing, dressing, feeding, and mobility. Nurse aide hours are typically the largest staffing category and directly affect residents' quality of life. 2h 21m per day ▼ 12% State avg: 2h 41m per day · National avg: 2h 21m per day
Weekend Total Nursing Info Combined nursing hours (RN + LPN + Nurse Aide) per resident per day on weekends. Staffing often drops on weekends — this figure reveals whether the facility maintains adequate coverage outside of weekday hours. 3h 16m per day ▼ 13% State avg: 3h 47m per day · National avg: 3h 26m per day
Physical Therapist Info Hours per resident per day provided by licensed Physical Therapists (PTs) or PT Assistants. PT services help residents recover mobility after injury or illness and are especially important for post-acute (short-stay) rehabilitation. 5m per day ▼ 5% State avg: 5m per day · National avg: 4m per day
Weekend RN Info Registered nurse hours specifically on weekends. Facilities sometimes reduce RN presence on Saturdays and Sundays — a low weekend RN figure compared to weekday hours can indicate reduced clinical oversight when most administrative staff are absent. 16m per day ▼ 59% State avg: 38m per day · National avg: 29m per day

Capacity and availability

This home usually has availability

Lower occupancy than the Washington average: 72.5%
Occupancy rate
70.6% Rank #194 / 310Occupancy rate — State benchmarkedThis home is ranked 194th out of 310 homes in Washington. Shows this facility's occupancy rate versus the Washington average, with its Statewide rank out of 310. Higher occupancy signals strong local demand and financial stability.Rankings are based only on facilities in Washington that report data for that category. Facilities without available data are excluded from the ranking.Click the rank badge to see the full State ranking.Click here to see the full State ranking.
Avg. Length of Stay
108 days
Bed community size
100-bed community Rank #93 / 366Bed count — State benchmarkedThis home is ranked 93rd out of 366 homes in Washington. Shows this facility's certified or reported bed count compared to other Washington facilities. Larger communities may offer more amenities, programs, and on-site services for residents and families.Rankings are based only on facilities in Washington that report data for that category. Facilities without available data are excluded from the ranking.Click the rank badge to see the full State ranking.Click here to see the full State ranking.
A larger shared setting that may offer more common spaces and organized community services.
Years in operation
25 years in operation
A longer operating history, which may indicate experience navigating regulations and delivering ongoing care.
Walk Score
Walk Score: 49 / 100 Rank #334 / 628Walk Score — State benchmarkedThis home is ranked 334th out of 628 homes in Washington. Shows how walkable this facility's neighborhood is compared to the average Walk Score across Washington facilities. Higher scores benefit residents, families, and staff.Rankings are based only on facilities in Washington that report data for that category. Facilities without available data are excluded from the ranking.Click the rank badge to see the full State ranking.Click here to see the full State ranking.
Somewhat walkable. A few nearby services may be reachable on foot, but most trips require transportation.
BBB Rating
BBB Rating: A+ (Not Accredited)
An independent rating from the Better Business Bureau based on factors such as complaint history, transparency, and business practices.
How BBB ratings work

About this community

License Details

CMS Certification Number505128

Staffing

Key information about the people who lead and staff this community.

Leadership

ContactSkip Mc Donald, Administrator

Contact Sequim Health & Rehabilitation

Inspection History

In Washington, the Department of Social and Health Services, Residential Care Services conducts unannounced inspections and issues reports on the quality of care in all licensed settings.

Since 2023 · 3 years of data 57 deficiencies

Inspection Scorecard Info This scorecard compares key inspection, citation, and complaint metrics at this facility against the Washington state average. Metrics rated ≥15% worse than average are highlighted in red; those ≥15% better are highlighted in green.

Since 2023 vs. Washington state average
Overall vs. WA average 2 Worse Metrics worse than Washington average:
• Total deficiencies (84% above)
• Deficiencies per year (84% above)
0 Better No metrics in this bucket.
Latest Inspection September 12, 2025 Other An inspection that falls outside standard annual surveys and formal complaint investigations. May include administrative compliance checks, documentation reviews, focused surveys on specific concerns, or revisit surveys to verify prior corrections.

Deficiencies Info Deficiencies are formal regulatory issues recorded during state inspections.

This FacilityWA Averagevs. WA Avg
Total deficiencies Info Formal regulatory issues recorded by inspectors across all inspection types. 5731 This facility has 84% more total deficiencies than a typical Washington nursing home (57 vs. WA avg 31).↑ 84% worse
Deficiencies per year Info Average deficiencies per year since 2023. 1910.3 This facility has 84% more deficiencies per year than a typical Washington nursing home (19 vs. WA avg 10.3).↑ 84% worse

Inspection Reports Summary Info An editor-reviewed summary of the themes and findings across this facility's recent inspection reports.

  • September 12, 2025 inspection found one deficiency for incomplete, inaccessible medical records delaying Social Security benefits for a resident.
  • August 22, 2025 routine survey identified seven deficiencies including inaccurate mental health PASRR screenings, incomplete care plans, medication errors, bowel and pressure ulcer care failures, and inadequate RN coverage.
  • July 31, 2023 annual inspection cited 15 deficiencies including immediate jeopardy for infection control failures related to Carbapenem-resistant Acinetobacter baumannii transmission and multiple care, staffing, and medication administration issues.

Health Inspection History

Inspections since 2023
Total health inspections 16

Washington average 7.8


Last Health inspection on Sep 2025

Total health citations
56 Rank #55 / 92Health citations — State benchmarkedThis home is ranked 55th out of 92 homes in Washington. Shows this facility's total health deficiency citations benchmarked to the Washington State average, with a ranking across all 92 WA facilities. Lower citation counts earn a better rank.Rankings are based only on facilities in Washington that report data for that category. Facilities without available data are excluded from the ranking.Click the rank badge to see the full State ranking.Click here to see the full State ranking.

Washington average 48.9

Citations per inspection
3.5 Rank #6 / 92Citations per inspection — State benchmarkedThis home is ranked 6th out of 92 homes in Washington. Shows average deficiency citations per CMS inspection for this facility versus the Washington mean across 92 facilities with citation data. Lower is better.Rankings are based only on facilities in Washington that report data for that category. Facilities without available data are excluded from the ranking.Click the rank badge to see the full State ranking.Click here to see the full State ranking.

Washington average 6.92


Health citations are formal notices following inspections when they fail to comply with safety and care standards.

35 of 56 citations resulted from standard inspections; and 21 of 56 resulted from complaint investigations.

Breakdown of citation severity (last 3 years)
Critical health citations
1
233% worse than Washington average

Washington average: 0.3


Serious health citations
1
41% better than Washington average

Washington average: 1.7

1 critical citation Washington average: 0.3

1 serious citation Washington average: 1.7

52 moderate citations Washington average: 46.3

2 minor citations Washington average: 0.5
Citations history (last 3 years)
Care Planning moderate citation Sep 12, 2025
Corrected

Nursing Services moderate citation Aug 22, 2025
Corrected

Quality of Care moderate citation Aug 22, 2025
Corrected

Quality of Care moderate citation Aug 22, 2025
Corrected

Staffing Data

Reporting period: October 1 – December 31, 2025 (Q4 2025). Source: CMS Payroll-Based Journal report.

Total staff 126
Employees 88
Contractors 38
Staff to resident ratio 1.66 : 1
11% fewer staff per resident than Washington average
Washington average ratio: 1.86 : 1 Washington average ratio: 1.86 : 1See full Washington ranking
Avg staff/day 41
Average shift 9.1 hours
12% better than Washington average
Washington average: 8.1 hours Washington average shift: 8.1 hoursSee full Washington ranking
Total staff hours (quarter) 34,303

Nursing staff breakdown

Q4 2025 · Oct 1 – Dec 31 More info This data comes from the CMS Payroll-Based Journal report covering October 1 – December 31, 2025.
Registered Nurse

Manages medical care and health needs.

RN Staff Info All 11 RN Staff are full-time employees. No contractors work on this role. 11
Average shift length Info Average shift length. Calculated as total hours divided by days worked and average staff per day. 9.8 hours
Licensed Practical Nurse

Assists with medical care and medications.

LPN Staff Info 19 total: 11 full-time employees and 8 contractors. 19
Average shift length Info Average shift length. Calculated as total hours divided by days worked and average staff per day. 10.2 hours
Certified Nursing Assistant

Helps with daily care and mobility.

CNA Staff Info 59 total: 37 full-time employees and 22 contractors. 59
Average shift length Info Average shift length. Calculated as total hours divided by days worked and average staff per day. 9.8 hours

Contractor staffing

Q4 2025 · Oct 1 – Dec 31 More info This data comes from the CMS Payroll-Based Journal report covering October 1 – December 31, 2025.

Total hours from contractors

7.4%

2,525 contractor hours this quarter

Certified Nursing Assistant: 22 Licensed Practical Nurse: 8 Feeding Assistant: 3 Other Physician: 3 Medical Director: 1 Physician Assistant: 1

Staff by category

Q4 2025 · Oct 1 – Dec 31 More info This data comes from the CMS Payroll-Based Journal report covering October 1 – December 31, 2025.
Certified Nursing Assistant37225915,70192100%9.8
Licensed Practical Nurse118195,35892100%10.2
Registered Nurse110112,5839199%9.8
Clinical Nurse Specialist5051,8778087%8.6
Speech Language Pathologist4041,3007076%7.2
Medication Aide/Technician3031,2186773%11
Nurse Aide in Training3037645054%10.2
Physical Therapy Aide2027317379%6.2
Respiratory Therapy Technician3035966267%9.6
RN Director of Nursing2025396267%7.9
Dental Services Staff1014906874%7.2
Physical Therapy Assistant1014846065%8.1
Dietitian1014775863%8.2
Mental Health Service Worker1014766571%7.3
Nurse Practitioner1014725964%8
Other Dietary Services Staff1014616267%7.4
Occupational Therapy Aide1012815762%4.9
Feeding Assistant0332563134%7.5
Physician Assistant0111572729%5.8
Other Physician0335189%6.4
Medical Director011321921%1.7
59 Certified Nursing Assistant
% of Days 100%
19 Licensed Practical Nurse
% of Days 100%
11 Registered Nurse
% of Days 99%
5 Clinical Nurse Specialist
% of Days 87%
4 Speech Language Pathologist
% of Days 76%
3 Medication Aide/Technician
% of Days 73%
3 Nurse Aide in Training
% of Days 54%
2 Physical Therapy Aide
% of Days 79%
3 Respiratory Therapy Technician
% of Days 67%
2 RN Director of Nursing
% of Days 67%
1 Dental Services Staff
% of Days 74%
1 Physical Therapy Assistant
% of Days 65%
1 Dietitian
% of Days 63%
1 Mental Health Service Worker
% of Days 71%
1 Nurse Practitioner
% of Days 64%
1 Other Dietary Services Staff
% of Days 67%
1 Occupational Therapy Aide
% of Days 62%
3 Feeding Assistant
% of Days 34%
1 Physician Assistant
% of Days 29%
3 Other Physician
% of Days 9%
1 Medical Director
% of Days 21%

Penalties and fines

Includes penalties issued in 2023

Federal penalties imposed by CMS for regulatory violations, including civil money penalties (fines) and denials of payment for new Medicare/Medicaid admissions.

Source: CMS Penalties Database (Data as of Jan 2026)

Total fines amount $61K Rank #62 / 92Federal fines — State benchmarkedThis home is ranked 62nd out of 92 homes in Washington. Shows this facility's cumulative CMS federal fine dollars versus the Washington average among facilities with fines, and where it ranks among 92 facilities in the pool. Lower total dollars mean a better rank.Rankings are based only on facilities in Washington that report data for that category. Facilities without available data are excluded from the ranking.Click the rank badge to see the full State ranking.Click here to see the full State ranking.
25% lower than Washington average

Washington average: $82K

Number of fines 1
46% fewer fines than Washington average

Washington average: 1.8

Payment Denials Info Serious action where Medicare and/or Medicaid temporarily stops payments for new residents until issues are fixed. 0
100% fewer payment denials than Washington average

Washington average: 0.3

Fines amount comparison
This facility $61K
Washington average $82K
Penalty History

Penalties are imposed by CMS for violations of federal nursing home regulations.

1 penalty in the past 3 years

Jul 14, 2023 · $61K

Civil Money Penalty Info Fines imposed for noncompliance, which can be assessed per day or per instance of violation. Jul 14, 2023
$61K

Last updated: Jan 2026

Quality of care over time

These measures show how residents usually do over time at this home, based on health outcomes and preventive care.

High-risk clinical events score Info A composite score based on pressure ulcers, falls with injury, weight loss, walking ability decline, and activities of daily living decline. 8.3
17% better than Washington average

Washington average: 10.0

Functional decline score Info A composite score based on activities of daily living decline, walking ability decline, and incontinence. 23.5
13% worse than Washington average

Washington average: 20.9

Long-stay resident measures
Significantly above average Washington avg: 3.6 Info CMS star rating based on long-stay quality measure performance. 5 stars = significantly above average, 1 star = significantly below average.
Need for Help with Daily Activities Increased Info Percent of long-stay residents whose need for help with daily activities has increased 9.5%
42% better than Washington average

Washington average: 16.4%

Walking Ability Worsened Info Percent of long-stay residents whose ability to move independently worsened 19.3%
11% better than Washington average

Washington average: 21.8%

Low Risk Residents with Bowel/Bladder Incontinence Info Percent of low risk long-stay residents who lose control of their bowels or bladder 41.8%
72% worse than Washington average

Washington average: 24.3%

Falls with Major Injury Info Percent of long-stay residents experiencing one or more falls with major injury 0.9%
64% better than Washington average

Washington average: 2.6%

High Risk Residents with Pressure Ulcers Info Percent of long-stay high risk residents with pressure ulcers 8.0%
62% worse than Washington average

Washington average: 4.9%

Urinary Tract Infection Info Percent of long-stay residents with a urinary tract infection 3.3%
91% worse than Washington average

Washington average: 1.7%

Lost Too Much Weight Info Percent of long-stay residents who lose too much weight 3.9%
33% better than Washington average

Washington average: 5.8%

Depressive Symptoms Info Percent of long-stay residents who have depressive symptoms 1.0%
94% better than Washington average

Washington average: 16.2%

Antipsychotic Use Info Percent of long-stay residents who received an antipsychotic medication 12.6%
13% better than Washington average

Washington average: 14.5%

Pneumococcal Vaccine Info Percent of long-stay residents assessed and appropriately given the pneumococcal vaccine 99.1%
In line with Washington average

Washington average: 96.2%

Influenza Vaccine Info Percent of long-stay residents assessed and appropriately given the seasonal influenza vaccine 96.6%
In line with Washington average

Washington average: 93.8%

Hospitalizations per 1,000 days Info Number of hospitalizations per 1,000 long-stay resident days. 0.78
43% better than Washington average

Washington average: 1.38

ED visits per 1,000 days Info Number of outpatient emergency department visits per 1,000 long-stay resident days. 1.00
34% better than Washington average

Washington average: 1.51

Short-stay resident measures
Above average Washington avg: 3.6 Info CMS star rating based on short-stay quality measure performance. 5 stars = much above average, 1 star = much below average.
Pneumococcal Vaccine Info Percent of short-stay residents assessed and appropriately given the pneumococcal vaccine 91.3%
In line with Washington average

Washington average: 88.1%

Antipsychotic medication increase Info Percent of short-stay residents who newly received an antipsychotic medication 1.8%
29% worse than Washington average

Washington average: 1.4%

Influenza Vaccine Info Percent of short-stay residents assessed and appropriately given the seasonal influenza vaccine 92.4%
13% better than Washington average

Washington average: 82.0%

Re-hospitalized after SNF stay Info Percentage of short-stay residents who were re-hospitalized after their nursing home admission. 19.3%
In line with Washington average

Washington average: 19.9%

Emergency department visits Info Percentage of short-stay residents who had an outpatient emergency department visit. 7.0%
47% better than Washington average

Washington average: 13.2%

Falls with major injury Info Percentage of SNF residents who experience falls with major injury during their stay. 0.4%
43% better than Washington average

Washington average: 0.8%

Ability to care for self at discharge Info Percentage of residents at or above expected ability to care for themselves at discharge. 53.4%
In line with Washington average

Washington average: 53.7%

Successful return to home or community Info Rate of successful return to home or community from a skilled nursing facility. 60.4%
19% better than Washington average

Washington average: 50.6%

Breakdown by payment type

Medicare

71% of new residents, usually for short-term rehab.

Typical stay 25 days

Private pay

22% of new residents, often for short stays.

Typical stay 1 - 2 months

Medicaid

7% of new residents, often for long-term daily care.

Typical stay 3 years

Facility Characteristics

Source: CMS Long-Term Care Facility Characteristics (Data as of Jan 2026)

Total residents 76
Medicare
26
34.2% of residents
Medicaid
43
56.6% of residents
Private pay or other
7
9.2% of residents
Programs & Services
Residents Group

Residents meet regularly to discuss policies, care quality, and activities

Active Resident Council

Organized group of residents that meets regularly to discuss facility policies, quality of life, and activities.

Finances and operations

Based on CMS SNF Cost Report for fiscal year ending in 12/2023.

Privately-owned community
Operated by a single business entity.
Net patient revenue Info Net patient revenue — what the home actually collects for resident care, after contractual allowances, bad debt and discounts are subtracted from its gross charges (CMS cost report, Worksheet G-3). It covers resident care only; money the home earns from other sources is shown separately as "Other income."
$10.8M
Net patient income Info Net patient income: net patient revenue minus the home's total operating expenses. A positive figure means it earns more from resident care than it spends to deliver it; a negative figure means the opposite. It excludes non-operating "other income."
-$282.4K
Privately-owned community Operated by a single business entity.
Net patient revenue Info Net patient revenue — what the home actually collects for resident care, after contractual allowances, bad debt and discounts are subtracted from its gross charges (CMS cost report, Worksheet G-3). It covers resident care only; money the home earns from other sources is shown separately as "Other income."
$10.8M Rank #62 / 94Revenue — State benchmarkedThis home is ranked 62nd out of 94 homes in Washington. Shows this facility's annual revenue compared to the Washington average. Higher revenue generally means more resources for staffing and capital — read alongside Payroll %.Rankings are based only on facilities in Washington that report data for that category. Facilities without available data are excluded from the ranking.Click the rank badge to see the full State ranking.Click here to see the full State ranking.
Net patient income Info Net patient income: net patient revenue minus the home's total operating expenses. A positive figure means it earns more from resident care than it spends to deliver it; a negative figure means the opposite. It excludes non-operating "other income."
-$282.4K
Other income Info Money the home earns outside of resident care — such as investments, grants, rentals and other non-operating sources (CMS cost report, Worksheet G-3). It is tracked separately from net patient revenue: it is not part of that figure, and it is not included in net patient income.
$728.2K
Payroll costs Info Staff salaries plus wage-related costs — benefits such as payroll taxes, health insurance and retirement — from the home's own accounting records (CMS cost report, Worksheet A). Contract or agency labor is counted separately, under other operating costs. Rank #69 / 94Payroll — State benchmarkedThis home is ranked 69th out of 94 homes in Washington. Shows total annual staff payroll benchmarked to the Washington average. Higher payroll investment relative to peers often signals better staffing and less reliance on cheaper contract labor.Rankings are based only on facilities in Washington that report data for that category. Facilities without available data are excluded from the ranking.Click the rank badge to see the full State ranking.Click here to see the full State ranking.
$5.2M 48.2% of net patient revenue Info Payroll as a share of revenue: staff salaries and wage-related benefits divided by net patient revenue. A higher figure means more of each revenue dollar goes to staff pay. Rank #65 / 94Payroll % — State benchmarkedThis home is ranked 65th out of 94 homes in Washington. Shows payroll as a percentage of revenue versus the Washington average. Well-run Washington facilities typically land around 53–61% — the top third Statewide. Below 25% may signal understaffing or heavy agency use — read with Staffing ratings.Rankings are based only on facilities in Washington that report data for that category. Facilities without available data are excluded from the ranking.Click the rank badge to see the full State ranking.Click here to see the full State ranking.
Other operating costs Info Everything it costs to run the home apart from payroll — food, utilities, supplies, maintenance, contract labor and administration. Calculated as total operating expense minus payroll (staff salaries and wage-related benefits).
$5.9M
Total costs Info The home's total operating expense for the year — all the costs of running it, salaries included (CMS cost report, Worksheet G-3).
$11.1M

What does this home offer?

Building type icon
Building type icon

Building Type: Single-story

Fitness and recreation icon

Fitness and Recreation

Who this home usually serves

TYPE OF STAY

Mostly short-term rehab stays

Most residents typically stay for a few weeks or months before returning home or moving on.

Most new residents arrive under Medicare (71% of admissions), and a typical Medicare stay runs around 25 days.

Admissions
251 total

Coverage residents most often arrive under.

Medicare 71%
Private pay 22%
Medicaid 7%
Discharges
239 total

Coverage residents most often leave under.

Medicare 57%
Private pay 24%
Medicaid 19%

Places of interest near Sequim Health & Rehabilitation

Address 52.9 miles from city center Info Estimated distance in miles from Sequim's city center to Sequim Health & Rehabilitation's address, calculated via Google Maps.

Calculate Travel Distance to Sequim Health & Rehabilitation

Add your location

Address

Compare Nursing Homes around Edmonds

The information below is reported by the Washington Department of Social and Health Services, Residential Care Services.

2 facilities compared · CMS & WA Dept. of Health data

Sequim Health & Rehabilitation
NH
Sequim
100
Facility 100
WA AVG 82
Rank #93 / 366
70.6%
Facility 70.6%
WA AVG 72.5%
Rank #194 / 310
-3%
4.22
Facility 4.22
WA AVG 4.22
Rank #38 / 90
-39%0%
$61.3k
Facility $61.3k
WA AVG $87.7k
Rank #62 / 92
56
Facility 56
WA AVG 48.9
Rank #55 / 92
3.5
Facility 3.5
WA AVG 6.9
Rank #6 / 92
282A+
49
Facility 49
WA AVG 51
Rank #334 / 628
James Aldred
$10.8M
Facility $10.8M
WA AVG $13.2M
Rank #62 / 94
$5.2M
Facility $5.2M
WA AVG $5.7M
Rank #69 / 94
48.2%
Facility 48.2%
WA AVG 45.5%
Rank #65 / 94
505128
Edmonds Care
NH
RC
Edmonds (72Nd Avenue West)
128
Facility 128
WA AVG 82
Rank #32 / 366
63.8%
Facility 63.8%
WA AVG 72.5%
Rank #234 / 310
-12%
4.35
Facility 4.35
WA AVG 4.22
Rank #28 / 90
-13%+3%
$0
Facility $0
WA AVG $87.7k
Rank #1 / 92
97
Facility 97
WA AVG 48.9
Rank #85 / 92
6.1
Facility 6.1
WA AVG 6.9
Rank #41 / 92
194-
61
Facility 61
WA AVG 51
Rank #238 / 628
-
$12.2M
Facility $12.2M
WA AVG $13.2M
Rank #51 / 94
$5.9M
Facility $5.9M
WA AVG $5.7M
Rank #60 / 94
48.3%
Facility 48.3%
WA AVG 45.5%
Rank #60 / 94
505236

Financial Assistance for
Nursing Home in Washington

Sequim Health & Rehabilitation is located in Sequim, Washington.
Here are the financial assistance programs available to residents in Washington.

Get Financial aid guidance

Community Options Program Entry System (COPES)

WA Medicaid COPES

Age 65+ or disabled
General Washington resident, Medicaid-eligible, nursing home-level care need.
Income Limits (2025) ~$2,829/month 300% FBR, individual
Asset Limits $2,000 (individual), $3,000 (couple).
WA

High demand in urban areas (e.g., Seattle).

Benefits
Personal care (5-7 hours/day) Respite (240 hours/year) Adult day care ($70/day) Home modifications ($1,500 avg.)

Washington Family Caregiver Support Program

WA NFCSP

Age Caregiver of someone 60+ (or with dementia)
General Washington resident.
Income Limits No strict limit; prioritizes low-income.
Asset Limits Not applicable.
WA

High urban demand; rural outreach.

Benefits
In-home respite (4-6 hours/day) Adult day care (~$70/day) Short-term facility care (up to 5 days)

Community First Choice (CFC)

Washington Community First Choice

Age 65+ (or disabled 18+)
General WA resident, Medicaid-eligible, need help with 2+ ADLs/IADLs.
Income Limits (2025) ~$2,829/month; QIT optional.
Asset Limits $2,000 (individual), $3,000 (couple).
WA

Broader than COPES; serves ~20,000; self-directed option.

Benefits
Personal care (4-6 hours/day) Respite (~240 hours/year) Assistive devices Training Transportation

Older Americans Act (OAA) Services

Washington OAA Services

Age 60+
General WA resident; no income/asset limits.
Income Limits (2025) None; donations encouraged.
Asset Limits Not assessed.
WA

13 AAAs; includes Meals on Wheels; rural focus.

Benefits
Meals (~$5-$7/meal) Transportation Homemaker services (~4 hours/week) Respite (~5 days/year) Legal aid

Medicare Savings Program (MSP)

Washington Medicare Savings Program

Age 65+ or disabled
General WA resident, Medicare Part A/B.
Income Limits (2025) ~$2,510/month (QMB), ~$3,380/month (SLMB), ~$3,598/month (QI)—individual.
Asset Limits $9,430 (individual), $14,130 (couple).
WA

Includes Extra Help for Part D; no waitlist.

Benefits
Covers Part B premiums ($174.70/month) Deductibles ($240/year) Copays (~20%)

VA Aid and Attendance (A&A) and Housebound Benefits

Washington VA Aid and Attendance/Housebound

Age 65+ or disabled veteran/spouse
General WA resident, wartime service, ADL help (A&A) or homebound.
Income Limits (2025) Net income < ~$1,984/month (veteran with dependent, A&A); pension offsets income.
Asset Limits ~$155,356 net worth
WA

High veteran use; supports rural/urban needs.

Benefits
Cash (~$1,433-$2,642/month veteran, ~$951-$1,318 spouse) for care costs

Senior Citizens Property Tax Exemption

Washington Senior Property Tax Exemption

Age 61+ or disabled retiree
General WA resident, homeowner, income-based.
Income Limits (2025) ~$45,000-$70,000/year varies by county, e.g., King: $70,000
Asset Limits Not assessed; home value cap varies ~$250,000-$400,000
WA

Saves ~$500-$1,500/year; offered statewide.

Benefits
Tax exemption (~$500-$1,500/year depending on county)

Senior Farmers’ Market Nutrition Program (SFMNP)

Washington SFMNP

Age 60+
General WA resident, low-income.
Income Limits (2025) ~$2,322/month 185% FPL
Asset Limits Not assessed.
WA

Vouchers (~$80/season); serves ~20,000 via AAAs.

Benefits
Vouchers (~$80/season) for produce at farmers’ markets

Frequently Asked Questions about Sequim Health & Rehabilitation

Is Sequim Health & Rehabilitation in a walkable area?

Sequim Health & Rehabilitation has a walk score of 49. Somewhat walkable. A few nearby services may be reachable on foot, but most trips require transportation.

What is the occupancy rate at Sequim Health & Rehabilitation?

Sequim Health & Rehabilitation's occupancy is 70.6%.

Are there photos of Sequim Health & Rehabilitation?

Yes — there are 4 photos of Sequim Health & Rehabilitation in the photo gallery on this page.

What is the address of Sequim Health & Rehabilitation?

Sequim Health & Rehabilitation is located at 650 W Hemlock St, Sequim, WA 98382.

What is the phone number of Sequim Health & Rehabilitation?

(360) 582-2400 will put you in contact with the team at Sequim Health & Rehabilitation.

Is Sequim Health & Rehabilitation Medicare or Medicaid certified?

Yes — Sequim Health & Rehabilitation is a CMS-certified provider of Medicare and Medicaid.

Guides for Better Senior Living

Care Cost Calculator: See Prices in Your Area

Nursing Home Data Explorer

Don’t Wait Too Long: 7 Red Flag Signs Your Parent Needs Assisted Living Now

The True Cost of Assisted Living in 2025 – And How Families Are Paying For It

Understanding Senior Living Costs: Pricing Models, Discounts & Financial Assistance