Edward J. Healey Rehabilitation and Nursing Center
CMS overall rating Info CMS (the Centers for Medicare & Medicaid Services) is the federal agency that rates nursing home quality. Its Overall Rating runs from 1 to 5 stars, combining health inspections, staffing, and quality measures, with inspections weighted most heavily.

Edward J. Healey Rehabilitation and Nursing Center

CMS overall rating Info CMS (the Centers for Medicare & Medicaid Services) is the federal agency that rates nursing home quality. Its Overall Rating runs from 1 to 5 stars, combining health inspections, staffing, and quality measures, with inspections weighted most heavily.
Calculator: See prices in your area
Edward J. Healey Rehabilitation and Nursing Center accepts Medicare, Medicaid, and private pay.

Overview of Edward J. Healey Rehabilitation and Nursing Center

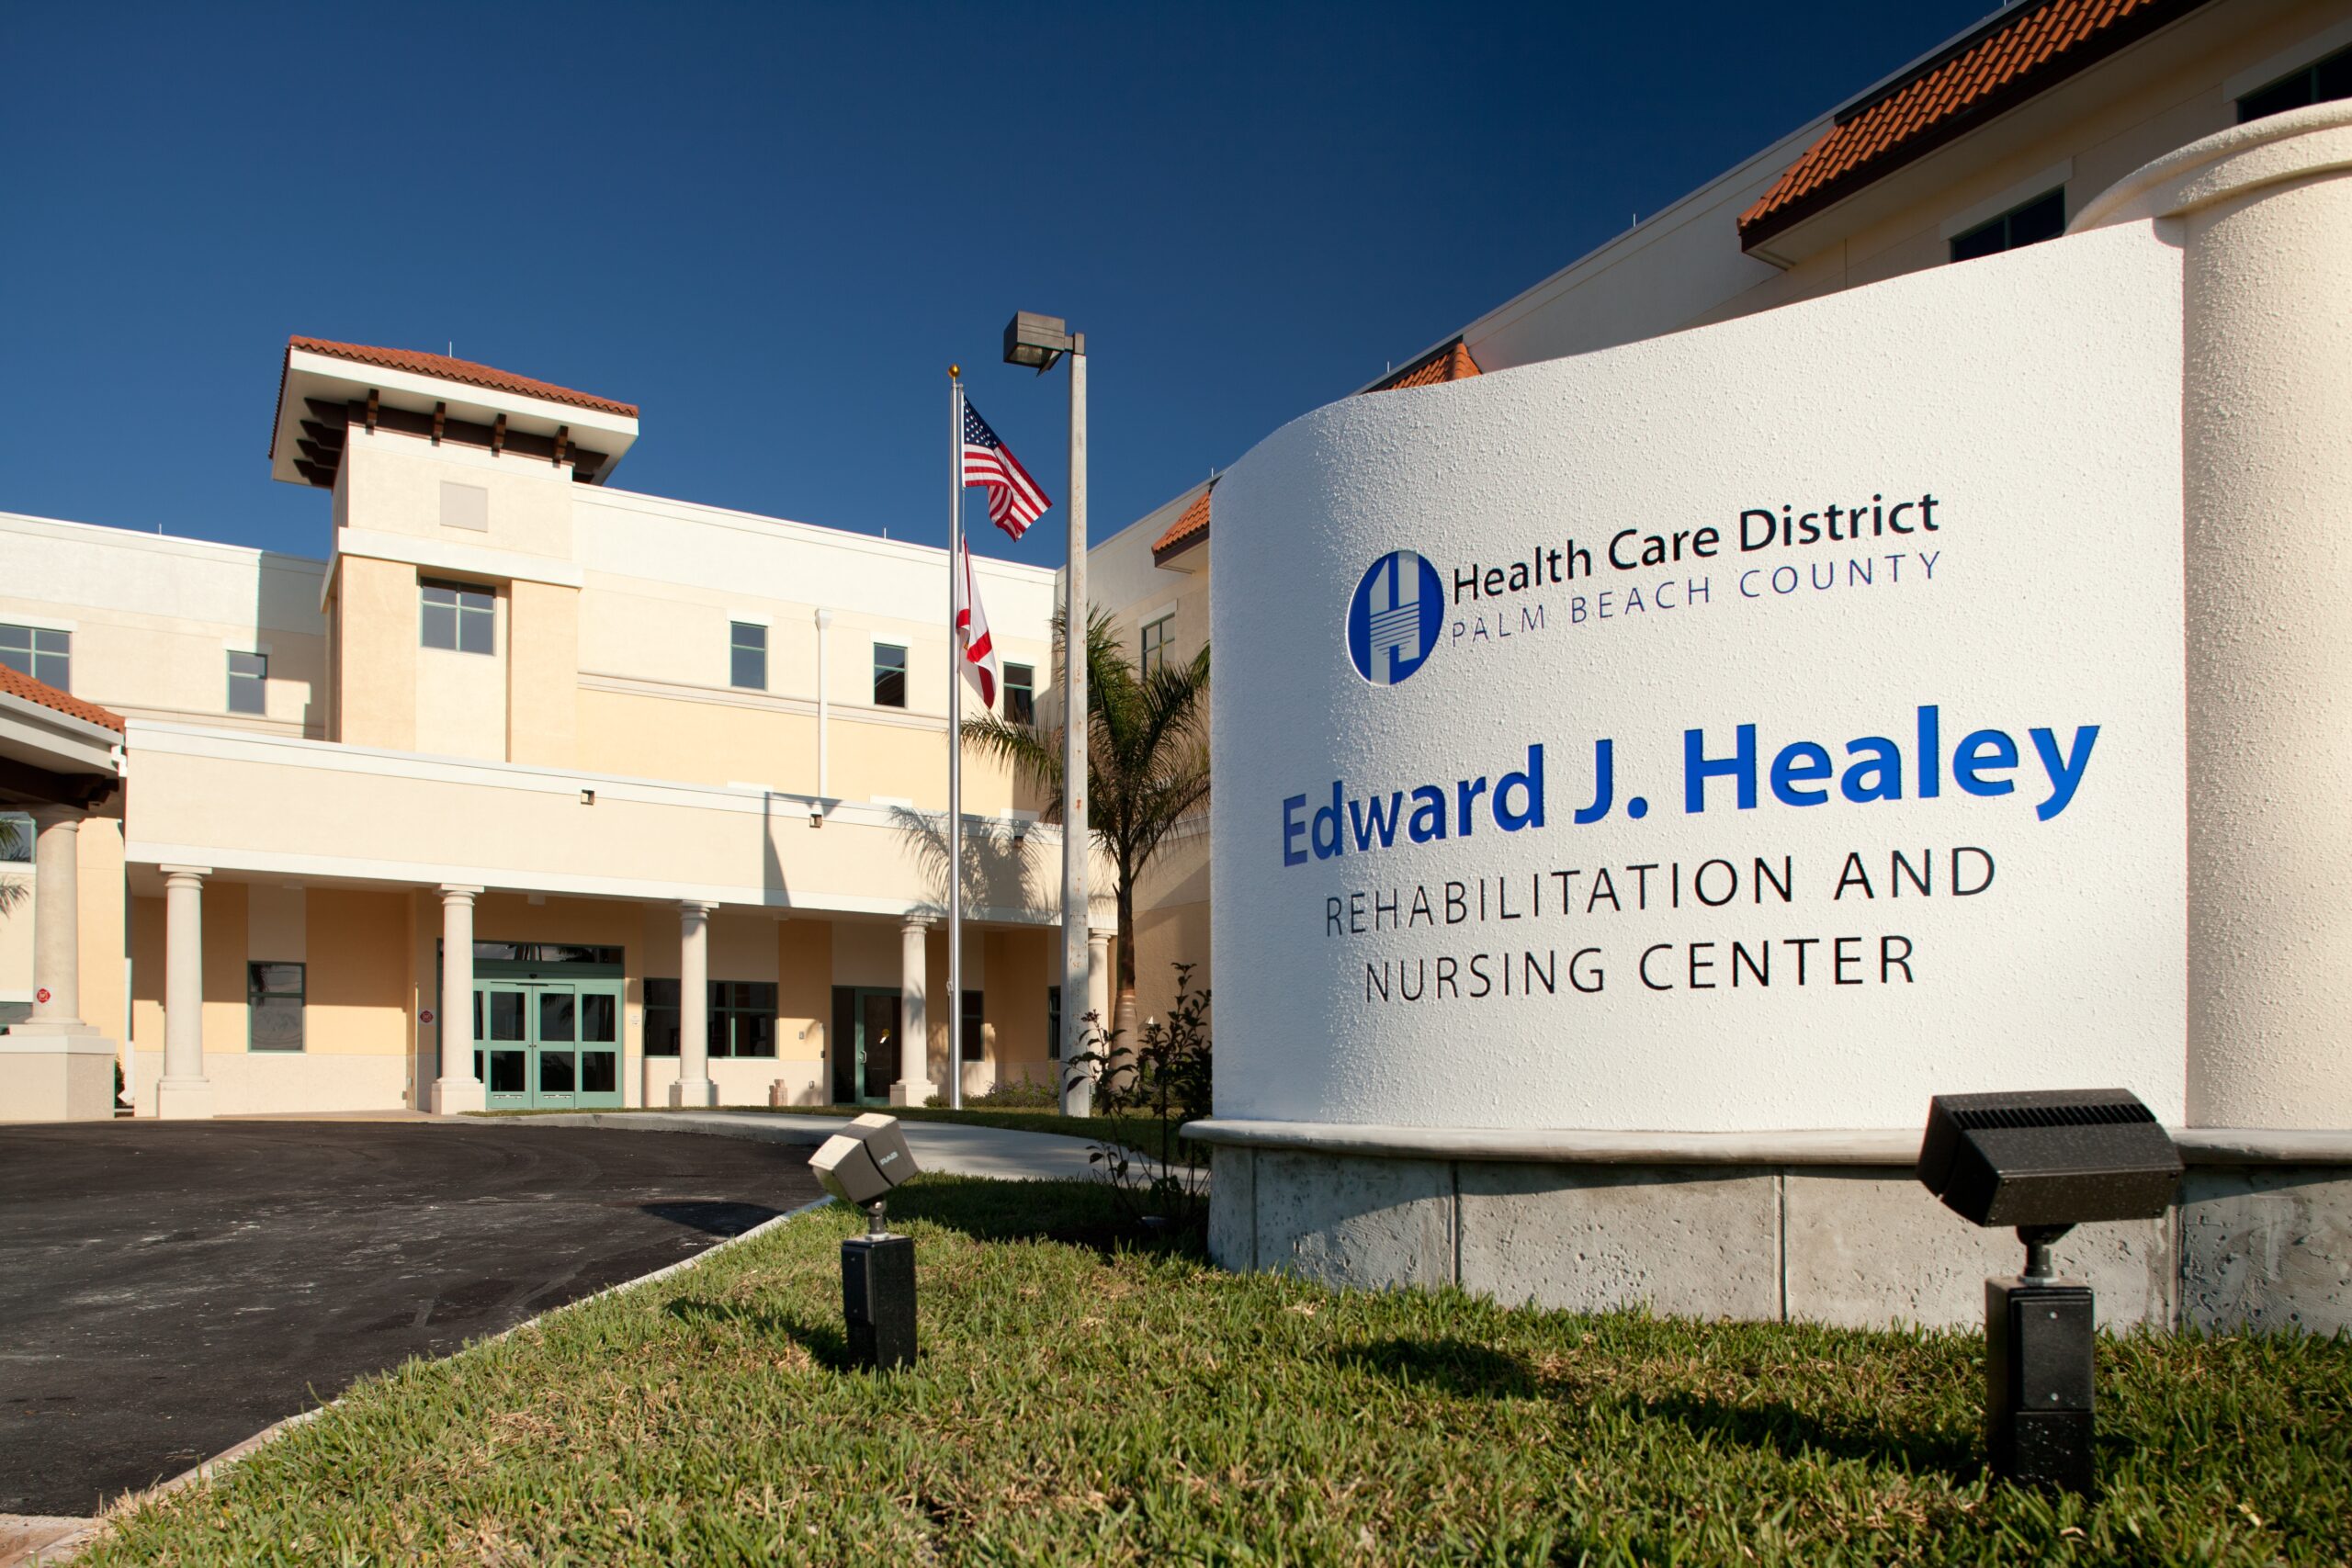
Health Care District of Palm Beach County Skilled Nursing Center is an award-winning community in Riviera Beach, FL, offering excellent skilled nursing care. The community dedicated itself to providing quality and compassionate care to residents living with a chronic condition or recovering from hospitalization. Residents here have access to short-term, long-term rehabilitation, and 24/7 skilled nursing care to ensure their every need is effectively met.

The community also makes sure residents have a vibrant life outside their treatment by offering an array of fun and engaging activities tailored to their interests and skills. Nutrition is also a key component of their care plans, offering residents dietician-approved meals with accommodations to special diets. With 24/7 supervision, a compassionate team of care professionals, and thoughtful wellness amenities, residents here are guaranteed to maintain their well-being and full potential.

Quality ratings

Measured by Centers for Medicare & Medicaid Services (CMS)

Overall rating Info The Overall CMS Rating combines results from health inspections, staffing levels and quality measures. Health inspections carry the most weight. Staffing and quality scores can increase or decrease the final rating based on performance compared to state and national standards.
▲ 57.5% Above FL avg. ▲ 57.5% Above FL avg.FL average: 3.2Click the badge to see the full State ranking.Click here to see the full State ranking.
Health Inspection Info Based on the results of the facility's three most recent standard inspections and any complaint investigations. CMS reviews the number, scope, and severity of deficiencies, with more recent findings weighted more heavily.
▲ 77.8% Above FL avg. ▲ 77.8% Above FL avg.FL average: 2.8Click the badge to see the full State ranking.Click here to see the full State ranking.
Staffing Info Measures average nursing staff hours per resident per day, including Registered Nurses (RNs) and total nursing staff. Ratings are adjusted based on the level of care residents require and are compared to state and national benchmarks.
▲ 47.8% Above FL avg. ▲ 47.8% Above FL avg.FL average: 3.4Click the badge to see the full State ranking.Click here to see the full State ranking.
Quality Measures Info Based on clinical and physical health indicators reported to CMS, such as hospital readmissions, falls, pressure ulcers, and improvements in mobility. These measures reflect how well residents' health needs are being managed.
▲ 23.2% Above FL avg. ▲ 23.2% Above FL avg.FL average: 4.1Click the badge to see the full State ranking.Click here to see the full State ranking.

Staffing hours breakdown

Info Daily nursing hours per resident by staff type, reported to CMS. Higher is generally better — compare this facility to state and national averages to see where staffing stands.

Hours per resident per day — compared to Florida state averages

Total nursing care / resident Info This home is ranked 50th out of 253 homes in Florida for nurse hours. Total adjusted nursing hours per resident per day, combining RN, LPN, and aide time. CMS adjusts this for case-mix so facilities can be fairly compared.
4h 38m per day
Rank #50 / 253Nurse hours — State benchmarkedThis home is ranked 50th out of 253 homes in Florida. Shows adjusted nurse hours per resident per day benchmarked to the Florida average, with a ranking across 253 Florida facilities. More hours mean more direct care. The national average is about 3.5 hrs; below 3.0 is a red flag.Rankings are based only on facilities in Florida that report data for that category. Facilities without available data are excluded from the ranking.Click the rank badge to see the full State ranking.Click here to see the full State ranking.
This facility Florida avg (4h 2m per day)
vs Florida avg
+15%

2 of 6 metrics below state avg

Standout metric Weekend RN is +172% above state avg
Staff typeHours / Day / Residentvs state avg
Registered Nurse (RN) Info RNs hold the highest nursing license and can assess residents, interpret test results, and direct care plans. More RN hours per day often signals stronger clinical oversight and faster response to health changes. 1h 47m per day ▲ 143% State avg: 44m per day · National avg: 41m per day
LPN / LVN Info Licensed Practical Nurses (LPNs) or Licensed Vocational Nurses (LVNs) deliver routine hands-on care — medication administration, wound dressing, and monitoring vital signs. They work under RN supervision and make up a large share of daily bedside care. 3m per day ▼ 94% State avg: 47m per day · National avg: 52m per day
Nurse Aide Info Certified Nurse Aides (CNAs) provide the most direct day-to-day assistance: bathing, dressing, feeding, and mobility. Nurse aide hours are typically the largest staffing category and directly affect residents' quality of life. 3h 26m per day ▲ 47% State avg: 2h 20m per day · National avg: 2h 21m per day
Weekend Total Nursing Info Combined nursing hours (RN + LPN + Nurse Aide) per resident per day on weekends. Staffing often drops on weekends — this figure reveals whether the facility maintains adequate coverage outside of weekday hours. 4h 51m per day ▲ 38% State avg: 3h 31m per day · National avg: 3h 26m per day
Physical Therapist Info Hours per resident per day provided by licensed Physical Therapists (PTs) or PT Assistants. PT services help residents recover mobility after injury or illness and are especially important for post-acute (short-stay) rehabilitation. 3m per day ▼ 34% State avg: 5m per day · National avg: 4m per day
Weekend RN Info Registered nurse hours specifically on weekends. Facilities sometimes reduce RN presence on Saturdays and Sundays — a low weekend RN figure compared to weekday hours can indicate reduced clinical oversight when most administrative staff are absent. 1h 27m per day ▲ 172% State avg: 32m per day · National avg: 29m per day

Capacity and availability

This home is often near full

Higher occupancy than the Florida average: 84.3%
Occupancy rate
96.4% Rank #10 / 258Occupancy rate — State benchmarkedThis home is ranked 10th out of 258 homes in Florida. Shows this facility's occupancy rate versus the Florida average, with its Statewide rank out of 258. Higher occupancy signals strong local demand and financial stability.Rankings are based only on facilities in Florida that report data for that category. Facilities without available data are excluded from the ranking.Click the rank badge to see the full State ranking.Click here to see the full State ranking.
Avg. Length of Stay
132 days
Bed community size
120-bed community Rank #256 / 1074Bed count — State benchmarkedThis home is ranked 256th out of 1074 homes in Florida. Shows this facility's certified or reported bed count compared to other Florida facilities. Larger communities may offer more amenities, programs, and on-site services for residents and families.Rankings are based only on facilities in Florida that report data for that category. Facilities without available data are excluded from the ranking.Click the rank badge to see the full State ranking.Click here to see the full State ranking.
A larger shared setting that may offer more common spaces and organized community services.
Walk Score
Walk Score: 30 / 100 Rank #915 / 1486Walk Score — State benchmarkedThis home is ranked 915th out of 1486 homes in Florida. Shows how walkable this facility's neighborhood is compared to the average Walk Score across Florida facilities. Higher scores benefit residents, families, and staff.Rankings are based only on facilities in Florida that report data for that category. Facilities without available data are excluded from the ranking.Click the rank badge to see the full State ranking.Click here to see the full State ranking.
Somewhat walkable. A few nearby services may be reachable on foot, but most trips require transportation.

Contact Edward J. Healey Rehabilitation and Nursing Center

Staffing Data

Reporting period: October 1 – December 31, 2025 (Q4 2025). Source: CMS Payroll-Based Journal report.

Total staff 134
Employees 128
Contractors 6
Staff to resident ratio 1.40 : 1
5% fewer staff per resident than Florida average
Florida average ratio: 1.47 : 1 Florida average ratio: 1.47 : 1See full Florida ranking
Avg staff/day 74
Average shift 7.8 hours
0% compared with Florida average
Florida average: 7.9 hours Florida average shift: 7.9 hoursSee full Florida ranking
Total staff hours (quarter) 52,790

Nursing staff breakdown

Q4 2025 · Oct 1 – Dec 31 More info This data comes from the CMS Payroll-Based Journal report covering October 1 – December 31, 2025.
Registered Nurse

Manages medical care and health needs.

RN Staff Info All 43 RN Staff are full-time employees. No contractors work on this role. 43
Average shift length Info Average shift length. Calculated as total hours divided by days worked and average staff per day. 7.7 hours
Licensed Practical Nurse

Assists with medical care and medications.

LPN Staff Info All 2 LPN Staff are full-time employees. No contractors work on this role. 2
Average shift length Info Average shift length. Calculated as total hours divided by days worked and average staff per day. 6 hours
Certified Nursing Assistant

Helps with daily care and mobility.

CNA Staff Info All 65 CNA Staff are full-time employees. No contractors work on this role. 65
Average shift length Info Average shift length. Calculated as total hours divided by days worked and average staff per day. 7.9 hours

Contractor staffing

Q4 2025 · Oct 1 – Dec 31 More info This data comes from the CMS Payroll-Based Journal report covering October 1 – December 31, 2025.

Total hours from contractors

1%

507 contractor hours this quarter

Other Physician: 2 Occupational Therapy Aide: 1 Administrator: 1 Occupational Therapy Assistant: 1 Diagnostic X-ray Services Staff: 1

Staff by category

Q4 2025 · Oct 1 – Dec 31 More info This data comes from the CMS Payroll-Based Journal report covering October 1 – December 31, 2025.
Certified Nursing Assistant6506531,01792100%7.9
Registered Nurse4304314,67592100%7.7
Physical Therapy Assistant3031,3426672%7.8
Clinical Nurse Specialist3039766267%8
Speech Language Pathologist2029146571%7.7
Feeding Assistant2028596267%7.8
Occupational Therapy Aide1127006773%7.5
Nurse Practitioner1014966267%8
Respiratory Therapy Technician2024956470%7.4
Administrator1124735863%7.9
Licensed Practical Nurse2024096874%6
Qualified Social Worker2022826065%4.7
Other Physician022612426%2.4
Occupational Therapy Assistant011532830%1.9
Qualified Activities Professional1012744%6.7
Diagnostic X-ray Services Staff0111255%2.4
65 Certified Nursing Assistant
% of Days 100%
43 Registered Nurse
% of Days 100%
3 Physical Therapy Assistant
% of Days 72%
3 Clinical Nurse Specialist
% of Days 67%
2 Speech Language Pathologist
% of Days 71%
2 Feeding Assistant
% of Days 67%
2 Occupational Therapy Aide
% of Days 73%
1 Nurse Practitioner
% of Days 67%
2 Respiratory Therapy Technician
% of Days 70%
2 Administrator
% of Days 63%
2 Licensed Practical Nurse
% of Days 74%
2 Qualified Social Worker
% of Days 65%
2 Other Physician
% of Days 26%
1 Occupational Therapy Assistant
% of Days 30%
1 Qualified Activities Professional
% of Days 4%
1 Diagnostic X-ray Services Staff
% of Days 5%

Penalties and fines

Federal penalties imposed by CMS for regulatory violations, including civil money penalties (fines) and denials of payment for new Medicare/Medicaid admissions.

Source: CMS Penalties Database

No penalties in the past 3 years

No civil money penalties or payment denials were reported in the last 3 years.

Quality of care over time

These measures show how residents usually do over time at this home, based on health outcomes and preventive care.

High-risk clinical events score Info A composite score based on pressure ulcers, falls with injury, weight loss, walking ability decline, and activities of daily living decline. 5.5
25% better than Florida average

Florida average: 7.4

Functional decline score Info A composite score based on activities of daily living decline, walking ability decline, and incontinence. 9.4
24% better than Florida average

Florida average: 12.4

Long-stay resident measures
Significantly above average Florida avg: 4.5 Info CMS star rating based on long-stay quality measure performance. 5 stars = significantly above average, 1 star = significantly below average.
Need for Help with Daily Activities Increased Info Percent of long-stay residents whose need for help with daily activities has increased 6.1%
42% better than Florida average

Florida average: 10.5%

Walking Ability Worsened Info Percent of long-stay residents whose ability to move independently worsened 15.5%
20% worse than Florida average

Florida average: 12.9%

Low Risk Residents with Bowel/Bladder Incontinence Info Percent of low risk long-stay residents who lose control of their bowels or bladder 6.8%
50% better than Florida average

Florida average: 13.5%

Falls with Major Injury Info Percent of long-stay residents experiencing one or more falls with major injury 0.8%
71% better than Florida average

Florida average: 2.6%

High Risk Residents with Pressure Ulcers Info Percent of long-stay high risk residents with pressure ulcers 3.8%
30% better than Florida average

Florida average: 5.4%

Urinary Tract Infection Info Percent of long-stay residents with a urinary tract infection 0.8%
13% better than Florida average

Florida average: 0.9%

Lost Too Much Weight Info Percent of long-stay residents who lose too much weight 1.6%
73% better than Florida average

Florida average: 6.0%

Depressive Symptoms Info Percent of long-stay residents who have depressive symptoms 0.0%
100% better than Florida average

Florida average: 3.3%

Antipsychotic Use Info Percent of long-stay residents who received an antipsychotic medication 8.4%
5% worse than Florida average

Florida average: 8.0%

Pneumococcal Vaccine Info Percent of long-stay residents assessed and appropriately given the pneumococcal vaccine 99.5%
In line with Florida average

Florida average: 97.7%

Influenza Vaccine Info Percent of long-stay residents assessed and appropriately given the seasonal influenza vaccine 100.0%
In line with Florida average

Florida average: 99.2%

Hospitalizations per 1,000 days Info Number of hospitalizations per 1,000 long-stay resident days. 2.50
19% worse than Florida average

Florida average: 2.10

ED visits per 1,000 days Info Number of outpatient emergency department visits per 1,000 long-stay resident days. 0.74
37% better than Florida average

Florida average: 1.18

Short-stay resident measures
Pneumococcal Vaccine Info Percent of short-stay residents assessed and appropriately given the pneumococcal vaccine 82.6%
12% worse than Florida average

Florida average: 94.0%

Breakdown by payment type

Medicare

3% of new residents, usually for short-term rehab.

Typical stay 3 years

Private pay

95% of new residents, often for short stays.

Typical stay 3 years

Medicaid

3% of new residents, often for long-term daily care.

Typical stay 11 - 12 months

Facility Characteristics

Source: CMS Long-Term Care Facility Characteristics (Data as of Jan 2026)

Total residents 96
Medicare
1
1% of residents
Medicaid
60
62.5% of residents
Private pay or other
35
36.5% of residents
Programs & Services
Residents Group

Residents meet regularly to discuss policies, care quality, and activities

Active Resident Council

Organized group of residents that meets regularly to discuss facility policies, quality of life, and activities.

Finances and operations

Based on CMS SNF Cost Report for fiscal year ending in 09/2023.

Government
Operated by federal authorities.
Net patient revenue Info Net patient revenue — what the home actually collects for resident care, after contractual allowances, bad debt and discounts are subtracted from its gross charges (CMS cost report, Worksheet G-3). It covers resident care only; money the home earns from other sources is shown separately as "Other income."
$9.1M
Net patient income Info Net patient income: net patient revenue minus the home's total operating expenses. A positive figure means it earns more from resident care than it spends to deliver it; a negative figure means the opposite. It excludes non-operating "other income."
-$16.7M
Government Operated by federal authorities.
Net patient revenue Info Net patient revenue — what the home actually collects for resident care, after contractual allowances, bad debt and discounts are subtracted from its gross charges (CMS cost report, Worksheet G-3). It covers resident care only; money the home earns from other sources is shown separately as "Other income."
$9.1M Rank #43 / 257Revenue — State benchmarkedThis home is ranked 43rd out of 257 homes in Florida. Shows this facility's annual revenue compared to the Florida average. Higher revenue generally means more resources for staffing and capital — read alongside Payroll %.Rankings are based only on facilities in Florida that report data for that category. Facilities without available data are excluded from the ranking.Click the rank badge to see the full State ranking.Click here to see the full State ranking.
Net patient income Info Net patient income: net patient revenue minus the home's total operating expenses. A positive figure means it earns more from resident care than it spends to deliver it; a negative figure means the opposite. It excludes non-operating "other income."
-$16.7M
Other income Info Money the home earns outside of resident care — such as investments, grants, rentals and other non-operating sources (CMS cost report, Worksheet G-3). It is tracked separately from net patient revenue: it is not part of that figure, and it is not included in net patient income.
$16.7M
Payroll costs Info Staff salaries plus wage-related costs — benefits such as payroll taxes, health insurance and retirement — from the home's own accounting records (CMS cost report, Worksheet A). Contract or agency labor is counted separately, under other operating costs. Rank #19 / 257Payroll — State benchmarkedThis home is ranked 19th out of 257 homes in Florida. Shows total annual staff payroll benchmarked to the Florida average. Higher payroll investment relative to peers often signals better staffing and less reliance on cheaper contract labor.Rankings are based only on facilities in Florida that report data for that category. Facilities without available data are excluded from the ranking.Click the rank badge to see the full State ranking.Click here to see the full State ranking.
$18.0M 197.5% of net patient revenue Info Payroll as a share of revenue: staff salaries and wage-related benefits divided by net patient revenue. A higher figure means more of each revenue dollar goes to staff pay. Rank #22 / 257Payroll % — State benchmarkedThis home is ranked 22nd out of 257 homes in Florida. Shows payroll as a percentage of revenue versus the Florida average. Well-run Florida facilities typically land around 49–56% — the top third Statewide. Below 25% may signal understaffing or heavy agency use — read with Staffing ratings.Rankings are based only on facilities in Florida that report data for that category. Facilities without available data are excluded from the ranking.Click the rank badge to see the full State ranking.Click here to see the full State ranking.
Other operating costs Info Everything it costs to run the home apart from payroll — food, utilities, supplies, maintenance, contract labor and administration. Calculated as total operating expense minus payroll (staff salaries and wage-related benefits).
$7.8M
Total costs Info The home's total operating expense for the year — all the costs of running it, salaries included (CMS cost report, Worksheet G-3).
$25.8M

What does this home offer?

Housing options icon

Housing Options: Studio / 1 Bed / Private Rooms

Building type icon
Building type icon

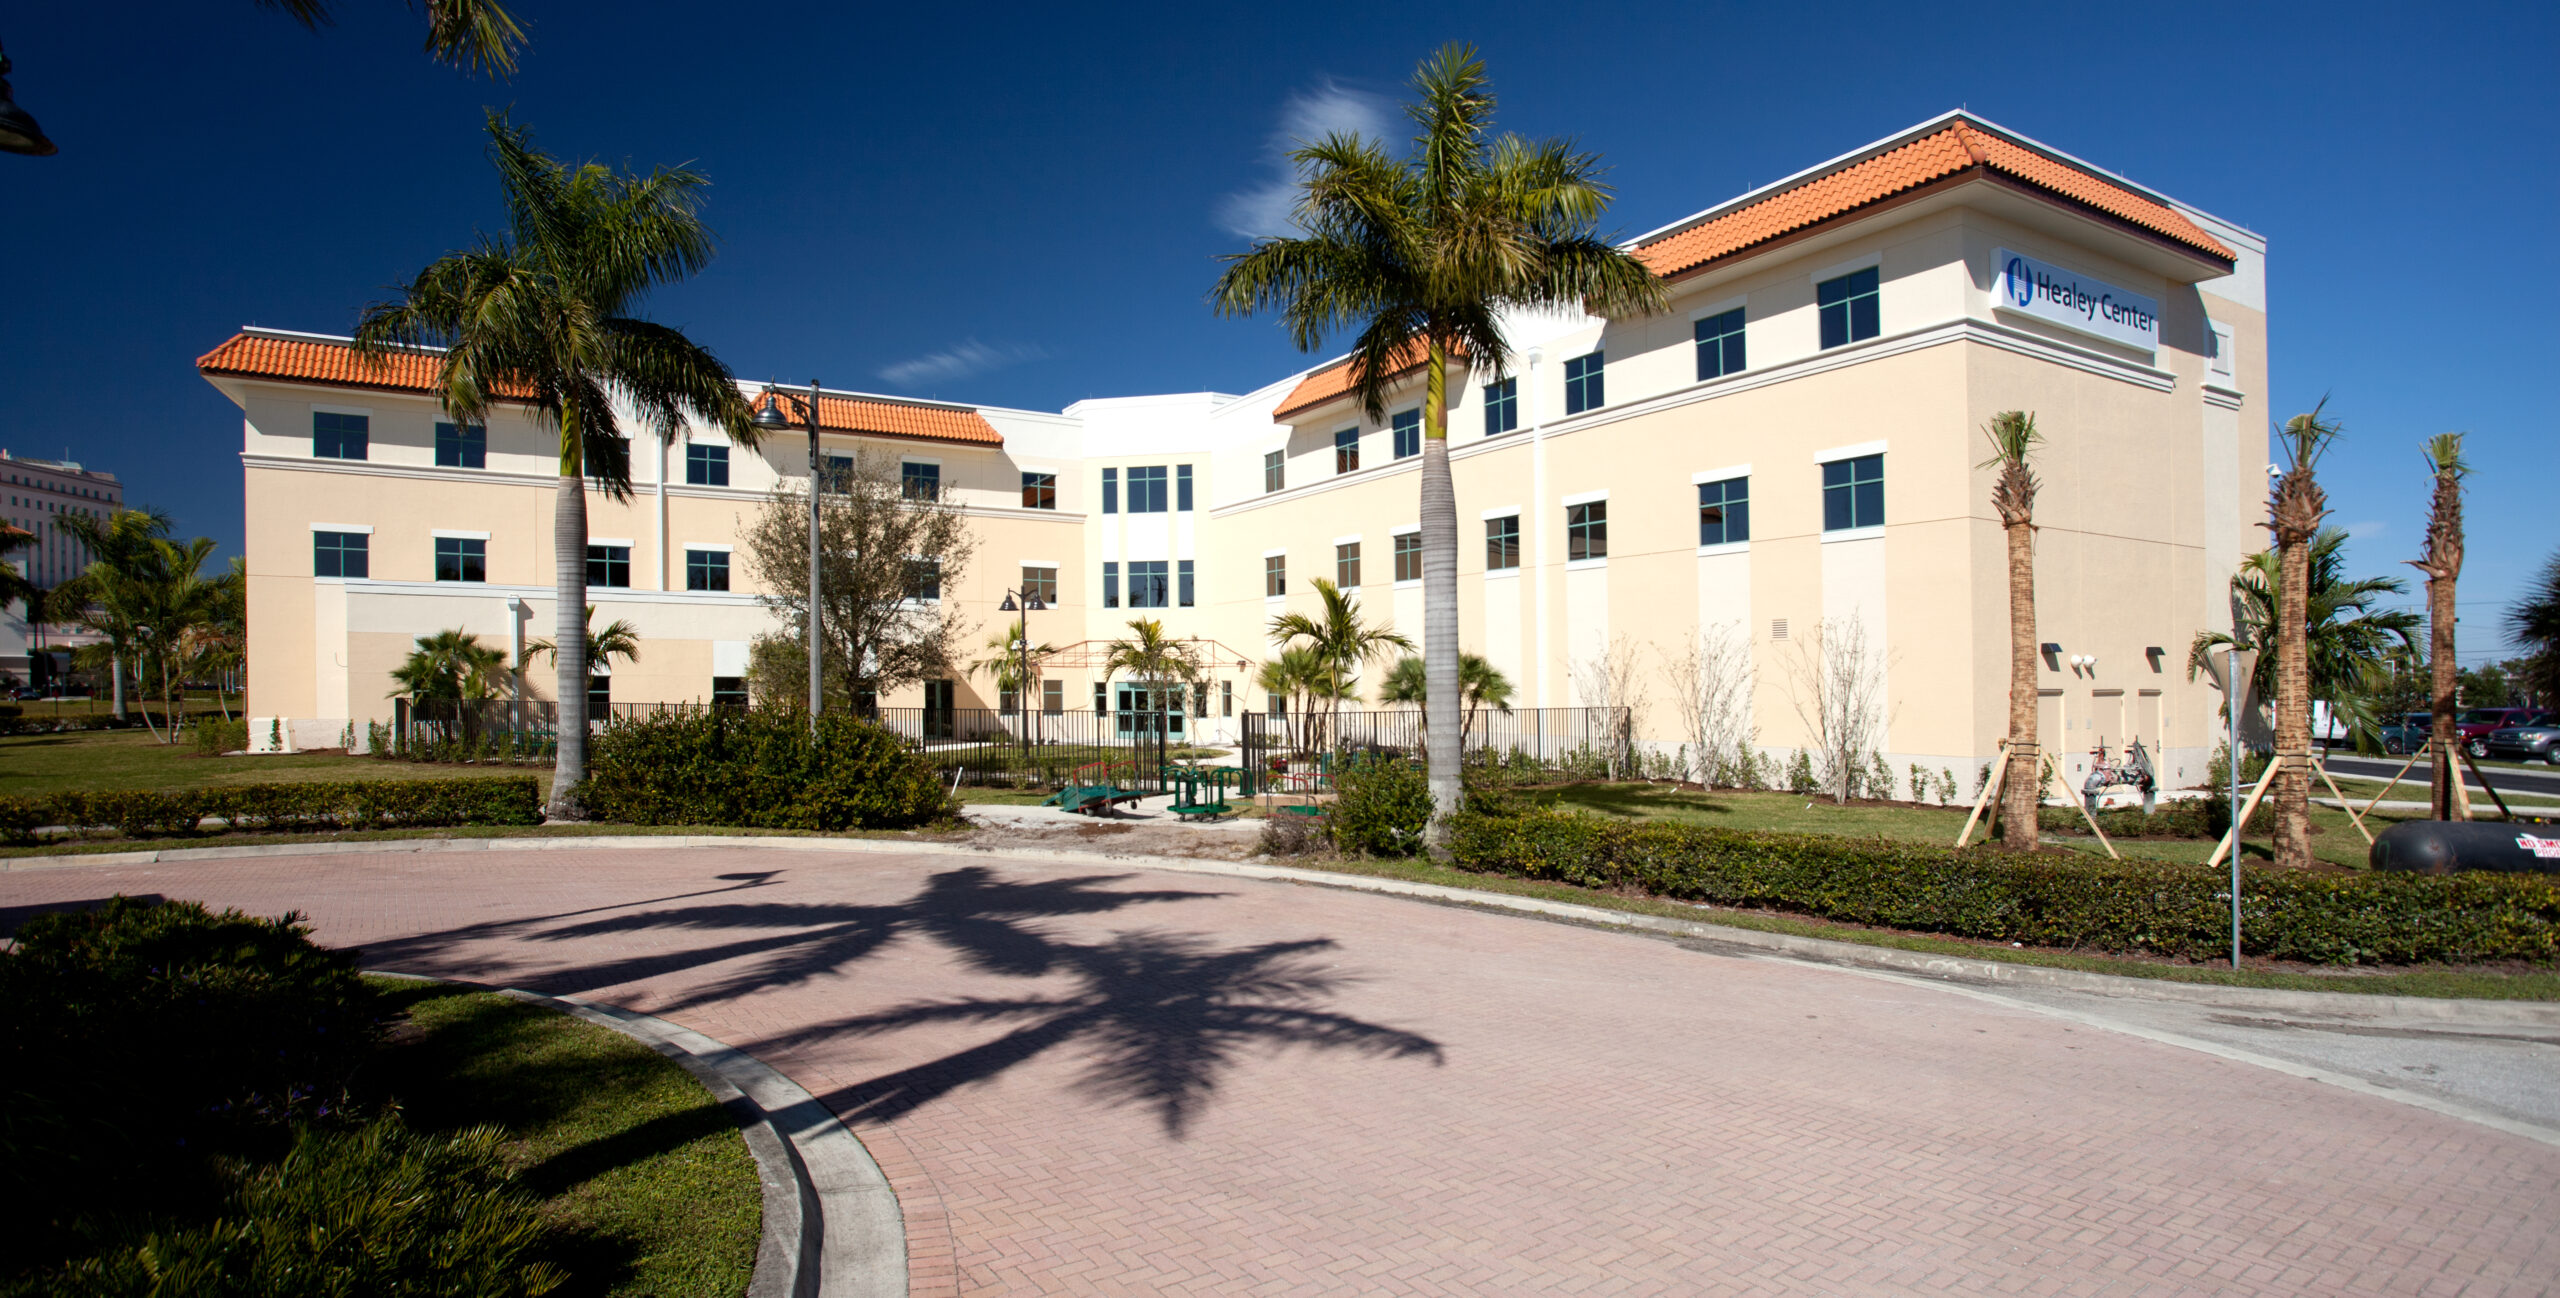
Building Type: 2-story

Health Programs icon

Health Programs

Who this home usually serves

TYPE OF STAY

Mix of rehab and long-term care

This home supports both short-term rehab and long-term care, with residents staying for a wide range of durations.

Most new residents arrive under private pay (95% of admissions), and a typical private pay stay runs around 3 years.

Admissions
39 total

Coverage residents most often arrive under.

Medicare 3%
Private pay 95%
Medicaid 3%
Discharges
320 total

Coverage residents most often leave under.

Medicare 6%
Private pay 88%
Medicaid 6%

Places of interest near Edward J. Healey Rehabilitation and Nursing Center

Address 3.1 miles from city center Info Estimated distance in miles from Riviera Beach's city center to Edward J. Healey Rehabilitation and Nursing Center's address, calculated via Google Maps.

Calculate Travel Distance to Edward J. Healey Rehabilitation and Nursing Center

Add your location

Address

Compare Nursing Homes around Palm Beach County

The information below is reported by the Florida Agency for Health Care Administration (AHCA).

3 facilities compared · CMS & FL Dept. of Health data

Edward J. Healey Rehabilitation and Nursing Center
NH
Riviera Beach
120
Facility 120
FL AVG 89
Rank #256 / 1074
96.4%
Facility 96.4%
FL AVG 84.3%
Rank #10 / 258
+14%
4.63
Facility 4.63
FL AVG 4.04
Rank #50 / 253
+166%+15%
$0
Facility $0
FL AVG $78.9k
Rank #1 / 258
-
2
Facility 2
FL AVG 19.7
Rank #3 / 252
1.0
Facility 1.0
FL AVG 4.5
Rank #1 / 252
-98-
30
Facility 30
FL AVG 40
Rank #915 / 1486
Candice Abbott
$9.1M
Facility $9.1M
FL AVG $15.7M
Rank #43 / 257
$18.0M
Facility $18.0M
FL AVG $6.1M
Rank #19 / 257
197.5%
Facility 197.5%
FL AVG 39.8%
Rank #22 / 257
105838
Palm Beach Nursing Center
NH
HC
PC
Lake Worth Beach (Lake Worth Corridor)
120
Facility 120
FL AVG 89
Rank #256 / 1074
64.0%
Facility 64.0%
FL AVG 84.3%
Rank #239 / 258
-24%
3.46
Facility 3.46
FL AVG 4.04
Rank #216 / 253
-36%-14%
$44.8k
Facility $44.8k
FL AVG $78.9k
Rank #216 / 258
-
29
Facility 29
FL AVG 19.7
Rank #205 / 252
7.3
Facility 7.3
FL AVG 4.5
Rank #224 / 252
-115-
55
Facility 55
FL AVG 40
Rank #426 / 1486
Palm Beach Nursing Member LLC
$12.2M
Facility $12.2M
FL AVG $15.7M
Rank #179 / 257
$5.5M
Facility $5.5M
FL AVG $6.1M
Rank #178 / 257
45.1%
Facility 45.1%
FL AVG 39.8%
Rank #106 / 257
105466
Darcy Hall of Life Care
NH
MC
West Palm Beach (Palm Beach Lakes)
220
Facility 220
FL AVG 89
Rank #28 / 1074
88.0%
Facility 88.0%
FL AVG 84.3%
Rank #145 / 258
+4%
4.08
Facility 4.08
FL AVG 4.04
Rank #91 / 253
+57%+1%
$30.9k
Facility $30.9k
FL AVG $78.9k
Rank #210 / 258
-
26
Facility 26
FL AVG 19.7
Rank #187 / 252
3.7
Facility 3.7
FL AVG 4.5
Rank #94 / 252
2181-
66
Facility 66
FL AVG 40
Rank #262 / 1486
Lisa Izquierdo
$16.6M
Facility $16.6M
FL AVG $15.7M
Rank #50 / 257
$10.8M
Facility $10.8M
FL AVG $6.1M
Rank #59 / 257
65%
Facility 65%
FL AVG 39.8%
Rank #188 / 257
105516

Financial Assistance for
Nursing Home in Florida

Edward J. Healey Rehabilitation and Nursing Center is located in Riviera Beach, Florida.
Here are the financial assistance programs available to residents in Florida.

Get Financial aid guidance

Long-Term Care Waiver

Florida Medicaid LTC Waiver

Age 65+ or 21+ disabled
General Florida resident, Medicaid- eligible, nursing home-level care need.
Income Limits (2025) ~$2,829/month 300% FBR, individual
Asset Limits $2,000 (individual), $3,000 (couple).
FL

High demand; waitlists common.

Benefits
In-home care (6-8 hours/day) Assisted living Respite (240 hours/year) Case management

Community Care for the Elderly (CCE)

Florida CCE

Age 60+
General Florida resident, at risk of nursing home.
Income Limits ~$2,000/month varies
Asset Limits $5,000 individual
FL

Limited funding; regional variation.

Benefits
Homemaker services (3-5 hours/week) Adult day care (~$60/day) Respite (up to 10 days/year)

Home Care for the Elderly (HCE)

Florida Home Care for the Elderly

Age 60+
General Florida resident, at risk of nursing home placement; caregiver must be approved.
Income Limits (2025) ~$2,829/month individual, aligned with Medicaid thresholds
Asset Limits ~$2,000 (individual); varies by case manager discretion.
FL

Limited funding (~3,500 served annually); prioritizes low-income frail seniors.

Benefits
Basic subsidy (~$160/month) for housing/medical costs; special subsidies for supplies/services (e.g., incontinence supplies, ~$50-$200/month)

Program of All-Inclusive Care for the Elderly (PACE)

Florida Medicaid PACE

Age 55+
General Florida resident, nursing home-level care need, safe with PACE support.
Income Limits (2025) ~$2,829/month 300% FBR
Asset Limits $2,000 (individual), $3,000 (couple).
FL

Limited to specific counties (e.g., Hillsborough, Miami-Dade); ~10 sites statewide.

Benefits
Personal care (5-7 hours/day) Medical care Meals Transportation Therapy

Optional State Supplementation (OSS)

Florida Optional State Supplementation

Age 65+ or disabled
General Florida resident, living in approved facility, receiving SSI or low-income.
Income Limits (2025) ~$1,004/month individual, including SSI
Asset Limits $2,000 (individual), $3,000 (couple).
FL

Limited to specific facility types; ~$78.40/month max supplement.

Benefits
Cash payment (~$78.40/month) for room/board or personal needs in facilities

Frequently Asked Questions about Edward J. Healey Rehabilitation and Nursing Center

What neighborhood is Edward J. Healey Rehabilitation and Nursing Center in?

Edward J. Healey Rehabilitation and Nursing Center is in the Riviera Beach neighborhood.

Is Edward J. Healey Rehabilitation and Nursing Center in a walkable area?

Edward J. Healey Rehabilitation and Nursing Center has a walk score of 30. Somewhat walkable. A few nearby services may be reachable on foot, but most trips require transportation.

What is the occupancy rate at Edward J. Healey Rehabilitation and Nursing Center?

Edward J. Healey Rehabilitation and Nursing Center's occupancy is 96.4%.

Is Edward J. Healey Rehabilitation and Nursing Center a government-operated facility?

Edward J. Healey Rehabilitation and Nursing Center is a government-operated nursing facility.

Are there photos of Edward J. Healey Rehabilitation and Nursing Center?

Yes — there are 4 photos of Edward J. Healey Rehabilitation and Nursing Center in the photo gallery on this page.

What is the address of Edward J. Healey Rehabilitation and Nursing Center?

Edward J. Healey Rehabilitation and Nursing Center is located at 5101 W Blue Heron Blvd, Riviera Beach, FL 33418.

What is the phone number of Edward J. Healey Rehabilitation and Nursing Center?

(561) 842-6111 will put you in contact with the team at Edward J. Healey Rehabilitation and Nursing Center.

Guides for Better Senior Living

Care Cost Calculator: See Prices in Your Area

Nursing Home Data Explorer

Don’t Wait Too Long: 7 Red Flag Signs Your Parent Needs Assisted Living Now

The True Cost of Assisted Living in 2025 – And How Families Are Paying For It

Understanding Senior Living Costs: Pricing Models, Discounts & Financial Assistance