Explore Open Rooms

1 Contact details
2 What type of senior care service are you looking for?
3 What budget do you have in mind for senior care?
4 How soon do you need to find care?
5 Additional details

Thank you for your interest!

Our team will be in touch shortly to help with next steps.

Nursing Home

Elevate Care South Holland

Nursing Home

Elevate Care South Holland

16300 Wausau Ave, South Holland, IL 60473 View map
Overview of Elevate Care South Holland

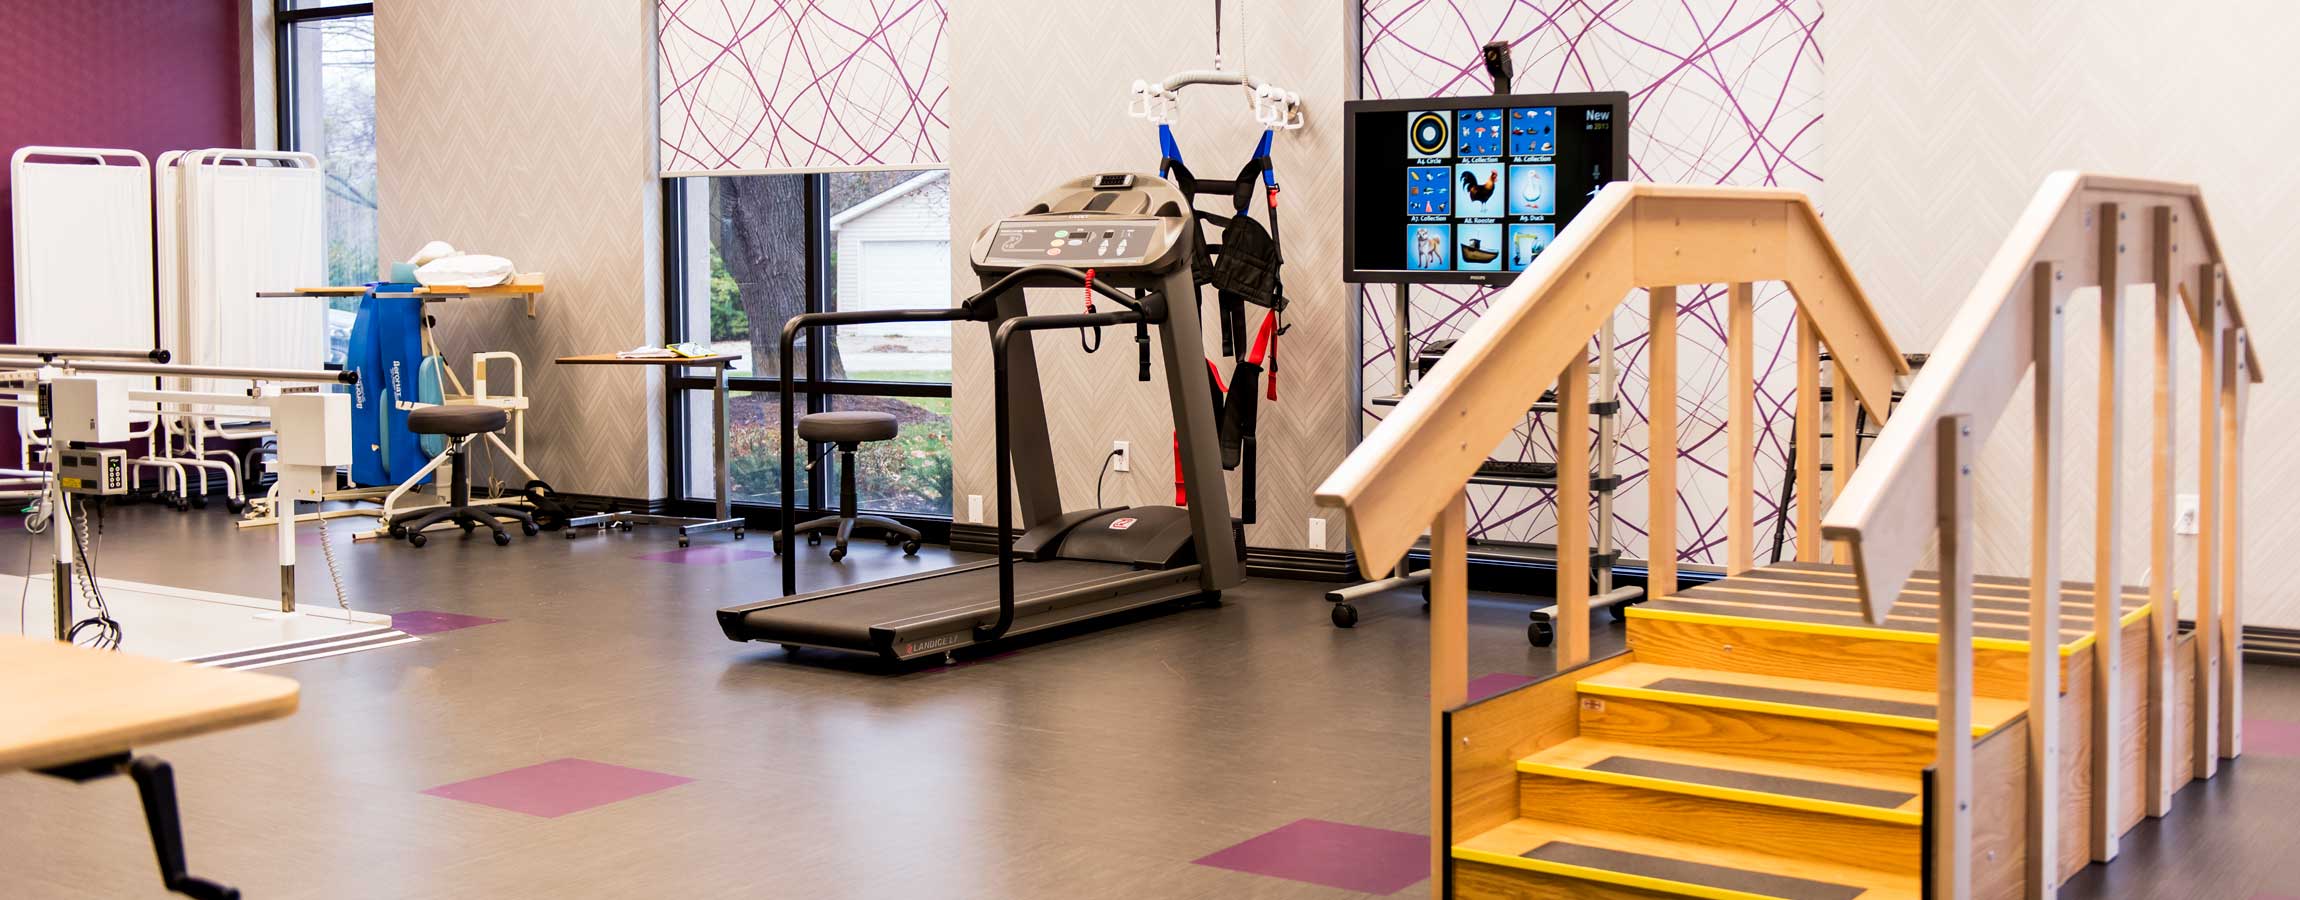
Elevate Care South Holland is an esteemed senior living community located in the peaceful residential grounds of Wausau Avenue, South Holland, IL, providing a wide range of care services including skilled nursing, respiratory care, chronic disease management, comprehensive rehab, wound care, and memory care. The community also offers in-house dialysis for seniors who require it to ensure their convenience. A team of compassionate and well-trained professionals cares for seniors’ special needs and aspirations to ensure they thrive and live their lives to the fullest.

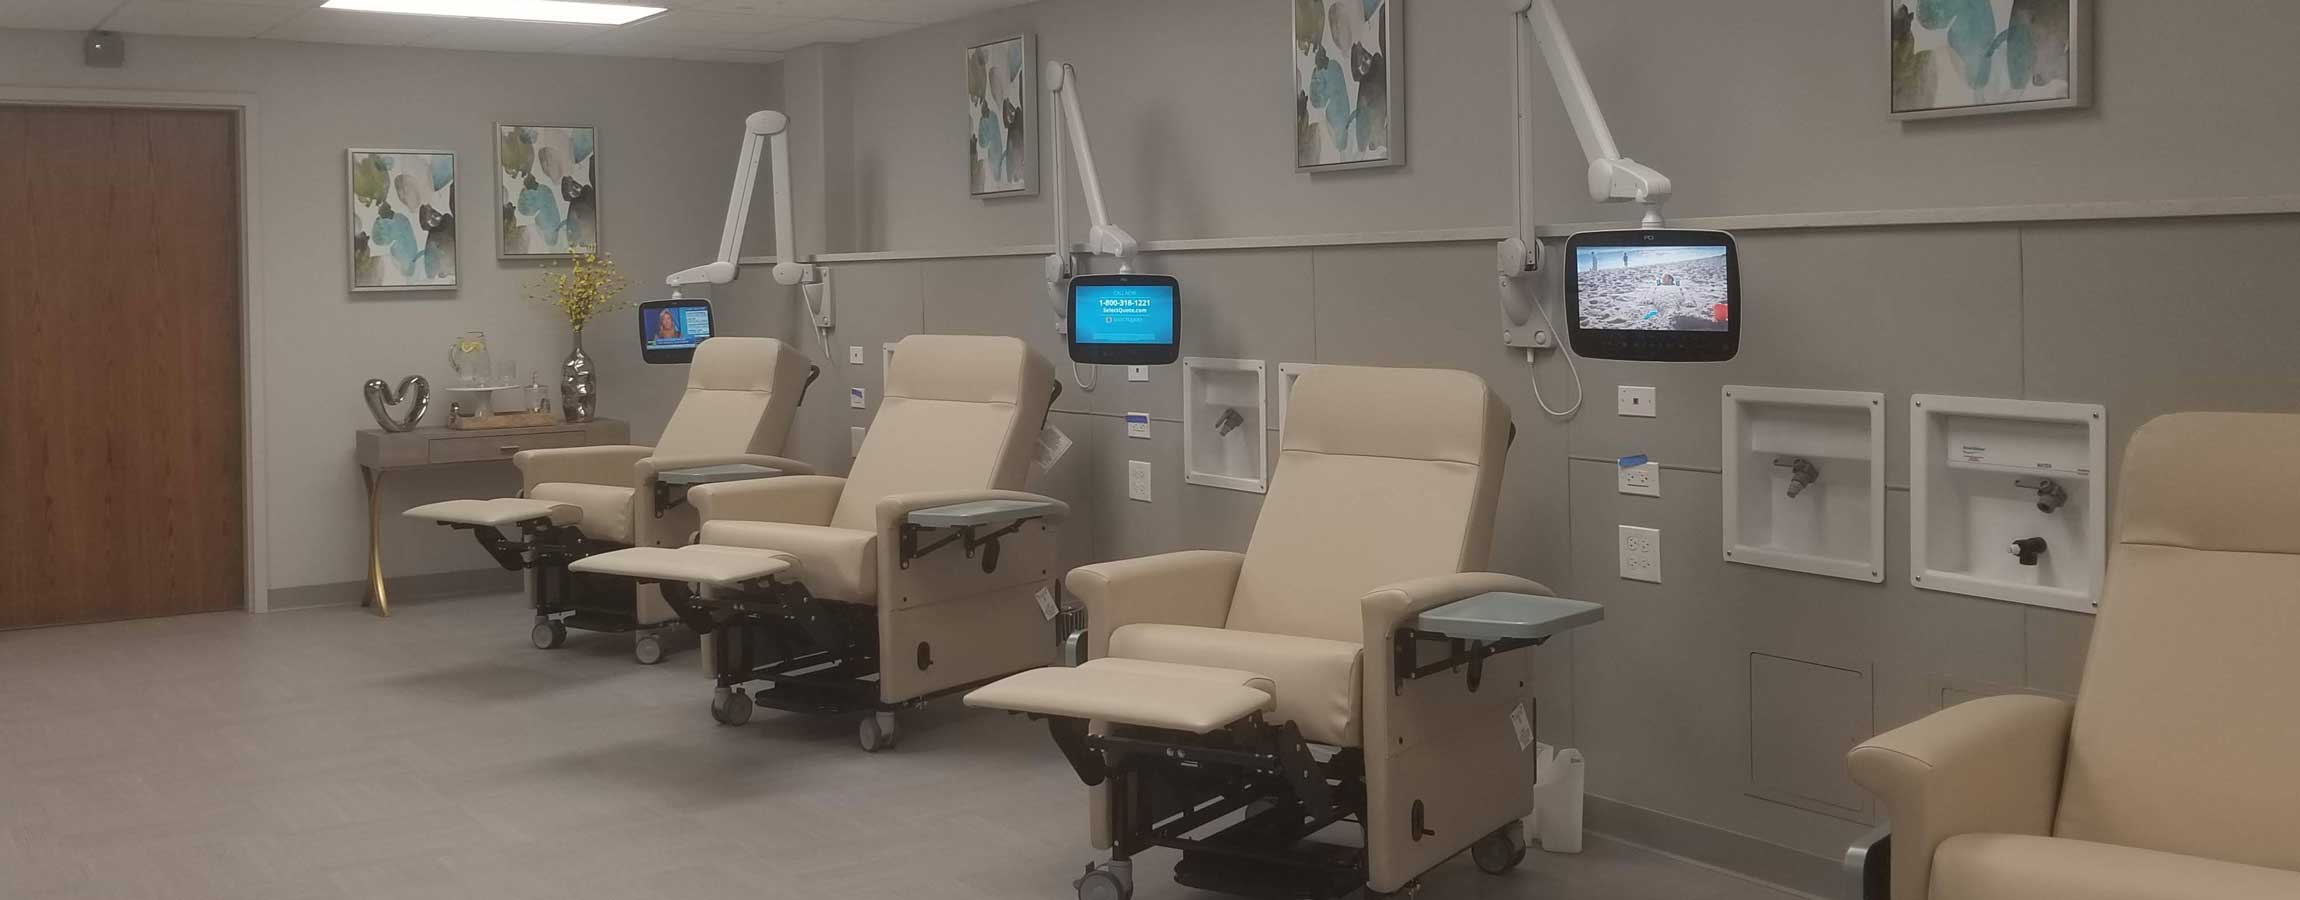
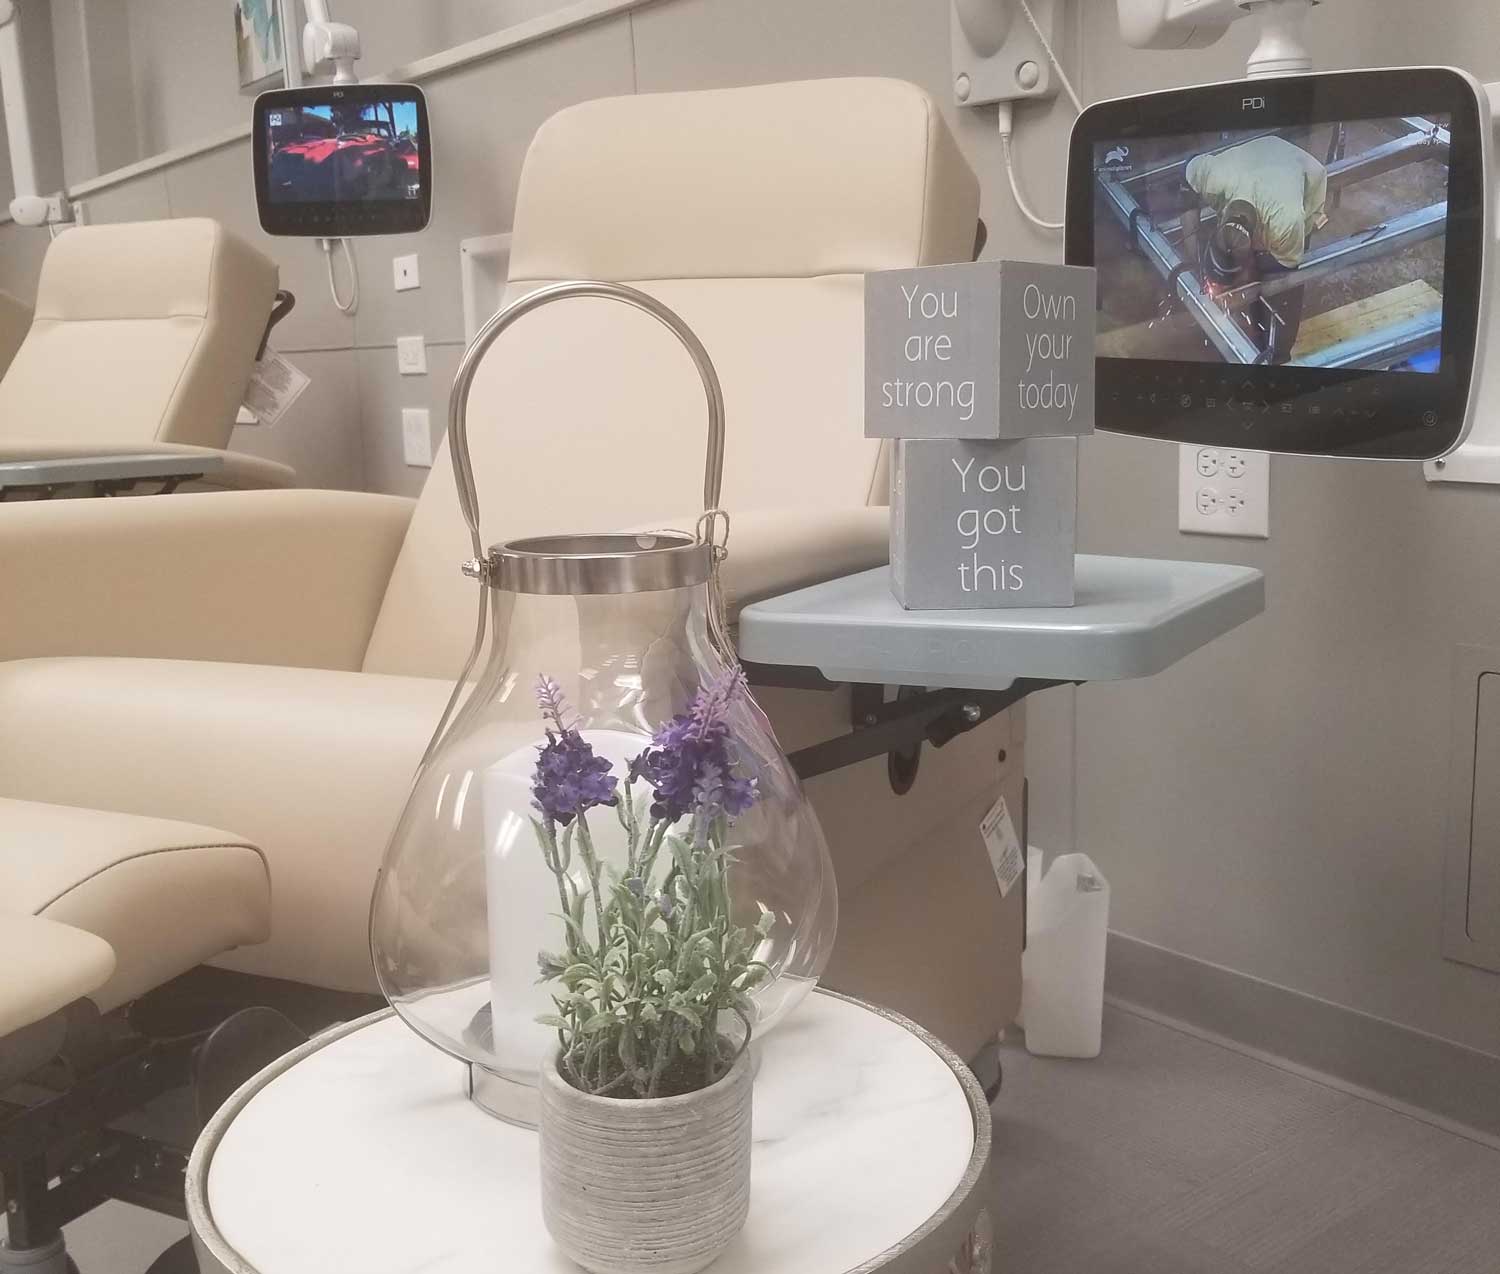
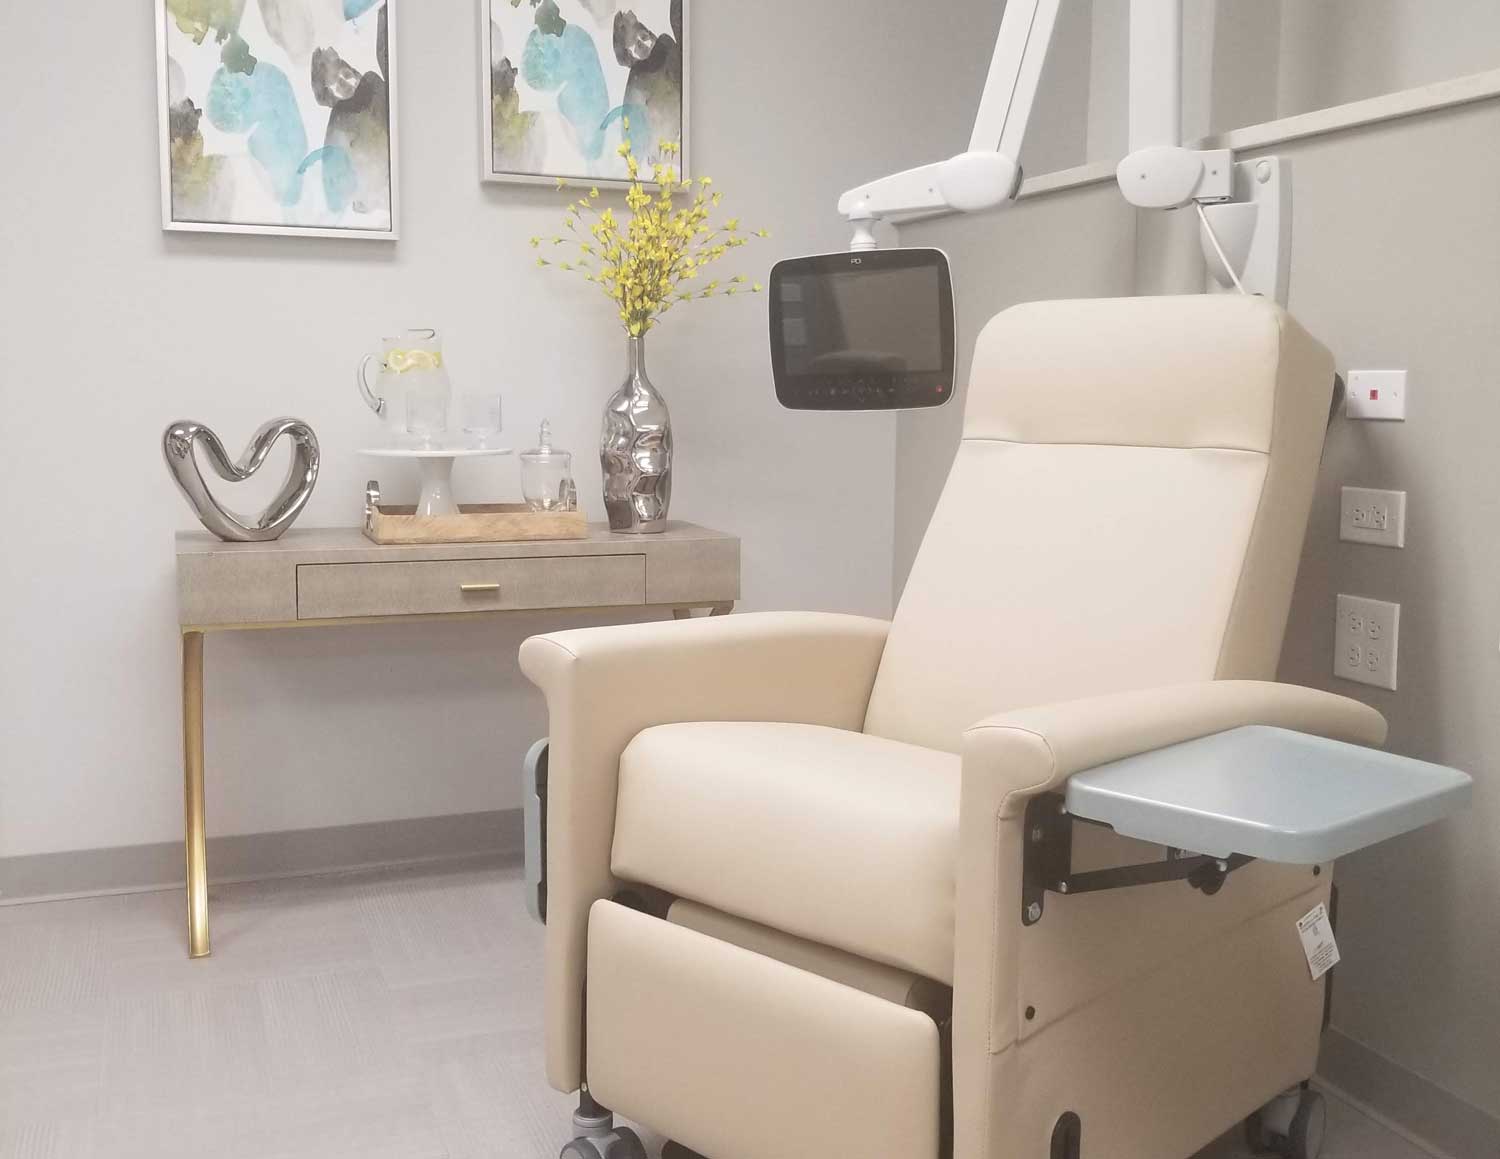
The community promotes a bright and friendly environment, encouraging residents to mingle with friends and maintain an active lifestyle. Here, families can rest their minds knowing their loved ones are well-cared for. Elevate Care South Holland is a good place for seniors to make every moment of their best years count.

Quality ratings

Measured by Centers for Medicare & Medicaid Services (CMS)

Overall rating Info The Overall CMS Rating combines results from health inspections, staffing levels and quality measures. Health inspections carry the most weight. Staffing and quality scores can increase or decrease the final rating based on performance compared to state and national standards.
1/5
Illinois average: 2.5/5
Health Inspection Info Based on the results of the facility's three most recent standard inspections and any complaint investigations. CMS reviews the number, scope, and severity of deficiencies, with more recent findings weighted more heavily.
2/5
Illinois average: 2.8/5
Staffing Info Measures average nursing staff hours per resident per day, including Registered Nurses (RNs) and total nursing staff. Ratings are adjusted based on the level of care residents require and are compared to state and national benchmarks.
1/5
Illinois average: 2.1/5
Quality Measures Info Based on clinical and physical health indicators reported to CMS, such as hospital readmissions, falls, pressure ulcers, and improvements in mobility. These measures reflect how well residents' health needs are being managed.
4/5
Illinois average: 2.8/5

Nursing care per resident

Info This shows how many total hours of nursing staff time are available per resident each day. Higher numbers usually mean more staff support.
2h 26m per day

This home provides 21% less nursing time per resident than the Illinois average.

Illinois average: 3h 6m per day

Staffing hours breakdown

Info Hours of care per resident per day, broken down by staff type. Data from CMS Medicare.
Staff type Facility State avg National avg
Registered Nurse (RN) Info Registered nurse hours per resident per day. 32m per day 44m per day 41m per day
Nurse Aide Info Nurse aide hours per resident per day. 1h 50m per day 2h 8m per day 2h 21m per day
Total Nursing (Weekend) Info Total number of nurse staff hours per resident per day on weekends. 2h 49m per day 3h 5m per day 3h 26m per day
Physical Therapist Info Physical therapist staff hours per resident per day. 3m per day 3m per day 4m per day
RN (Weekend) Info Registered nurse hours per resident per day on weekends. 22m per day 34m per day 29m per day

Capacity and availability

Medium-capacity home

Offers a balance of services and community atmosphere.

Total beds 171

This home usually has availability

Lower occupancy suggests more openings may be available.

Lower demand than the Illinois average
Occupancy rate 74.7%
Residents per day (avg) 121
Occupancy rate
74.7%
Residents per day (avg)
121

Who this home usually serves

TYPE OF STAY

Primarily short stays

Residents typically stay for brief periods, with frequent admissions and discharges throughout the year.

Might be optimal for
Post-acute recovery Temporary care Transitional stays

Breakdown by payment type

Medicare

27% of new residents, usually for short-term rehab.

Typical stay 25 days

Private pay

60% of new residents, often for short stays.

Typical stay 3 - 4 months

Medicaid

13% of new residents, often for long-term daily care.

Typical stay 5 - 6 months

Finances and operations

Privately-owned community
Operated by a business corporation.
Home revenue
$17.8M
Operating loss
-$1.5M
Privately-owned community Operated by a business corporation.
Home revenue
$17,784,617.00
Operating loss
$-1,524,592.00
Payroll costs Info The portion of the home's budget spent on staff, including nurses, caregivers, and other employees who support care and operations.
$6.0M
33.7% of revenue
Other operating costs Info All remaining costs needed to run the home, such as food, utilities, building maintenance, supplies and administrative expenses.
$13.3M
Total costs $19.3M
Walk Score
Walk Score: 53 / 100
Moderately walkable. Some errands can be accomplished on foot, with a mix of nearby amenities.

About this community

Care Services

Nursing Services
Rehabilitation Services
Skilled Nursing
Licensed Nurses/CNAs
24-Hour Staffing

Amenities & Lifestyle

Colostomy Care
Dental Care
Laboratory Services

Programs & Activities

Specific Programs
Short term rehabilitation, physical therapy, skilled nursing, colostomy care, dental care, laboratory services.

What does this home offer?

Accepts Medicaid icon

Accept Medicaid: Yes

Total residents icon

Total Residents: 171

Building type icon
Building type icon

Building Type: Single-story

Types of Care at Elevate Care South Holland

Nursing Home
Contact Elevate Care South Holland

Health Inspection History

Inspections
Total health inspections 14

Illinois average 10.4


Last Health inspection on Apr 2025

Total health citations 43

Illinois average 36.8

Citations per inspection
3.07

Illinois average 3.68


Health citations are formal notices following inspections when they fail to comply with safety and care standards.

15 of 43 citations resulted from standard inspections; 26 of 43 resulted from complaint investigations; and 2 of 43 came from combined inspections (standard and complaint).

Breakdown of citation severity (last 3 years)
Critical Health citations More info 2
186% worse than Illinois average

Illinois average: 0.7


Serious Health citations More info 11
206% worse than Illinois average

Illinois average: 3.6

2 critical citations More info Illinois average: 0.7

11 serious citations More info Illinois average: 3.6

30 moderate citations More info Illinois average: 32

0 minor citations More info Illinois average: 0.5
Citations history (last 3 years)
Nutrition moderate citation Info Issues related to food quality, meal service, and resident's nutritional needs. Apr 29, 2025
Corrected

Abuse/Neglect serious citation Info Issues related to protecting resident's from harm, including abuse, neglect, or mistreatment. Mar 26, 2025
Corrected

Quality of Care serious citation Info Issues related to how well residents receive appropriate treatment and support for their medical and daily care needs. Mar 05, 2025
Corrected

Quality of Care serious citation Info Issues related to how well residents receive appropriate treatment and support for their medical and daily care needs. Mar 05, 2025
Corrected

Compare Nursing Homes around Olympia Fields The information below is reported by the Illinois Department of Public Health, Office of Health Care Regulation.

2 facilities compared · CMS & IL Dept. of Health data · Updated Mar 2026

Elevate Care South Holland
AL

Assisted Living A licensed, long-term care setting for seniors or individuals with disabilities who need help with daily activities — like bathing, dressing, and medication management — but not 24-hour skilled nursing. Offers housing, meals, and around-the-clock support while aiming to maximize resident independence.

IL

Independent Living Lifestyle-focused communities for older adults offering dining, activities, and transportation with minimal personal care. Best for active, independent seniors who want community without medical support.

MC

Memory Care Secured, specialized care for people living with Alzheimer's or dementia. Staff trained in cognitive impairment, with higher staff-to-resident ratios and an environment designed to reduce confusion and wandering risk.

NH

Nursing Home Licensed facility providing 24/7 skilled nursing care for residents with complex, ongoing medical needs. Staffed by RNs, LPNs, and CNAs. Inspected and star-rated annually by CMS. Accepts Medicare (short-term rehab) and Medicaid (long-term care).

South Holland
171
74.7%
+8%
2.44
-17%
-21%
6
43
13
121
53
Meir Meystel Revocable
$17,1M
$6,0M
35%
145671
Prairie Manor Rehabilitation & Healthcare
-
MC

Memory Care Secured, specialized care for people living with Alzheimer's or dementia. Staff trained in cognitive impairment, with higher staff-to-resident ratios and an environment designed to reduce confusion and wandering risk.

NH

Nursing Home Licensed facility providing 24/7 skilled nursing care for residents with complex, ongoing medical needs. Staffed by RNs, LPNs, and CNAs. Inspected and star-rated annually by CMS. Accepts Medicare (short-term rehab) and Medicaid (long-term care).

Chicago Heights
-
-
-
-
-
-
-
-
-
0
0
0
-
-
-
-
-
-
-

Places of interest near Elevate Care South Holland

Address 0.4 miles from city center

Address 16300 Wausau Ave, South Holland, IL 60473

Calculate Travel Distance to Elevate Care South Holland

Add your location

Address

Staffing Data (Q2 2025)

This data corresponds to Q2 2025 and is based on CMS Payroll-Based Journal.

Total staff 256
Employees 171
Contractors 85
Staff to resident ratio 2.17:1
14% better than Illinois average

Illinois average ratio: 1.90:1

Avg staff/day 71
Average shift 7.4 hours
0% compared with Illinois average

Illinois average: 7.6 hours

Total staff hours (quarter) 47,561
Nursing staff breakdown
Registered Nurse

Manages medical care and health needs.

Total count 30
Average shift length Info Average shift length. Calculated as total hours divided by days worked and average staff per day. 7.4 hours

This role is partially covered by contractors.

Licensed Practical Nurse

Assists with medical care and medications.

Total count 73
Average shift length Info Average shift length. Calculated as total hours divided by days worked and average staff per day. 8.4 hours

This role is partially covered by contractors.

Certified Nursing Assistant

Helps with daily care and mobility.

Total count 104
Average shift length Info Average shift length. Calculated as total hours divided by days worked and average staff per day. 6.9 hours

This role is partially covered by contractors.

Contractor staffing

Total hours from contractors

10%

4,752 contractor hours this quarter

Licensed Practical Nurse: 44 Certified Nursing Assistant: 15 Registered Nurse: 8 Physical Therapy Assistant: 4 Physical Therapy Aide: 3 Speech Language Pathologist: 3 Respiratory Therapy Technician: 3 Qualified Social Worker: 3 Occupational Therapy Aide: 1 Occupational Therapy Assistant: 1
Staff by category
Certified Nursing Assistant 89 15 104 21,808 91 100% 6.9
Licensed Practical Nurse 29 44 73 10,400 91 100% 8.4
Registered Nurse 22 8 30 4,150 91 100% 7.4
Qualified Activities Professional 14 0 14 2,727 91 100% 9
Other Dietary Services Staff 6 0 6 1,747 91 100% 7.2
Speech Language Pathologist 0 3 3 995 70 77% 7.8
RN Director of Nursing 2 0 2 960 64 70% 8
Physical Therapy Aide 0 3 3 694 67 74% 6.6
Dental Services Staff 2 0 2 601 68 75% 7.7
Administrator 2 0 2 592 65 71% 8
Nurse Practitioner 2 0 2 528 64 70% 8
Dietitian 2 0 2 504 62 68% 8
Respiratory Therapy Technician 0 3 3 502 73 80% 6.8
Physical Therapy Assistant 0 4 4 491 70 77% 6.8
Mental Health Service Worker 1 0 1 488 61 67% 8
Qualified Social Worker 0 3 3 286 40 44% 5.4
Occupational Therapy Assistant 0 1 1 47 6 7% 7.8
Occupational Therapy Aide 0 1 1 42 10 11% 4.2
104 Certified Nursing Assistant
% of Days 100%
73 Licensed Practical Nurse
% of Days 100%
30 Registered Nurse
% of Days 100%
14 Qualified Activities Professional
% of Days 100%
6 Other Dietary Services Staff
% of Days 100%
3 Speech Language Pathologist
% of Days 77%
2 RN Director of Nursing
% of Days 70%
3 Physical Therapy Aide
% of Days 74%
2 Dental Services Staff
% of Days 75%
2 Administrator
% of Days 71%
2 Nurse Practitioner
% of Days 70%
2 Dietitian
% of Days 68%
3 Respiratory Therapy Technician
% of Days 80%
4 Physical Therapy Assistant
% of Days 77%
1 Mental Health Service Worker
% of Days 67%
3 Qualified Social Worker
% of Days 44%
1 Occupational Therapy Assistant
% of Days 7%
1 Occupational Therapy Aide
% of Days 11%

Facility Characteristics

Source: CMS Long-Term Care Facility Characteristics (Data as of Jan 2026)

Total census
118 residents
Residents by payment source
Medicare
23 residents (19.5%)
Medicaid
89 residents (75.4%)
Private pay or other
6 residents (5.1%)
Programs & Services
Residents' Group

Residents meet regularly to discuss policies, care quality, and activities

Active Resident Council

Organized group of residents that meets regularly to discuss facility policies, quality of life, and activities.

Quality of care over time

These measures show how residents usually do over time at this home, based on health outcomes and preventive care.

High-risk clinical events score Info A composite score based on pressure ulcers, falls with injury, weight loss, walking ability decline, and activities of daily living decline. 7.0
28% better than Illinois average

Illinois average: 9.7

Functional decline score Info A composite score based on activities of daily living decline, walking ability decline, and incontinence. 12.4
33% better than Illinois average

Illinois average: 18.6

Long-stay resident measures
Significantly above average Illinois avg: 3.6 Info CMS star rating based on long-stay quality measure performance. 5 stars = significantly above average, 1 star = significantly below average.
Need for Help with Daily Activities Increased Info Percent of long-stay residents whose need for help with daily activities has increased 6.5%
58% better than Illinois average

Illinois average: 15.5%

Walking Ability Worsened Info Percent of long-stay residents whose ability to move independently worsened 5.1%
72% better than Illinois average

Illinois average: 18.4%

Low Risk Residents with Bowel/Bladder Incontinence Info Percent of low risk long-stay residents who lose control of their bowels or bladder 25.7%
19% worse than Illinois average

Illinois average: 21.6%

Falls with Major Injury Info Percent of long-stay residents experiencing one or more falls with major injury 1.4%
57% better than Illinois average

Illinois average: 3.4%

High Risk Residents with Pressure Ulcers Info Percent of long-stay high risk residents with pressure ulcers 10.2%
94% worse than Illinois average

Illinois average: 5.3%

Urinary Tract Infection Info Percent of long-stay residents with a urinary tract infection 0.5%
73% better than Illinois average

Illinois average: 1.8%

Lost Too Much Weight Info Percent of long-stay residents who lose too much weight 11.7%
79% worse than Illinois average

Illinois average: 6.5%

Depressive Symptoms Info Percent of long-stay residents who have depressive symptoms 90.4%
88% worse than Illinois average

Illinois average: 48.1%

Antipsychotic Use Info Percent of long-stay residents who received an antipsychotic medication 11.7%
42% better than Illinois average

Illinois average: 20.2%

Pneumococcal Vaccine Info Percent of long-stay residents assessed and appropriately given the pneumococcal vaccine 54.8%
39% worse than Illinois average

Illinois average: 89.2%

Influenza Vaccine Info Percent of long-stay residents assessed and appropriately given the seasonal influenza vaccine 88.1%
In line with Illinois average

Illinois average: 91.6%

Short-stay resident measures
Below average Illinois avg: 2.0 Info CMS star rating based on short-stay quality measure performance. 5 stars = much above average, 1 star = much below average.
Pneumococcal Vaccine Info Percent of short-stay residents assessed and appropriately given the pneumococcal vaccine 34.5%
49% worse than Illinois average

Illinois average: 68.3%

Antipsychotic medication increase Info Percent of short-stay residents who newly received an antipsychotic medication 1.1%
55% better than Illinois average

Illinois average: 2.3%

Influenza Vaccine Info Percent of short-stay residents assessed and appropriately given the seasonal influenza vaccine 51.9%
18% worse than Illinois average

Illinois average: 63.0%

Re-hospitalized after SNF stay Info Percentage of short-stay residents who were re-hospitalized after their nursing home admission. 23.6%
10% better than Illinois average

Illinois average: 26.2%

Emergency department visits Info Percentage of short-stay residents who had an outpatient emergency department visit. 7.7%
45% better than Illinois average

Illinois average: 14.0%

Falls with major injury Info Percentage of SNF residents who experience falls with major injury during their stay. 0.0%
100% better than Illinois average

Illinois average: 0.8%

Ability to care for self at discharge Info Percentage of residents at or above expected ability to care for themselves at discharge. 44.9%
16% worse than Illinois average

Illinois average: 53.7%

Successful return to home or community Info Rate of successful return to home or community from a skilled nursing facility. 45.0%
11% worse than Illinois average

Illinois average: 50.6%

Penalties and fines

Federal penalties imposed by CMS for regulatory violations, including civil money penalties (fines) and denials of payment for new Medicare/Medicaid admissions.

Source: CMS Penalties Database (Data as of Jan 2026)

Total fines amount $207K
45% higher than Illinois average

Illinois average: $143K

Number of fines 6
102% more fines than Illinois average

Illinois average: 3.0

Payment Denials Info Serious action where Medicare and/or Medicaid temporarily stops payments for new residents until issues are fixed. 0
100% fewer payment denials than Illinois average

Illinois average: 1.1

Fines amount comparison
This facility $207K
Illinois average $143K
Penalty History

Penalties are imposed by CMS for violations of federal nursing home regulations.

Civil Money Penalty Info Fines imposed for noncompliance, which can be assessed per day or per instance of violation. Jan 7, 2025
$19K
Civil Money Penalty Info Fines imposed for noncompliance, which can be assessed per day or per instance of violation. Nov 7, 2024
$45K
Civil Money Penalty Info Fines imposed for noncompliance, which can be assessed per day or per instance of violation. Jul 12, 2024
$17K
Civil Money Penalty Info Fines imposed for noncompliance, which can be assessed per day or per instance of violation. Feb 23, 2024
$44K

Last updated: Jan 2026

Guides for Better Senior Living

Care Cost Calculator: See Prices in Your Area

Nursing Home Data Explorer

Don’t Wait Too Long: 7 Red Flag Signs Your Parent Needs Assisted Living Now

The True Cost of Assisted Living in 2025 – And How Families Are Paying For It

Understanding Senior Living Costs: Pricing Models, Discounts & Financial Assistance

Financial Aid for Illinois Seniors

Get financial aid guidance

Community Care Program

Illinois CCP

Age 60+, Illinois resident, at risk of nursing home placement.

~$1,215/month (individual).

$17,500 (individual, excludes home, car).

High demand in urban areas; waitlists possible.

Illinois Respite Program

IL Respite (via NFCSP)

Caregiver of someone 60+ (or with dementia), Illinois resident.

No strict limit; prioritizes low-income.

Not applicable.

Limited slots; urban/rural balance.

Supportive Living Program (SLP)

Illinois Medicaid Supportive Living Program

Age 65+ or 22-64 with disability, Illinois resident, Medicaid-eligible, needs moderate assistance (not nursing home-level).

~$2,829/month (300% FBR, individual); QIT allowed.

$2,000 (individual), $3,000 (couple) (excludes home, car).

~200 SLP sites statewide; room/board not covered.

Persons Who Are Elderly Waiver

Illinois Medicaid Elderly Waiver

Age 65+, Illinois resident, Medicaid-eligible, nursing home-level care need.

~$2,829/month (300% FBR, individual).

$2,000 (individual), $3,000 (couple).

Part of HealthChoice Illinois; consumer-directed options available.

Medicare Savings Program (MSP)

Illinois Medicare Savings Program

Age 65+ or disabled, Illinois resident, Medicare Part A/B.

~$2,510/month (QMB), ~$3,380/month (SLMB), ~$3,598/month (QI)—individual.

$9,430 (individual), $14,130 (couple).

Three tiers; no waitlist.

Senior Community Service Employment Program (SCSEP)

Illinois SCSEP

Age 55+, unemployed, low-income, Illinois resident.

~$1,983/month (125% FPL).

Not specified; income-focused.

Priority for veterans, rural residents.

Optional State Supplementation (OSS)

Illinois Optional State Supplementation

Age 65+ or disabled, Illinois resident, in approved facility, SSI recipient or low-income.

~$1,004/month (including SSI).

$2,000 (individual), $3,000 (couple).

~$50-$500/month based on facility type.

VA Aid and Attendance (A&A) and Housebound Benefits

Illinois VA Aid and Attendance/Housebound

Age 65+ or disabled veteran/spouse, Illinois resident, wartime service, need for ADL help (A&A) or homebound.

Net income < ~$1,984/month (veteran with dependent, A&A); pension offsets income.

~$155,356 (net worth limit).

High veteran demand in urban/rural areas.

Tour Icon
Planning a tour? Check our touring checklist.
Chat Icon
Thinking of living here? We can help you speak to a current resident