Prairie Manor Rehabilitation & Healthcare
Nursing Home & Memory Care · Olympia Fields, IL
CMS overall rating Info The Overall CMS Rating is scored from 1 to 5 stars and combines results from health inspections, staffing levels, and quality measures. Health inspections carry the most weight. Staffing and quality scores can increase or decrease the final rating based on performance compared to state and national standards.

Prairie Manor Rehabilitation & Healthcare

Nursing Home & Memory Care · Olympia Fields, IL
CMS overall rating Info The Overall CMS Rating is scored from 1 to 5 stars and combines results from health inspections, staffing levels, and quality measures. Health inspections carry the most weight. Staffing and quality scores can increase or decrease the final rating based on performance compared to state and national standards.
Calculator: See prices in your area
Prairie Manor Rehabilitation & Healthcare accepts Medicare, Medicaid, and private pay.

Overview of Prairie Manor Rehabilitation & Healthcare

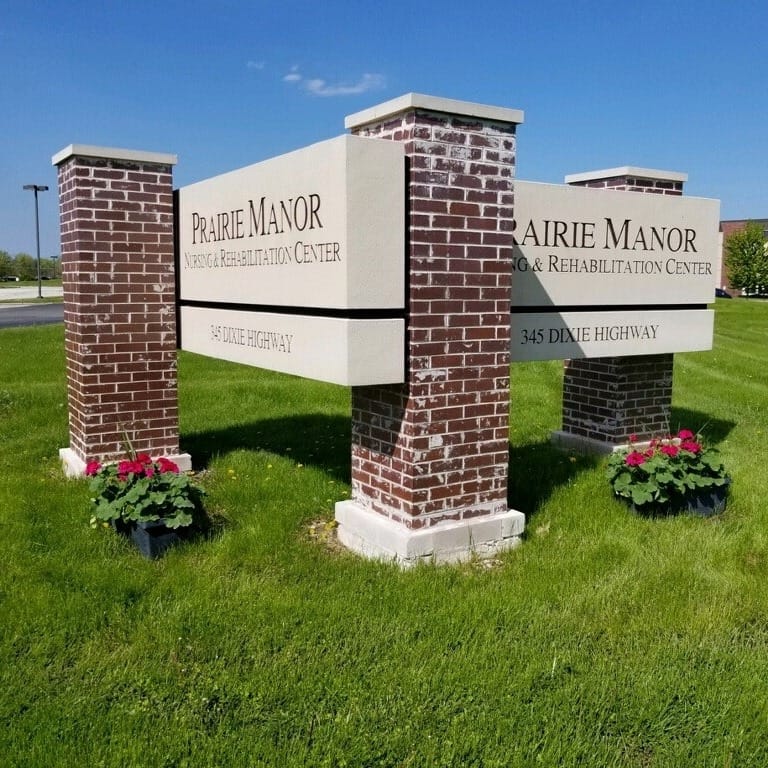
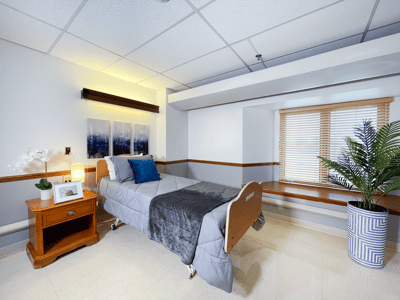
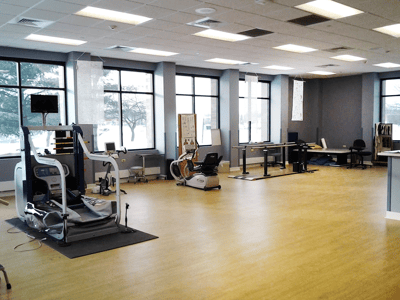
Prairie Manor Rehabilitation & Healthcare is a nursing home in Chicago Heights, IL, offering memory care, rehabilitation, and skilled nursing. Here, older adults can keep their peace of mind, especially with a comfortable and home-like environment. Excellent services, including housekeeping, laundry, and nutritious meals, are also provided to help enrich residents’ living experiences. The community is also committed to meeting residents’ needs and preferences, providing individualized care plans for their recovery.

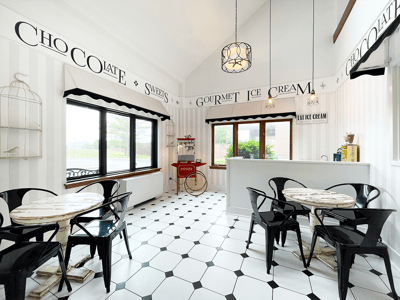
Card games, social events, and light exercises provide residents with more opportunities to explore new interests and make friends. An ice cream parlor, a salon, and a spacious outdoor patio also foster interactions and relaxation. Residents also experience a stress-free retirement, as it is conveniently located in the quiet residential area of Chicago Heights. This nursing home has exceptional standards of care, making it a good option for senior living in Illinois.

Quality ratings

Measured by Centers for Medicare & Medicaid Services (CMS)

Overall rating Info The Overall CMS Rating combines results from health inspections, staffing levels and quality measures. Health inspections carry the most weight. Staffing and quality scores can increase or decrease the final rating based on performance compared to state and national standards.
▲ 19.0% Above IL avg. ▲ 19.0% Above IL avg.Click the badge to see the full State ranking.Click here to see the full State ranking.
Health Inspection Info Based on the results of the facility's three most recent standard inspections and any complaint investigations. CMS reviews the number, scope, and severity of deficiencies, with more recent findings weighted more heavily.
▲ 44.1% Above IL avg. ▲ 44.1% Above IL avg.Click the badge to see the full State ranking.Click here to see the full State ranking.
Staffing Info Measures average nursing staff hours per resident per day, including Registered Nurses (RNs) and total nursing staff. Ratings are adjusted based on the level of care residents require and are compared to state and national benchmarks.
▼ 53.2% Below IL avg. ▼ 53.2% Below IL avg.Click the badge to see the full State ranking.Click here to see the full State ranking.
Quality Measures Info Based on clinical and physical health indicators reported to CMS, such as hospital readmissions, falls, pressure ulcers, and improvements in mobility. These measures reflect how well residents' health needs are being managed.
▲ 42.1% Above IL avg. ▲ 42.1% Above IL avg.Click the badge to see the full State ranking.Click here to see the full State ranking.

Staffing hours breakdown

Info Daily nursing hours per resident by staff type, reported to CMS. Higher is generally better — compare this facility to state and national averages to see where staffing stands.

Hours per resident per day — compared to Illinois state averages

Total nursing care / resident Info Total adjusted nursing hours per resident per day, combining RN, LPN, and aide time. CMS adjusts this for case-mix so facilities can be fairly compared.
2h 35m per day
This facility Illinois avg (3h 6m per day)
vs Illinois avg
-17%
Staff typeHours / Day / Residentvs state avg
Total Nursing (Weekend) Info Combined nursing hours (RN + LPN + Nurse Aide) per resident per day on weekends. Staffing often drops on weekends — this figure reveals whether the facility maintains adequate coverage outside of weekday hours. 3h 2m per day

Capacity and availability

This home usually has limited availability

Occupancy between 85% and 95% suggests balanced demand.

Higher occupancy than the Illinois average: 69.3%
Occupancy rate 85.6%
Avg. Length of Stay 171 days
Occupancy rate
85.6%
Avg. Length of Stay
171 days

Who this home usually serves

TYPE OF STAY

Mostly short-term rehab stays

Most residents typically stay for a few weeks or months before returning home or moving on.

Breakdown by payment type

Medicare

41% of new residents, usually for short-term rehab.

Typical stay 1 - 2 months

Private pay

29% of new residents, often for short stays.

Typical stay 1 - 2 months

Medicaid

29% of new residents, often for long-term daily care.

Typical stay 10 - 11 months

Finances and operations

Privately-owned community
Home revenue
$18.5M
Operating loss
-$376.3K
Privately-owned community
Home revenue
$18.5M
Operating loss
-$376.3K
Payroll costs Info The portion of the home's budget spent on staff, including nurses, caregivers, and other employees who support care and operations.
$9.2M
49.9% of revenue
Other operating costs Info All remaining costs needed to run the home, such as food, utilities, building maintenance, supplies and administrative expenses.
$9.6M
Total costs $18.9M
Walk Score
Walk Score: 28 / 100
Somewhat walkable. A few nearby services may be reachable on foot, but most trips require transportation.

What does this home offer?

Building type icon
Building type icon

Building Type: 3-story

On-site medical care and health services icon

On-site Medical Care and Health Services

Rehabilitative support icon

Rehabilitative Support
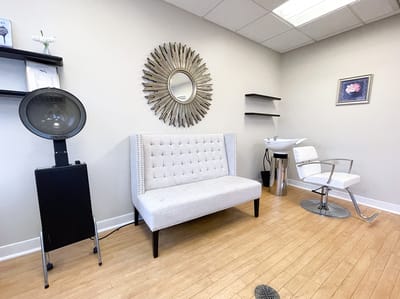
Beauty services icon

Beauty Services

Housekeeping icon
Housekeeping icon

Housekeeping Services

Social and recreational activities icon

Social and Recreational Activities

Types of Care at Prairie Manor Rehabilitation & Healthcare

Nursing Home Memory Care

Contact Prairie Manor Rehabilitation & Healthcare

Health Inspection History

Inspections Since 2022
Total health inspections 8

Illinois average 10.4


Last Health inspection on Apr 2025

Total health citations
30

Illinois average 36.8

Citations per inspection
3.75

Illinois average 3.68


Health citations are formal notices following inspections when they fail to comply with safety and care standards.

22 of 30 citations resulted from standard inspections; 7 of 30 resulted from complaint investigations; and 1 of 30 came from combined inspections (standard and complaint).

Breakdown of citation severity (last 4 years)
Critical Health citations
0
100% better than Illinois average

Illinois average: 0.7


Serious Health citations
3
17% better than Illinois average

Illinois average: 3.6

0 critical citations Illinois average: 0.7

3 serious citations Illinois average: 3.6

27 moderate citations Illinois average: 32

0 minor citations Illinois average: 0.5
Citations history (last 4 years)
Quality of Care moderate citation Apr 07, 2025
Corrected

Quality of Care moderate citation Feb 14, 2025
Corrected

Administration moderate citation Jul 12, 2024
Corrected

Nutrition moderate citation Jul 12, 2024
Corrected

Financial Assistance for
Nursing Home in Illinois

Prairie Manor Rehabilitation & Healthcare is located in Chicago Heights, Illinois.
Here are the financial assistance programs available to residents in Illinois.

Get Financial aid guidance

Community Care Program

Illinois CCP

Age 60+
General Illinois resident, at risk of nursing home placement.
Income Limits (2025) ~$1,215/month individual
Asset Limits $17,500 individual, excludes home, car
IL

High demand in urban areas; waitlists possible.

Benefits
In-home care (3-5 hours/day) Adult day services ($65/day) Emergency home response systems ($30/month)

Illinois Respite Program

IL Respite (via NFCSP)

Age Caregiver of someone 60+ (or with dementia)
General Illinois resident.
Income Limits No strict limit; prioritizes low-income.
Asset Limits Not applicable.
IL

Limited slots; urban/rural balance.

Benefits
In-home respite (4-6 hours/day) Adult day care (~$65/day) Short-term facility care (up to 5 days)

Supportive Living Program (SLP)

Illinois Medicaid Supportive Living Program

Age 65+ or 22-64 with disability
General Illinois resident, Medicaid-eligible, needs moderate assistance (not nursing home-level).
Income Limits (2025) ~$2,829/month (300% FBR, individual); QIT allowed.
Asset Limits $2,000 (individual), $3,000 (couple) (excludes home, car).
IL

~200 SLP sites statewide; room/board not covered.

Benefits
Personal care (5-7 hours/day, e.g., bathing, mobility) Meals Housekeeping Medication management Respite (~240 hours/year)

Persons Who Are Elderly Waiver

Illinois Medicaid Elderly Waiver

Age 65+
General Illinois resident, Medicaid-eligible, nursing home-level care need.
Income Limits (2025) ~$2,829/month 300% FBR, individual
Asset Limits $2,000 (individual), $3,000 (couple).
IL

Part of HealthChoice Illinois; consumer-directed options available.

Benefits
Personal care (5-7 hours/day, e.g., dressing, eating) Homemaker Adult day care (~$60/day) Respite (240 hours/year) Home mods ($1,000 avg.)

Medicare Savings Program (MSP)

Illinois Medicare Savings Program

Age 65+ or disabled
General Illinois resident, Medicare Part A/B.
Income Limits (2025) ~$2,510/month (QMB), ~$3,380/month (SLMB), ~$3,598/month (QI)—individual.
Asset Limits $9,430 (individual), $14,130 (couple).
IL

Three tiers; no waitlist.

Benefits
Covers Part B premiums ($174.70/month) Deductibles ($240/year) Copays (~20%)

Optional State Supplementation (OSS)

Illinois Optional State Supplementation

Age 65+ or disabled
General Illinois resident, in approved facility, SSI recipient or low-income.
Income Limits (2025) ~$1,004/month including SSI
Asset Limits $2,000 (individual), $3,000 (couple).
IL

~$50-$500/month based on facility type.

Benefits
Cash (~$50-$500/month) for room/board in personal care homes or SLFs

VA Aid and Attendance (A&A) and Housebound Benefits

Illinois VA Aid and Attendance/Housebound

Age 65+ or disabled veteran/spouse
General Illinois resident, wartime service, need for ADL help (A&A) or homebound.
Income Limits (2025) Net income < ~$1,984/month (veteran with dependent, A&A); pension offsets income.
Asset Limits ~$155,356 net worth limit
IL

High veteran demand in urban/rural areas.

Benefits
Cash (~$1,433-$2,642/month veteran, ~$951-$1,318 spouse) for care costs (e.g., in-home, assisted living)

Places of interest near Prairie Manor Rehabilitation & Healthcare

Address 2.2 miles from city center Info Estimated distance in miles from Chicago Heights's city center to Prairie Manor Rehabilitation & Healthcare's address, calculated via Google Maps.

Calculate Travel Distance to Prairie Manor Rehabilitation & Healthcare

Add your location

Address

Staffing Data

Reporting period: April 1 – June 30, 2025 (Q2 2025). Source: CMS Payroll-Based Journal report.

Total staff 157
Employees 129
Contractors 28
Staff to resident ratio 1.27:1
33% worse than Illinois average
Illinois average ratio: 1.90:1 Illinois average ratio: 1.90:1See full Illinois ranking
Avg staff/day 68
Average shift 7.8 hours
0% compared with Illinois average
Illinois average: 7.6 hours Illinois average shift: 7.6 hoursSee full Illinois ranking
Total staff hours (quarter) 47,977

Nursing staff breakdown

Q2 2025 · Apr 1 – Jun 30 More info This data comes from the CMS Payroll-Based Journal report covering April 1 – June 30, 2025.
Registered Nurse

Manages medical care and health needs.

Total count 12
Average shift length Info Average shift length. Calculated as total hours divided by days worked and average staff per day. 8 hours

No contractors work on this role.

Licensed Practical Nurse

Assists with medical care and medications.

Total count 31
Average shift length Info Average shift length. Calculated as total hours divided by days worked and average staff per day. 8.9 hours

No contractors work on this role.

Certified Nursing Assistant

Helps with daily care and mobility.

Total count 66
Average shift length Info Average shift length. Calculated as total hours divided by days worked and average staff per day. 7.4 hours

No contractors work on this role.

Contractor staffing

Q2 2025 · Apr 1 – Jun 30 More info This data comes from the CMS Payroll-Based Journal report covering April 1 – June 30, 2025.

Total hours from contractors

6.6%

3,146 contractor hours this quarter

Respiratory Therapy Technician: 6 Qualified Social Worker: 6 Physical Therapy Assistant: 5 Speech Language Pathologist: 3 Physical Therapy Aide: 2 Medical Director: 2 Clinical Nurse Specialist: 2 Occupational Therapy Aide: 1 Occupational Therapy Assistant: 1

Staff by category

Q2 2025 · Apr 1 – Jun 30 More info This data comes from the CMS Payroll-Based Journal report covering April 1 – June 30, 2025.
Certified Nursing Assistant6606623,19091100%7.4
Licensed Practical Nurse3103111,81591100%8.9
Registered Nurse120123,19691100%8
Other Dietary Services Staff100102,47191100%7.7
RN Director of Nursing2021,0506571%8.3
Dental Services Staff2029236369%8.2
Speech Language Pathologist0337298897%5.9
Respiratory Therapy Technician0666727987%6.8
Dietitian2025536470%8
Physical Therapy Assistant0555387684%7.1
Mental Health Service Worker1015046369%8
Physical Therapy Aide0224966571%7.1
Administrator1014896571%7.5
Nurse Practitioner1014586167%7.5
Qualified Social Worker0663316774%4.9
Clinical Nurse Specialist1232382831%7.5
Occupational Therapy Aide0111753437%5.1
Medical Director0221043033%3.5
Occupational Therapy Assistant0114867%7.9
66 Certified Nursing Assistant
% of Days 100%
31 Licensed Practical Nurse
% of Days 100%
12 Registered Nurse
% of Days 100%
10 Other Dietary Services Staff
% of Days 100%
2 RN Director of Nursing
% of Days 71%
2 Dental Services Staff
% of Days 69%
3 Speech Language Pathologist
% of Days 97%
6 Respiratory Therapy Technician
% of Days 87%
2 Dietitian
% of Days 70%
5 Physical Therapy Assistant
% of Days 84%
1 Mental Health Service Worker
% of Days 69%
2 Physical Therapy Aide
% of Days 71%
1 Administrator
% of Days 71%
1 Nurse Practitioner
% of Days 67%
6 Qualified Social Worker
% of Days 74%
3 Clinical Nurse Specialist
% of Days 31%
1 Occupational Therapy Aide
% of Days 37%
2 Medical Director
% of Days 33%
1 Occupational Therapy Assistant
% of Days 7%

Facility Characteristics

Source: CMS Long-Term Care Facility Characteristics (Data as of Jan 2026)

Total residents 124
Medicare
21
16.9% of residents
Medicaid
90
72.6% of residents
Private pay or other
13
10.5% of residents
Programs & Services
Residents Group

Residents meet regularly to discuss policies, care quality, and activities

Active Resident Council

Organized group of residents that meets regularly to discuss facility policies, quality of life, and activities.

Quality of care over time

These measures show how residents usually do over time at this home, based on health outcomes and preventive care.

High-risk clinical events score Info A composite score based on pressure ulcers, falls with injury, weight loss, walking ability decline, and activities of daily living decline. 5.6
42% better than Illinois average

Illinois average: 9.7

Functional decline score Info A composite score based on activities of daily living decline, walking ability decline, and incontinence. 10.6
43% better than Illinois average

Illinois average: 18.6

Long-stay resident measures
Need for Help with Daily Activities Increased Info Percent of long-stay residents whose need for help with daily activities has increased 8.2%
47% better than Illinois average

Illinois average: 15.5%

Walking Ability Worsened Info Percent of long-stay residents whose ability to move independently worsened 5.1%
72% better than Illinois average

Illinois average: 18.4%

Low Risk Residents with Bowel/Bladder Incontinence Info Percent of low risk long-stay residents who lose control of their bowels or bladder 18.5%
14% better than Illinois average

Illinois average: 21.6%

Falls with Major Injury Info Percent of long-stay residents experiencing one or more falls with major injury 2.8%
18% better than Illinois average

Illinois average: 3.4%

High Risk Residents with Pressure Ulcers Info Percent of long-stay high risk residents with pressure ulcers 6.9%
31% worse than Illinois average

Illinois average: 5.3%

Urinary Tract Infection Info Percent of long-stay residents with a urinary tract infection 0.9%
48% better than Illinois average

Illinois average: 1.8%

Lost Too Much Weight Info Percent of long-stay residents who lose too much weight 5.3%
20% better than Illinois average

Illinois average: 6.5%

Depressive Symptoms Info Percent of long-stay residents who have depressive symptoms 99.5%
107% worse than Illinois average

Illinois average: 48.1%

Antipsychotic Use Info Percent of long-stay residents who received an antipsychotic medication 10.2%
49% better than Illinois average

Illinois average: 20.2%

Pneumococcal Vaccine Info Percent of long-stay residents assessed and appropriately given the pneumococcal vaccine 79.4%
11% worse than Illinois average

Illinois average: 89.2%

Influenza Vaccine Info Percent of long-stay residents assessed and appropriately given the seasonal influenza vaccine 74.0%
19% worse than Illinois average

Illinois average: 91.6%

Short-stay resident measures
Pneumococcal Vaccine Info Percent of short-stay residents assessed and appropriately given the pneumococcal vaccine 14.7%
79% worse than Illinois average

Illinois average: 68.3%

Antipsychotic medication increase Info Percent of short-stay residents who newly received an antipsychotic medication 2.1%
11% better than Illinois average

Illinois average: 2.3%

Influenza Vaccine Info Percent of short-stay residents assessed and appropriately given the seasonal influenza vaccine 15.5%
75% worse than Illinois average

Illinois average: 63.0%

Penalties and fines

Federal penalties imposed by CMS for regulatory violations, including civil money penalties (fines) and denials of payment for new Medicare/Medicaid admissions.

Source: CMS Penalties Database

No penalties in the past 3 years

No civil money penalties or payment denials were reported in the last 3 years.

Compare Nursing Home around Olympia Fields

The information below is reported by the Illinois Department of Public Health, Office of Health Care Regulation.

2 facilities compared · CMS & IL Dept. of Health data

Filter by care type
Prairie Manor Rehabilitation & Healthcare
NH

Nursing Home Licensed facility providing 24/7 skilled nursing care for residents with complex, ongoing medical needs. Staffed by RNs, LPNs, and CNAs. Inspected and star-rated annually by CMS. Accepts Medicare (short-term rehab) and Medicaid (long-term care).

MC

Memory Care Secured, specialized care for people living with Alzheimer's or dementia. Staff trained in cognitive impairment, with higher staff-to-resident ratios and an environment designed to reduce confusion and wandering risk.

Chicago Heights148 85.6% +24%2.58 -46%-17%$0303.83128 28 Mary Stucker$18.5M$9.2M49.9%145629
Elevate Care South Holland
NH

Nursing Home Licensed facility providing 24/7 skilled nursing care for residents with complex, ongoing medical needs. Staffed by RNs, LPNs, and CNAs. Inspected and star-rated annually by CMS. Accepts Medicare (short-term rehab) and Medicaid (long-term care).

AL

Assisted Living A licensed, long-term care setting for seniors or individuals with disabilities who need help with daily activities — like bathing, dressing, and medication management — but not 24-hour skilled nursing. Offers housing, meals, and around-the-clock support while aiming to maximize resident independence.

IL

Independent Living Lifestyle-focused communities for older adults offering dining, activities, and transportation with minimal personal care. Best for active, independent seniors who want community without medical support.

MC

Memory Care Secured, specialized care for people living with Alzheimer's or dementia. Staff trained in cognitive impairment, with higher staff-to-resident ratios and an environment designed to reduce confusion and wandering risk.

South Holland171 74.7% +8%2.44 -17%-21%$207.1k433.113121 53 Meir Meystel Revocable$17.8M$7.9M44.4%145671

Guides for Better Senior Living

Care Cost Calculator: See Prices in Your Area

Nursing Home Data Explorer

Don’t Wait Too Long: 7 Red Flag Signs Your Parent Needs Assisted Living Now

The True Cost of Assisted Living in 2025 – And How Families Are Paying For It

Understanding Senior Living Costs: Pricing Models, Discounts & Financial Assistance

Frequently Asked Questions about Prairie Manor Rehabilitation & Healthcare

Is Prairie Manor Rehabilitation & Healthcare in a walkable area?

Prairie Manor Rehabilitation & Healthcare has a walk score of 28. Somewhat walkable. A few nearby services may be reachable on foot, but most trips require transportation.

What is the best email address for Prairie Manor Rehabilitation & Healthcare?

The team at Prairie Manor Rehabilitation & Healthcare can be reached at [email protected].

What is the address of Prairie Manor Rehabilitation & Healthcare?

Prairie Manor Rehabilitation & Healthcare is located at 345 Dixie Hwy, Chicago Heights, IL 60411.

What is the phone number of Prairie Manor Rehabilitation & Healthcare?

(708) 754-7601 will put you in contact with the team at Prairie Manor Rehabilitation & Healthcare.

Is Prairie Manor Rehabilitation & Healthcare Medicare or Medicaid certified?

Yes — Prairie Manor Rehabilitation & Healthcare is a CMS-certified provider of Medicare and Medicaid.

Explore Open Rooms
1 Contact details
2 What type of senior care service are you looking for?
3 What budget do you have in mind for senior care?
4 How soon do you need to find care?
5 Additional details

Thank you for your interest!

Our team will be in touch shortly to help with next steps.