Elevate Care South Holland
Nursing Home, Assisted Living, Independent Living & Memory Care · South Holland, IL
CMS overall rating Info CMS (the Centers for Medicare & Medicaid Services) is the federal agency that rates nursing home quality. Its Overall Rating runs from 1 to 5 stars, combining health inspections, staffing, and quality measures, with inspections weighted most heavily.

Elevate Care South Holland

Nursing Home, Assisted Living, Independent Living & Memory Care · South Holland, IL
CMS overall rating Info CMS (the Centers for Medicare & Medicaid Services) is the federal agency that rates nursing home quality. Its Overall Rating runs from 1 to 5 stars, combining health inspections, staffing, and quality measures, with inspections weighted most heavily.
Calculator: See prices in your area
Elevate Care South Holland accepts Medicare, Medicaid, and private pay.

Overview of Elevate Care South Holland

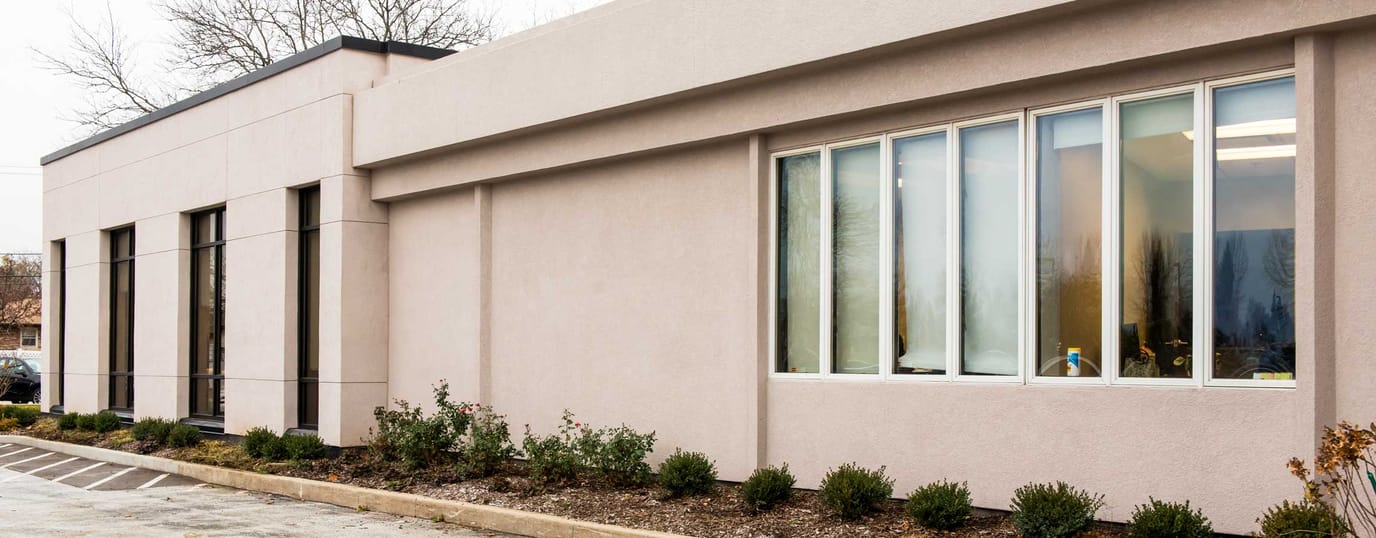
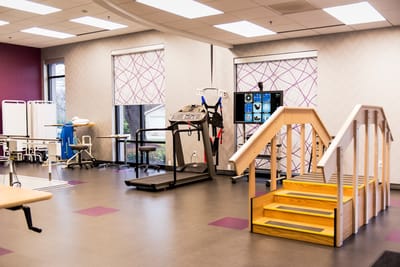
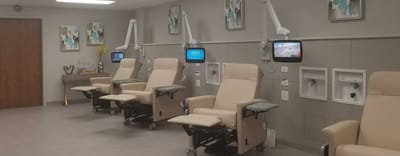
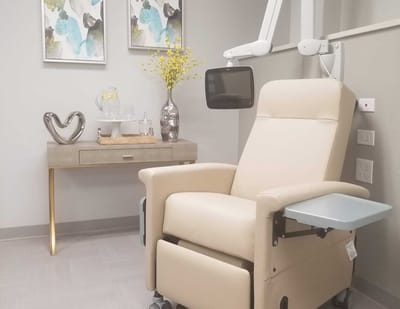
Elevate Care South Holland is an esteemed senior living community located in the peaceful residential grounds of Wausau Avenue, South Holland, IL, providing a wide range of care services including skilled nursing, respiratory care, chronic disease management, comprehensive rehab, wound care, and memory care. The community also offers in-house dialysis for seniors who require it to ensure their convenience. A team of compassionate and well-trained professionals cares for seniors’ special needs and aspirations to ensure they thrive and live their lives to the fullest.

The community promotes a bright and friendly environment, encouraging residents to mingle with friends and maintain an active lifestyle. Here, families can rest their minds knowing their loved ones are well-cared for. Elevate Care South Holland is a good place for seniors to make every moment of their best years count.

Quality ratings

Measured by Centers for Medicare & Medicaid Services (CMS)

Overall rating Info The Overall CMS Rating combines results from health inspections, staffing levels and quality measures. Health inspections carry the most weight. Staffing and quality scores can increase or decrease the final rating based on performance compared to state and national standards.
▼ 60.3% Below IL avg. ▼ 60.3% Below IL avg.IL average: 2.5Click the badge to see the full State ranking.Click here to see the full State ranking.
Health Inspection Info Based on the results of the facility's three most recent standard inspections and any complaint investigations. CMS reviews the number, scope, and severity of deficiencies, with more recent findings weighted more heavily.
▼ 28.0% Below IL avg. ▼ 28.0% Below IL avg.IL average: 2.8Click the badge to see the full State ranking.Click here to see the full State ranking.
Staffing Info Measures average nursing staff hours per resident per day, including Registered Nurses (RNs) and total nursing staff. Ratings are adjusted based on the level of care residents require and are compared to state and national benchmarks.
▼ 53.2% Below IL avg. ▼ 53.2% Below IL avg.IL average: 2.1Click the badge to see the full State ranking.Click here to see the full State ranking.
Quality Measures Info Based on clinical and physical health indicators reported to CMS, such as hospital readmissions, falls, pressure ulcers, and improvements in mobility. These measures reflect how well residents' health needs are being managed.
▲ 42.1% Above IL avg. ▲ 42.1% Above IL avg.IL average: 2.8Click the badge to see the full State ranking.Click here to see the full State ranking.

Staffing hours breakdown

Info Daily nursing hours per resident by staff type, reported to CMS. Higher is generally better — compare this facility to state and national averages to see where staffing stands.

Hours per resident per day — compared to Illinois state averages

Total nursing care / resident Info This home is ranked 137th out of 172 homes in Illinois for nurse hours. Total adjusted nursing hours per resident per day, combining RN, LPN, and aide time. CMS adjusts this for case-mix so facilities can be fairly compared.
2h 26m per day
Rank #137 / 172Nurse hours — State benchmarkedThis home is ranked 137th out of 172 homes in Illinois. Shows adjusted nurse hours per resident per day benchmarked to the Illinois average, with a ranking across 172 Illinois facilities. More hours mean more direct care. The national average is about 3.5 hrs; below 3.0 is a red flag.Rankings are based only on facilities in Illinois that report data for that category. Facilities without available data are excluded from the ranking.Click the rank badge to see the full State ranking.Click here to see the full State ranking.
This facility Illinois avg (3h 6m per day)
vs Illinois avg
-21%

5 of 6 metrics below state avg

Standout metric LPN / LVN is +50% above state avg
Staff typeHours / Day / Residentvs state avg
Registered Nurse (RN) Info RNs hold the highest nursing license and can assess residents, interpret test results, and direct care plans. More RN hours per day often signals stronger clinical oversight and faster response to health changes. 29m per day ▼ 34% State avg: 44m per day · National avg: 41m per day
LPN / LVN Info Licensed Practical Nurses (LPNs) or Licensed Vocational Nurses (LVNs) deliver routine hands-on care — medication administration, wound dressing, and monitoring vital signs. They work under RN supervision and make up a large share of daily bedside care. 57m per day ▲ 50% State avg: 38m per day · National avg: 52m per day
Nurse Aide Info Certified Nurse Aides (CNAs) provide the most direct day-to-day assistance: bathing, dressing, feeding, and mobility. Nurse aide hours are typically the largest staffing category and directly affect residents' quality of life. 1h 48m per day ▼ 16% State avg: 2h 8m per day · National avg: 2h 21m per day
Weekend Total Nursing Info Combined nursing hours (RN + LPN + Nurse Aide) per resident per day on weekends. Staffing often drops on weekends — this figure reveals whether the facility maintains adequate coverage outside of weekday hours. 2h 46m per day ▼ 10% State avg: 3h 5m per day · National avg: 3h 26m per day
Physical Therapist Info Hours per resident per day provided by licensed Physical Therapists (PTs) or PT Assistants. PT services help residents recover mobility after injury or illness and are especially important for post-acute (short-stay) rehabilitation. 2m per day ▼ 26% State avg: 3m per day · National avg: 4m per day
Weekend RN Info Registered nurse hours specifically on weekends. Facilities sometimes reduce RN presence on Saturdays and Sundays — a low weekend RN figure compared to weekday hours can indicate reduced clinical oversight when most administrative staff are absent. 20m per day ▼ 41% State avg: 34m per day · National avg: 29m per day

Capacity and availability

This home usually has availability

Higher occupancy than the Illinois average: 69.3%
Occupancy rate
74.7% Rank #102 / 204Occupancy rate — State benchmarkedThis home is ranked 102nd out of 204 homes in Illinois. Shows this facility's occupancy rate versus the Illinois average, with its Statewide rank out of 204. Higher occupancy signals strong local demand and financial stability.Rankings are based only on facilities in Illinois that report data for that category. Facilities without available data are excluded from the ranking.Click the rank badge to see the full State ranking.Click here to see the full State ranking.
Avg. Length of Stay
83 days
Bed community size
171-bed community Rank #40 / 426Bed count — State benchmarkedThis home is ranked 40th out of 426 homes in Illinois. Shows this facility's certified or reported bed count compared to other Illinois facilities. Larger communities may offer more amenities, programs, and on-site services for residents and families.Rankings are based only on facilities in Illinois that report data for that category. Facilities without available data are excluded from the ranking.Click the rank badge to see the full State ranking.Click here to see the full State ranking.
A large-scale community that may provide a wide range of amenities, services, and structured programs.
Walk Score
Walk Score: 53 / 100 Rank #299 / 648Walk Score — State benchmarkedThis home is ranked 299th out of 648 homes in Illinois. Shows how walkable this facility's neighborhood is compared to the average Walk Score across Illinois facilities. Higher scores benefit residents, families, and staff.Rankings are based only on facilities in Illinois that report data for that category. Facilities without available data are excluded from the ranking.Click the rank badge to see the full State ranking.Click here to see the full State ranking.
Moderately walkable. Some errands can be accomplished on foot, with a mix of nearby amenities.

Therapy & Rehabilitation

1 service
Rehabilitation Services

Staffing & Medical

1 service
24-Hour Staffing

Amenities & Lifestyle

Specific ProgramsShort term rehabilitation, colostomy care, dental care, laboratory services

Contact Elevate Care South Holland

Staffing Data

Reporting period: October 1 – December 31, 2025 (Q4 2025). Source: CMS Payroll-Based Journal report.

Total staff 218
Employees 173
Contractors 45
Staff to resident ratio 1.85 : 1
0% compared with Illinois average
Illinois average ratio: 1.80 : 1 Illinois average ratio: 1.80 : 1See full Illinois ranking
Avg staff/day 69
Average shift 7.3 hours
0% compared with Illinois average
Illinois average: 7.6 hours Illinois average shift: 7.6 hoursSee full Illinois ranking
Total staff hours (quarter) 46,413

Nursing staff breakdown

Q4 2025 · Oct 1 – Dec 31 More info This data comes from the CMS Payroll-Based Journal report covering October 1 – December 31, 2025.
Registered Nurse

Manages medical care and health needs.

RN Staff Info 45 total: 27 full-time employees and 18 contractors. 45
Average shift length Info Average shift length. Calculated as total hours divided by days worked and average staff per day. 7.5 hours
Licensed Practical Nurse

Assists with medical care and medications.

LPN Staff Info 42 total: 39 full-time employees and 3 contractors. 42
Average shift length Info Average shift length. Calculated as total hours divided by days worked and average staff per day. 7.7 hours
Certified Nursing Assistant

Helps with daily care and mobility.

CNA Staff Info 85 total: 81 full-time employees and 4 contractors. 85
Average shift length Info Average shift length. Calculated as total hours divided by days worked and average staff per day. 6.9 hours

Contractor staffing

Q4 2025 · Oct 1 – Dec 31 More info This data comes from the CMS Payroll-Based Journal report covering October 1 – December 31, 2025.

Total hours from contractors

8%

3,709 contractor hours this quarter

Registered Nurse: 18 Respiratory Therapy Technician: 7 Certified Nursing Assistant: 4 Licensed Practical Nurse: 3 Physical Therapy Assistant: 3 Physical Therapy Aide: 3 Speech Language Pathologist: 2 Qualified Social Worker: 2 Occupational Therapy Aide: 2 Occupational Therapy Assistant: 1

Staff by category

Q4 2025 · Oct 1 – Dec 31 More info This data comes from the CMS Payroll-Based Journal report covering October 1 – December 31, 2025.
Certified Nursing Assistant8148520,25592100%6.9
Licensed Practical Nurse393429,76092100%7.7
Registered Nurse2718454,92092100%7.5
Qualified Activities Professional120122,70992100%8.8
Other Dietary Services Staff6062,27992100%7.4
Speech Language Pathologist0229806975%7.6
RN Director of Nursing2029206470%8
Dietitian2026006470%8
Physical Therapy Aide0335356773%6.5
Physical Therapy Assistant0335337177%7.5
Administrator1015126470%8
Nurse Practitioner1015126470%8
Dental Services Staff1014836571%7.4
Mental Health Service Worker1014725964%8
Qualified Social Worker0224456267%7
Respiratory Therapy Technician0774146368%5
Occupational Therapy Assistant0114678%6.6
Occupational Therapy Aide02238910%4.3
85 Certified Nursing Assistant
% of Days 100%
42 Licensed Practical Nurse
% of Days 100%
45 Registered Nurse
% of Days 100%
12 Qualified Activities Professional
% of Days 100%
6 Other Dietary Services Staff
% of Days 100%
2 Speech Language Pathologist
% of Days 75%
2 RN Director of Nursing
% of Days 70%
2 Dietitian
% of Days 70%
3 Physical Therapy Aide
% of Days 73%
3 Physical Therapy Assistant
% of Days 77%
1 Administrator
% of Days 70%
1 Nurse Practitioner
% of Days 70%
1 Dental Services Staff
% of Days 71%
1 Mental Health Service Worker
% of Days 64%
2 Qualified Social Worker
% of Days 67%
7 Respiratory Therapy Technician
% of Days 68%
1 Occupational Therapy Assistant
% of Days 8%
2 Occupational Therapy Aide
% of Days 10%

Penalties and fines

Includes penalties issued in 2023-2025

Federal penalties imposed by CMS for regulatory violations, including civil money penalties (fines) and denials of payment for new Medicare/Medicaid admissions.

Source: CMS Penalties Database (Data as of Jan 2026)

Total fines amount $207K Rank #144 / 173Federal fines — State benchmarkedThis home is ranked 144th out of 173 homes in Illinois. Shows this facility's cumulative CMS federal fine dollars versus the Illinois average among facilities with fines, and where it ranks among 173 facilities in the pool. Lower total dollars mean a better rank.Rankings are based only on facilities in Illinois that report data for that category. Facilities without available data are excluded from the ranking.Click the rank badge to see the full State ranking.Click here to see the full State ranking.
45% higher than Illinois average

Illinois average: $143K

Number of fines 6
102% more fines than Illinois average

Illinois average: 3.0

Payment Denials Info Serious action where Medicare and/or Medicaid temporarily stops payments for new residents until issues are fixed. 0
100% fewer payment denials than Illinois average

Illinois average: 1.1

Fines amount comparison
This facility $207K
Illinois average $143K
Penalty History

Penalties are imposed by CMS for violations of federal nursing home regulations.

5 penalties in the past 3 years

Multiple penalties were reported in the last 3 years.

Civil Money Penalty Info Fines imposed for noncompliance, which can be assessed per day or per instance of violation. Jan 7, 2025
$19K
Civil Money Penalty Info Fines imposed for noncompliance, which can be assessed per day or per instance of violation. Nov 7, 2024
$45K
Civil Money Penalty Info Fines imposed for noncompliance, which can be assessed per day or per instance of violation. Jul 12, 2024
$17K
Civil Money Penalty Info Fines imposed for noncompliance, which can be assessed per day or per instance of violation. Feb 23, 2024
$44K

Last updated: Jan 2026

Quality of care over time

These measures show how residents usually do over time at this home, based on health outcomes and preventive care.

High-risk clinical events score Info A composite score based on pressure ulcers, falls with injury, weight loss, walking ability decline, and activities of daily living decline. 7.0
28% better than Illinois average

Illinois average: 9.7

Functional decline score Info A composite score based on activities of daily living decline, walking ability decline, and incontinence. 12.4
33% better than Illinois average

Illinois average: 18.6

Long-stay resident measures
Significantly above average Illinois avg: 3.6 Info CMS star rating based on long-stay quality measure performance. 5 stars = significantly above average, 1 star = significantly below average.
Need for Help with Daily Activities Increased Info Percent of long-stay residents whose need for help with daily activities has increased 6.5%
58% better than Illinois average

Illinois average: 15.5%

Walking Ability Worsened Info Percent of long-stay residents whose ability to move independently worsened 5.1%
72% better than Illinois average

Illinois average: 18.4%

Low Risk Residents with Bowel/Bladder Incontinence Info Percent of low risk long-stay residents who lose control of their bowels or bladder 25.7%
19% worse than Illinois average

Illinois average: 21.6%

Falls with Major Injury Info Percent of long-stay residents experiencing one or more falls with major injury 1.4%
57% better than Illinois average

Illinois average: 3.4%

High Risk Residents with Pressure Ulcers Info Percent of long-stay high risk residents with pressure ulcers 10.2%
94% worse than Illinois average

Illinois average: 5.3%

Urinary Tract Infection Info Percent of long-stay residents with a urinary tract infection 0.5%
73% better than Illinois average

Illinois average: 1.8%

Lost Too Much Weight Info Percent of long-stay residents who lose too much weight 11.7%
79% worse than Illinois average

Illinois average: 6.5%

Depressive Symptoms Info Percent of long-stay residents who have depressive symptoms 90.4%
88% worse than Illinois average

Illinois average: 48.1%

Antipsychotic Use Info Percent of long-stay residents who received an antipsychotic medication 11.7%
42% better than Illinois average

Illinois average: 20.2%

Pneumococcal Vaccine Info Percent of long-stay residents assessed and appropriately given the pneumococcal vaccine 54.8%
39% worse than Illinois average

Illinois average: 89.2%

Influenza Vaccine Info Percent of long-stay residents assessed and appropriately given the seasonal influenza vaccine 88.1%
In line with Illinois average

Illinois average: 91.6%

Short-stay resident measures
Below average Illinois avg: 2.3 Info CMS star rating based on short-stay quality measure performance. 5 stars = much above average, 1 star = much below average.
Pneumococcal Vaccine Info Percent of short-stay residents assessed and appropriately given the pneumococcal vaccine 34.5%
49% worse than Illinois average

Illinois average: 68.3%

Antipsychotic medication increase Info Percent of short-stay residents who newly received an antipsychotic medication 1.1%
55% better than Illinois average

Illinois average: 2.3%

Influenza Vaccine Info Percent of short-stay residents assessed and appropriately given the seasonal influenza vaccine 51.9%
18% worse than Illinois average

Illinois average: 63.0%

Re-hospitalized after SNF stay Info Percentage of short-stay residents who were re-hospitalized after their nursing home admission. 23.6%
10% better than Illinois average

Illinois average: 26.2%

Emergency department visits Info Percentage of short-stay residents who had an outpatient emergency department visit. 7.7%
45% better than Illinois average

Illinois average: 14.0%

Falls with major injury Info Percentage of SNF residents who experience falls with major injury during their stay. 0.0%
100% better than Illinois average

Illinois average: 0.8%

Ability to care for self at discharge Info Percentage of residents at or above expected ability to care for themselves at discharge. 44.9%
16% worse than Illinois average

Illinois average: 53.7%

Successful return to home or community Info Rate of successful return to home or community from a skilled nursing facility. 45.0%
11% worse than Illinois average

Illinois average: 50.6%

Breakdown by payment type

Medicare

27% of new residents, usually for short-term rehab.

Typical stay 25 days

Private pay

60% of new residents, often for short stays.

Typical stay 3 - 4 months

Medicaid

13% of new residents, often for long-term daily care.

Typical stay 5 - 6 months

Facility Characteristics

Source: CMS Long-Term Care Facility Characteristics (Data as of Jan 2026)

Total residents 118
Medicare
23
19.5% of residents
Medicaid
89
75.4% of residents
Private pay or other
6
5.1% of residents
Programs & Services
Residents Group

Residents meet regularly to discuss policies, care quality, and activities

Active Resident Council

Organized group of residents that meets regularly to discuss facility policies, quality of life, and activities.

Finances and operations

Based on CMS SNF Cost Report for fiscal year ending in 12/2023.

For-profit
Individual
Net patient revenue Info Net patient revenue — what the home actually collects for resident care, after contractual allowances, bad debt and discounts are subtracted from its gross charges (CMS cost report, Worksheet G-3). It covers resident care only; money the home earns from other sources is shown separately as "Other income."
$14.8M
Net patient income Info Net patient income: net patient revenue minus the home's total operating expenses. A positive figure means it earns more from resident care than it spends to deliver it; a negative figure means the opposite. It excludes non-operating "other income."
-$2.2M
For-profit Individual
Net patient revenue Info Net patient revenue — what the home actually collects for resident care, after contractual allowances, bad debt and discounts are subtracted from its gross charges (CMS cost report, Worksheet G-3). It covers resident care only; money the home earns from other sources is shown separately as "Other income."
$14.8M Rank #68 / 171Revenue — State benchmarkedThis home is ranked 68th out of 171 homes in Illinois. Shows this facility's annual revenue compared to the Illinois average. Higher revenue generally means more resources for staffing and capital — read alongside Payroll %.Rankings are based only on facilities in Illinois that report data for that category. Facilities without available data are excluded from the ranking.Click the rank badge to see the full State ranking.Click here to see the full State ranking.
Net patient income Info Net patient income: net patient revenue minus the home's total operating expenses. A positive figure means it earns more from resident care than it spends to deliver it; a negative figure means the opposite. It excludes non-operating "other income."
-$2.2M
Other income Info Money the home earns outside of resident care — such as investments, grants, rentals and other non-operating sources (CMS cost report, Worksheet G-3). It is tracked separately from net patient revenue: it is not part of that figure, and it is not included in net patient income.
$652.1K
Payroll costs Info Staff salaries plus wage-related costs — benefits such as payroll taxes, health insurance and retirement — from the home's own accounting records (CMS cost report, Worksheet A). Contract or agency labor is counted separately, under other operating costs. Rank #74 / 171Payroll — State benchmarkedThis home is ranked 74th out of 171 homes in Illinois. Shows total annual staff payroll benchmarked to the Illinois average. Higher payroll investment relative to peers often signals better staffing and less reliance on cheaper contract labor.Rankings are based only on facilities in Illinois that report data for that category. Facilities without available data are excluded from the ranking.Click the rank badge to see the full State ranking.Click here to see the full State ranking.
$6.8M 46% of net patient revenue Info Payroll as a share of revenue: staff salaries and wage-related benefits divided by net patient revenue. A higher figure means more of each revenue dollar goes to staff pay. Rank #102 / 171Payroll % — State benchmarkedThis home is ranked 102nd out of 171 homes in Illinois. Shows payroll as a percentage of revenue versus the Illinois average. Well-run Illinois facilities typically land around 54–67% — the top third Statewide. Below 25% may signal understaffing or heavy agency use — read with Staffing ratings.Rankings are based only on facilities in Illinois that report data for that category. Facilities without available data are excluded from the ranking.Click the rank badge to see the full State ranking.Click here to see the full State ranking.
Other operating costs Info Everything it costs to run the home apart from payroll — food, utilities, supplies, maintenance, contract labor and administration. Calculated as total operating expense minus payroll (staff salaries and wage-related benefits).
$10.2M
Total costs Info The home's total operating expense for the year — all the costs of running it, salaries included (CMS cost report, Worksheet G-3).
$16.9M

What does this home offer?

Building type icon
Building type icon

Building Type: Single-story

Who this home usually serves

TYPE OF STAY

Primarily short stays

Residents typically stay for brief periods, with frequent admissions and discharges throughout the year.

Most new residents arrive under private pay (60% of admissions), and a typical private pay stay runs around 3 - 4 months.

Admissions
465 total

Coverage residents most often arrive under.

Medicare 27%
Private pay 60%
Medicaid 13%
Discharges
511 total

Coverage residents most often leave under.

Medicare 24%
Private pay 57%
Medicaid 19%

Places of interest near Elevate Care South Holland

Address 0.4 miles from city center Info Estimated distance in miles from South Holland's city center to Elevate Care South Holland's address, calculated via Google Maps.

Calculate Travel Distance to Elevate Care South Holland

Add your location

Address

Compare Nursing Homes around Olympia Fields

The information below is reported by the Illinois Department of Public Health, Office of Health Care Regulation.

2 facilities compared · CMS & IL Dept. of Health data

Prairie Manor Rehabilitation & Healthcare
NH
MC
PC
Chicago Heights
148
Facility 148
IL AVG 86
Rank #55 / 426
85.6%
Facility 85.6%
IL AVG 69.3%
Rank #54 / 204
+24%
2.58
Facility 2.58
IL AVG 3.10
Rank #114 / 172
-32%-17%
$0
Facility $0
IL AVG $151.3k
Rank #1 / 173
30
Facility 30
IL AVG 36.8
Rank #79 / 172
3.8
Facility 3.8
IL AVG 3.7
Rank #103 / 172
3128-
28
Facility 28
IL AVG 51
Rank #509 / 648
Mary Stucker
$15.0M
Facility $15.0M
IL AVG $12.2M
Rank #63 / 171
$8.3M
Facility $8.3M
IL AVG $4.8M
Rank #53 / 171
55.7%
Facility 55.7%
IL AVG 44.3%
Rank #77 / 171
145629
Elevate Care South Holland
NH
AL
IL
MC
South Holland
171
Facility 171
IL AVG 86
Rank #40 / 426
74.7%
Facility 74.7%
IL AVG 69.3%
Rank #102 / 204
+8%
2.44
Facility 2.44
IL AVG 3.10
Rank #137 / 172
+45%-21%
$171.6k
Facility $171.6k
IL AVG $151.3k
Rank #144 / 173
43
Facility 43
IL AVG 36.8
Rank #117 / 172
3.1
Facility 3.1
IL AVG 3.7
Rank #58 / 172
13122-
53
Facility 53
IL AVG 51
Rank #299 / 648
Meir Meystel Revocable
$14.8M
Facility $14.8M
IL AVG $12.2M
Rank #68 / 171
$6.8M
Facility $6.8M
IL AVG $4.8M
Rank #74 / 171
46%
Facility 46%
IL AVG 44.3%
Rank #102 / 171
145671

Financial Assistance for
Nursing Home in Illinois

Elevate Care South Holland is located in South Holland, Illinois.
Here are the financial assistance programs available to residents in Illinois.

Get Financial aid guidance

Community Care Program

Illinois CCP

Age 60+
General Illinois resident, at risk of nursing home placement.
Income Limits (2025) ~$1,215/month individual
Asset Limits $17,500 individual, excludes home, car
IL

High demand in urban areas; waitlists possible.

Benefits
In-home care (3-5 hours/day) Adult day services ($65/day) Emergency home response systems ($30/month)

Illinois Respite Program

IL Respite (via NFCSP)

Age Caregiver of someone 60+ (or with dementia)
General Illinois resident.
Income Limits No strict limit; prioritizes low-income.
Asset Limits Not applicable.
IL

Limited slots; urban/rural balance.

Benefits
In-home respite (4-6 hours/day) Adult day care (~$65/day) Short-term facility care (up to 5 days)

Supportive Living Program (SLP)

Illinois Medicaid Supportive Living Program

Age 65+ or 22-64 with disability
General Illinois resident, Medicaid-eligible, needs moderate assistance (not nursing home-level).
Income Limits (2025) ~$2,829/month (300% FBR, individual); QIT allowed.
Asset Limits $2,000 (individual), $3,000 (couple) (excludes home, car).
IL

~200 SLP sites statewide; room/board not covered.

Benefits
Personal care (5-7 hours/day, e.g., bathing, mobility) Meals Housekeeping Medication management Respite (~240 hours/year)

Persons Who Are Elderly Waiver

Illinois Medicaid Elderly Waiver

Age 65+
General Illinois resident, Medicaid-eligible, nursing home-level care need.
Income Limits (2025) ~$2,829/month 300% FBR, individual
Asset Limits $2,000 (individual), $3,000 (couple).
IL

Part of HealthChoice Illinois; consumer-directed options available.

Benefits
Personal care (5-7 hours/day, e.g., dressing, eating) Homemaker Adult day care (~$60/day) Respite (240 hours/year) Home mods ($1,000 avg.)

Medicare Savings Program (MSP)

Illinois Medicare Savings Program

Age 65+ or disabled
General Illinois resident, Medicare Part A/B.
Income Limits (2025) ~$2,510/month (QMB), ~$3,380/month (SLMB), ~$3,598/month (QI)—individual.
Asset Limits $9,430 (individual), $14,130 (couple).
IL

Three tiers; no waitlist.

Benefits
Covers Part B premiums ($174.70/month) Deductibles ($240/year) Copays (~20%)

Optional State Supplementation (OSS)

Illinois Optional State Supplementation

Age 65+ or disabled
General Illinois resident, in approved facility, SSI recipient or low-income.
Income Limits (2025) ~$1,004/month including SSI
Asset Limits $2,000 (individual), $3,000 (couple).
IL

~$50-$500/month based on facility type.

Benefits
Cash (~$50-$500/month) for room/board in personal care homes or SLFs

VA Aid and Attendance (A&A) and Housebound Benefits

Illinois VA Aid and Attendance/Housebound

Age 65+ or disabled veteran/spouse
General Illinois resident, wartime service, need for ADL help (A&A) or homebound.
Income Limits (2025) Net income < ~$1,984/month (veteran with dependent, A&A); pension offsets income.
Asset Limits ~$155,356 net worth limit
IL

High veteran demand in urban/rural areas.

Benefits
Cash (~$1,433-$2,642/month veteran, ~$951-$1,318 spouse) for care costs (e.g., in-home, assisted living)

Frequently Asked Questions about Elevate Care South Holland

What neighborhood is Elevate Care South Holland in?

Elevate Care South Holland is in the South Holland neighborhood.

Is Elevate Care South Holland in a walkable area?

Elevate Care South Holland has a walk score of 53. Moderately walkable. Some errands can be accomplished on foot, with a mix of nearby amenities.

What is the occupancy rate at Elevate Care South Holland?

Elevate Care South Holland's occupancy is 74.7%.

Does Elevate Care South Holland operate as a for-profit or non-profit?

Elevate Care South Holland is registered as a for-profit.

Are there photos of Elevate Care South Holland?

Yes — there are 23 photos of Elevate Care South Holland in the photo gallery on this page.

What is the address of Elevate Care South Holland?

Elevate Care South Holland is located at 16300 Wausau Ave, South Holland, IL 60473.

What is the phone number of Elevate Care South Holland?

(708) 333-0700 will put you in contact with the team at Elevate Care South Holland.

Guides for Better Senior Living

Care Cost Calculator: See Prices in Your Area

Nursing Home Data Explorer

Don’t Wait Too Long: 7 Red Flag Signs Your Parent Needs Assisted Living Now

The True Cost of Assisted Living in 2025 – And How Families Are Paying For It

Understanding Senior Living Costs: Pricing Models, Discounts & Financial Assistance