Total health inspections
18
Illinois average 10.4
Last Health inspection on Jul 2025

We arrange tours, appointments, and even moving support so you don’t have to


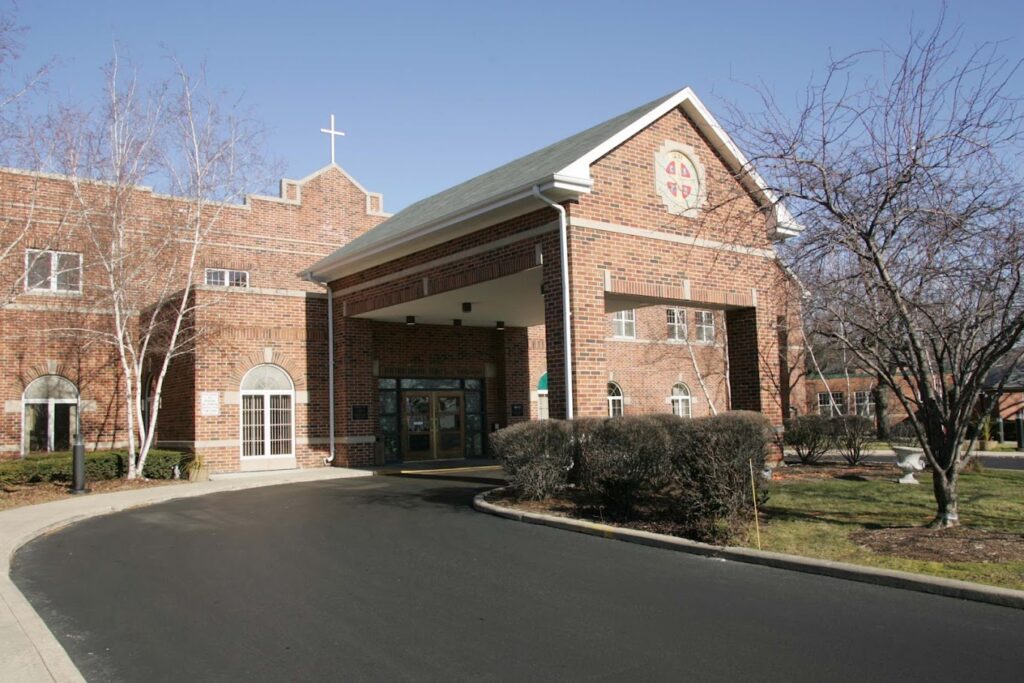
Conveniently nestled in Chicago, IL, Elevate Care Windsor Park offers a safe and convenient setting for those needing short-term rehabilitation and skilled nursing care. Residents here recover from their hospitalization, injury, or illness in spacious and welcoming accommodations tailored to their needs. An excellent care team is always available to assist residents and oversee their individualized care plans to guarantee the proper delivery of care.
The community is fully equipped to provide the services, therapies, and support residents need to successfully recover or maintain their functionality. With an all-around team of care professionals, residents here typically don’t have to move into another community for their needs. Here, everyone is met with genuine care that allows them to recover with ease.
 Official CMS rating based on health inspections, staffing and quality measures.
Official CMS rating based on deficiencies found during state health inspections.
Official CMS rating based on nurse staffing hours per resident per day.
Official CMS rating based on clinical outcomes for residents.
Average daily nursing hours per resident (adjusted for acuity). Higher values indicate more nursing time per resident.
Hours of care per resident per day, broken down by staff type. Data from CMS Medicare.
Registered nurse hours per resident per day.
Nurse aide hours per resident per day.
Total number of nurse staff hours per resident per day on weekends.
Physical therapist staff hours per resident per day.
Registered nurse hours per resident per day on weekends.
Official CMS rating based on health inspections, staffing and quality measures.
Official CMS rating based on deficiencies found during state health inspections.
Official CMS rating based on nurse staffing hours per resident per day.
Official CMS rating based on clinical outcomes for residents.
Average daily nursing hours per resident (adjusted for acuity). Higher values indicate more nursing time per resident.
Hours of care per resident per day, broken down by staff type. Data from CMS Medicare.
Registered nurse hours per resident per day.
Nurse aide hours per resident per day.
Total number of nurse staff hours per resident per day on weekends.
Physical therapist staff hours per resident per day.
Registered nurse hours per resident per day on weekends.
May provide extensive amenities, services and programs.
Lower occupancy suggests more openings may be available.
This home supports both short-term rehab and long-term care, with residents staying for a wide range of durations.
31% of new residents, usually for short-term rehab.
55% of new residents, often for short stays.
13% of new residents, often for long-term daily care.
The portion of the home's budget spent on staff, including nurses, caregivers, and other employees who support care and operations.
All remaining costs needed to run the home, such as food, utilities, building maintenance, supplies and administrative expenses.
Housing Options: Private / Shared Rooms
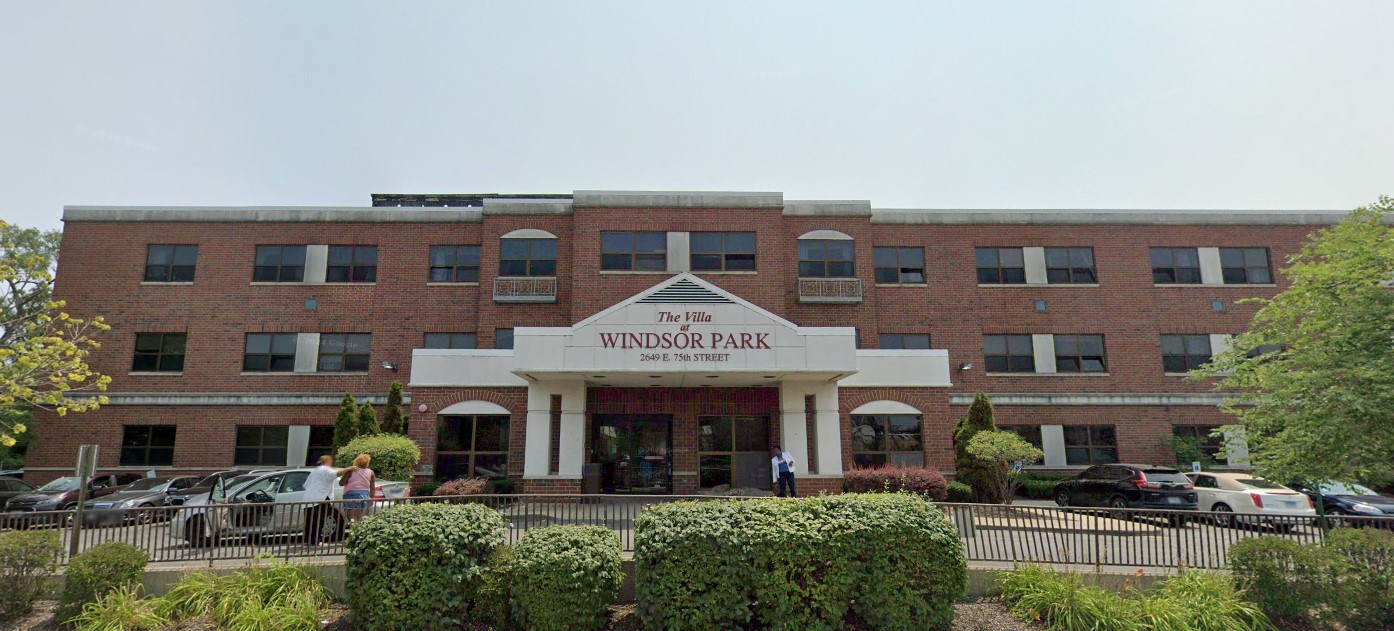
Building Type: 3-story
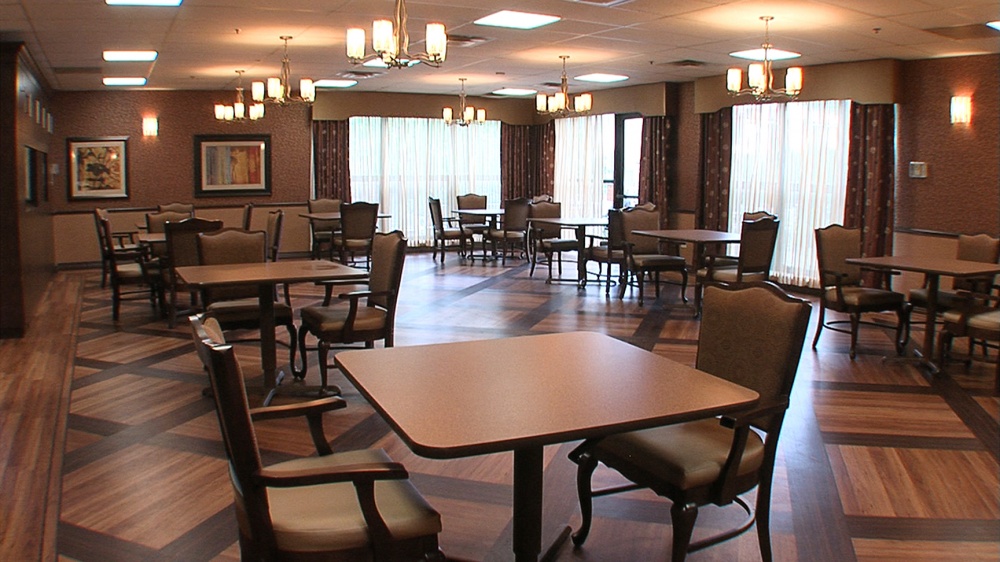
Dining Services
Housekeeping Services
Beauty Services
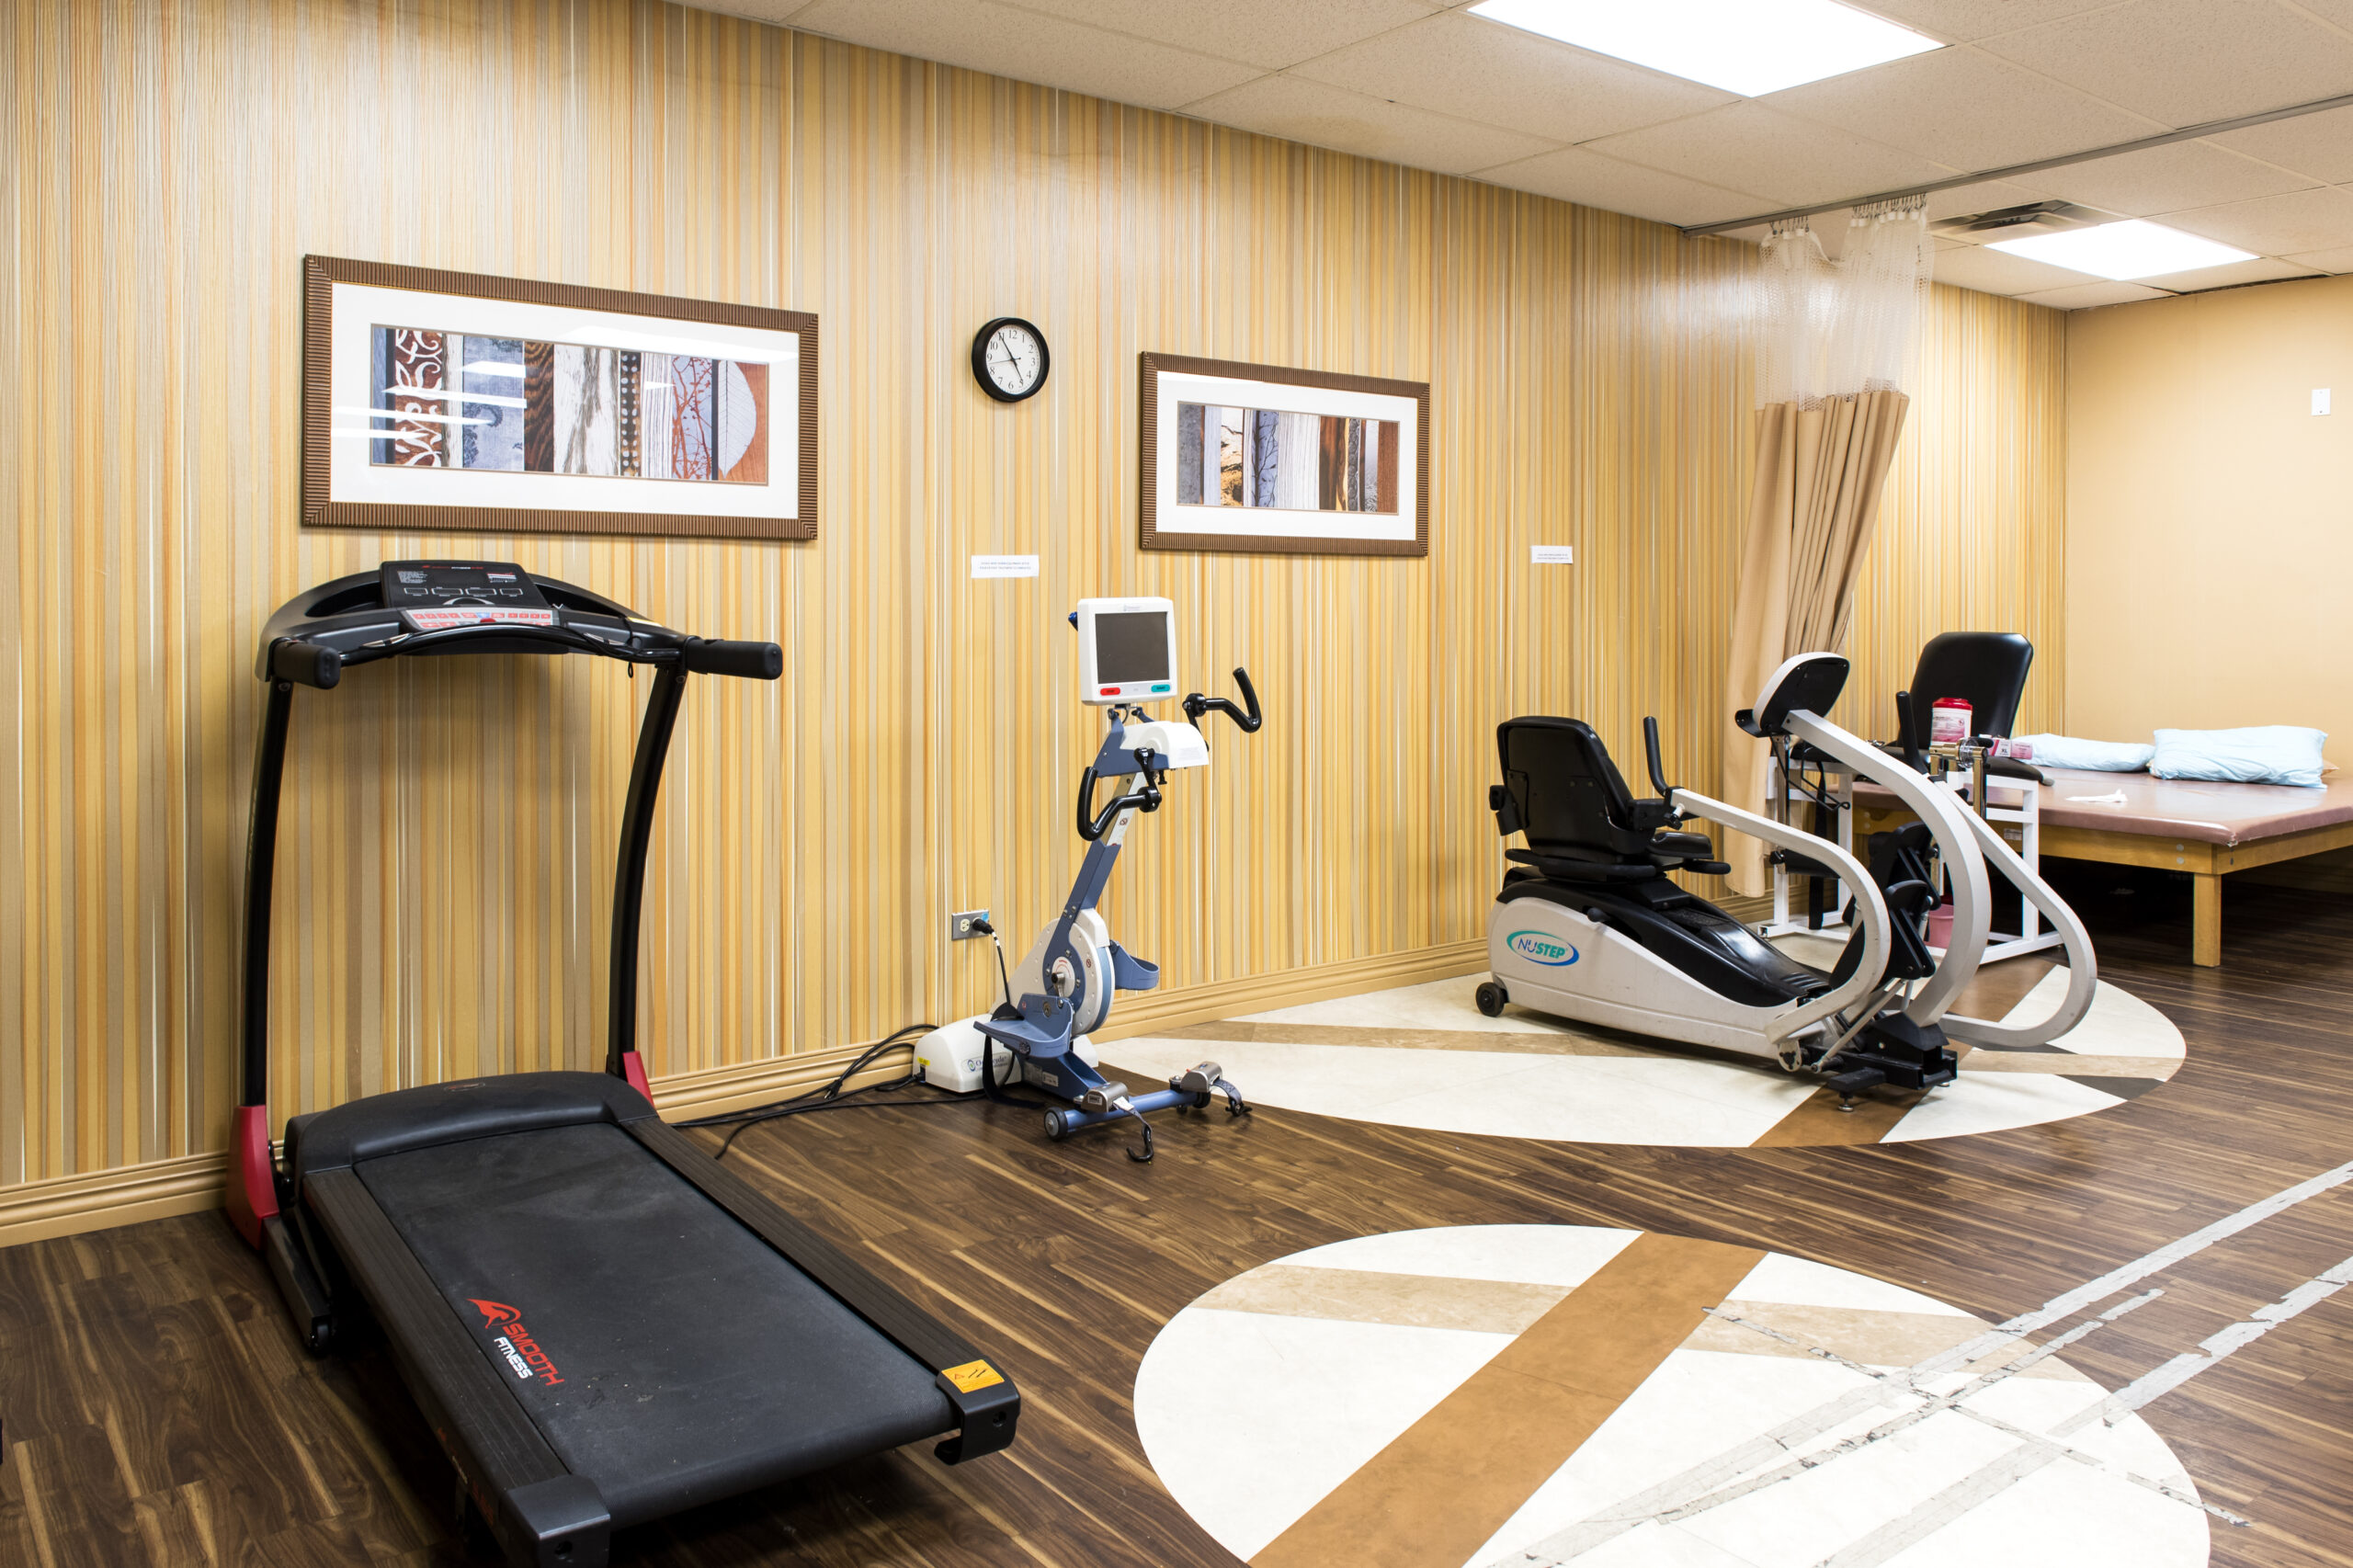
Exercise Programs
Recreational Activities
In Illinois, the Department of Public Health, Office of Health Care Regulation conducts annual unannounced surveys to assess compliance with state and federal healthcare facility standards.
Illinois average 10.4
Last Health inspection on Jul 2025
Health citations are formal notices following inspections when they fail to comply with safety and care standards.
53 of 83 citations resulted from standard inspections; 29 of 83 resulted from complaint investigations; and 1 of 83 came from combined inspections (standard and complaint).
Illinois average: 0.7
Illinois average: 3.6
Data sourced from CMS Health Deficiencies reports. Citation severity codes range from A (least serious) to L (most serious). Immediate Jeopardy (J-L) citations indicate situations where the facility's noncompliance has placed residents at risk of death or serious harm.
Nursing Home 24/7 care needed
Hospice Care
Respite Care
Skilled Nursing
Hospice Care
Independent Living For self-sufficient seniors seeking community and minimal assistance.
Memory Care Specialized care for those with Memory Loss, Alzheimer's, or dementia, ensuring safety and support.
Nursing Homes 24/7 care needed
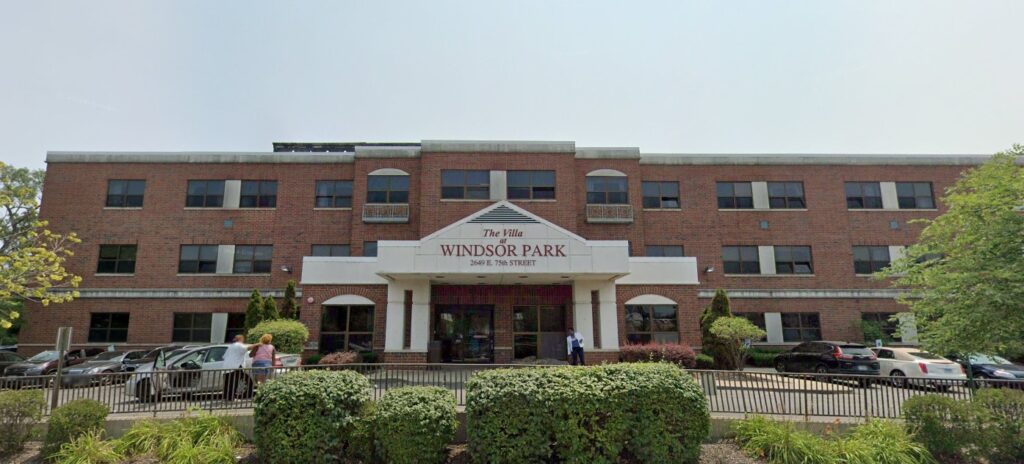 Elevate Care Windsor Park
![]() 10.1 miles from city center
10.1 miles from city center
![]() 2649 E 75th St, Chicago, IL 60649
2649 E 75th St, Chicago, IL 60649
Add your location
Source: CMS Payroll-Based Journal (Q2 2025)
| Role ⓘ | Count ⓘ | Avg Shift (hrs) ⓘ | Uses Contractors? ⓘ |
|---|---|---|---|
| Registered Nurse | 45 | 7.6 | Yes |
| Licensed Practical Nurse | 72 | 8.3 | Yes |
| Certified Nursing Assistant | 114 | 7.2 | Yes |
| Role ⓘ | Employees ⓘ | Contractors ⓘ | Total Staff ⓘ | Total Hours ⓘ | Days Worked ⓘ | % of Days ⓘ | Avg Shift (hrs) ⓘ |
|---|---|---|---|---|---|---|---|
| Certified Nursing Assistant | 112 | 2 | 114 | 30,973 | 91 | 100% | 7.2 |
| Licensed Practical Nurse | 47 | 25 | 72 | 16,740 | 91 | 100% | 8.3 |
| Registered Nurse | 14 | 31 | 45 | 4,516 | 91 | 100% | 7.6 |
| Other Dietary Services Staff | 5 | 0 | 5 | 2,126 | 90 | 99% | 7.4 |
| Dental Services Staff | 2 | 0 | 2 | 967 | 86 | 95% | 7.9 |
| RN Director of Nursing | 3 | 0 | 3 | 944 | 80 | 88% | 6.8 |
| Nurse Practitioner | 1 | 0 | 1 | 640 | 61 | 67% | 10.5 |
| Administrator | 2 | 0 | 2 | 504 | 63 | 69% | 8 |
| Dietitian | 1 | 0 | 1 | 488 | 61 | 67% | 8 |
| Physical Therapy Assistant | 0 | 2 | 2 | 480 | 61 | 67% | 7.9 |
| Physical Therapy Aide | 0 | 1 | 1 | 468 | 64 | 70% | 7.3 |
| Speech Language Pathologist | 0 | 1 | 1 | 455 | 61 | 67% | 7.5 |
| Respiratory Therapy Technician | 0 | 1 | 1 | 448 | 56 | 62% | 8 |
| Mental Health Service Worker | 1 | 0 | 1 | 416 | 52 | 57% | 8 |
| Qualified Social Worker | 0 | 1 | 1 | 90 | 32 | 35% | 2.8 |
| Occupational Therapy Aide | 0 | 1 | 1 | 85 | 11 | 12% | 7.7 |
Source: CMS Long-Term Care Facility Characteristics (Data as of Jan 2026)
Residents meet regularly to discuss policies, care quality, and activities
Organized group of residents that meets regularly to discuss facility policies, quality of life, and activities.
Data sourced from CMS Long-Term Care Facility Characteristics quarterly report. Payer mix reflects the current resident census by primary payment source.
These measures show how residents usually do over time at this home, based on health outcomes and preventive care.
Illinois average: 9.7
Illinois average: 18.6
Illinois average: 15.5%
Illinois average: 18.4%
Illinois average: 21.6%
Illinois average: 3.4%
Illinois average: 5.3%
Illinois average: 1.8%
Illinois average: 6.5%
Illinois average: 48.1%
Illinois average: 20.2%
Illinois average: 89.2%
Illinois average: 91.6%
Illinois average: 68.3%
Illinois average: 2.3%
Illinois average: 63.0%
Illinois average: 26.2%
Illinois average: 14.0%
Illinois average: 0.8%
Illinois average: 53.7%
Illinois average: 50.6%
Quality measures are calculated from Minimum Data Set (MDS) assessments. For most measures, lower percentages indicate better care quality.
Federal penalties imposed by CMS for regulatory violations, including civil money penalties (fines) and denials of payment for new Medicare/Medicaid admissions.
Source: CMS Penalties Database (Data as of Jan 2026)
Illinois average: $143K
Illinois average: 3.0
Illinois average: 1.1
Penalties are imposed by CMS for violations of federal nursing home regulations.
Last updated: Jan 2026
Historical financial and operational data for Elevate Care Windsor Park based on CMS SNF Cost Reports.
Loading trend charts...
Care Cost Calculator: See Prices in Your Area
Nursing Home Data Explorer
Don’t Wait Too Long: 7 Red Flag Signs Your Parent Needs Assisted Living Now
The True Cost of Assisted Living in 2025 – And How Families Are Paying For It
Understanding Senior Living Costs: Pricing Models, Discounts & Financial Assistance

Touring a community? Use this expert-backed checklist to stay organized, ask the right questions, and find the perfect fit.
We'll send you a PDF version of the touring checklist.