Citadel at Saint Benedict
Nursing Home & Nursing Care · Cook County, IL
CMS overall rating Info CMS (the Centers for Medicare & Medicaid Services) is the federal agency that rates nursing home quality. Its Overall Rating runs from 1 to 5 stars, combining health inspections, staffing, and quality measures, with inspections weighted most heavily.

Citadel at Saint Benedict

Nursing Home & Nursing Care · Cook County, IL
CMS overall rating Info CMS (the Centers for Medicare & Medicaid Services) is the federal agency that rates nursing home quality. Its Overall Rating runs from 1 to 5 stars, combining health inspections, staffing, and quality measures, with inspections weighted most heavily.
Calculator: See prices in your area
Citadel at Saint Benedict accepts Medicare, Medicaid, and private pay.

Overview of Citadel at Saint Benedict

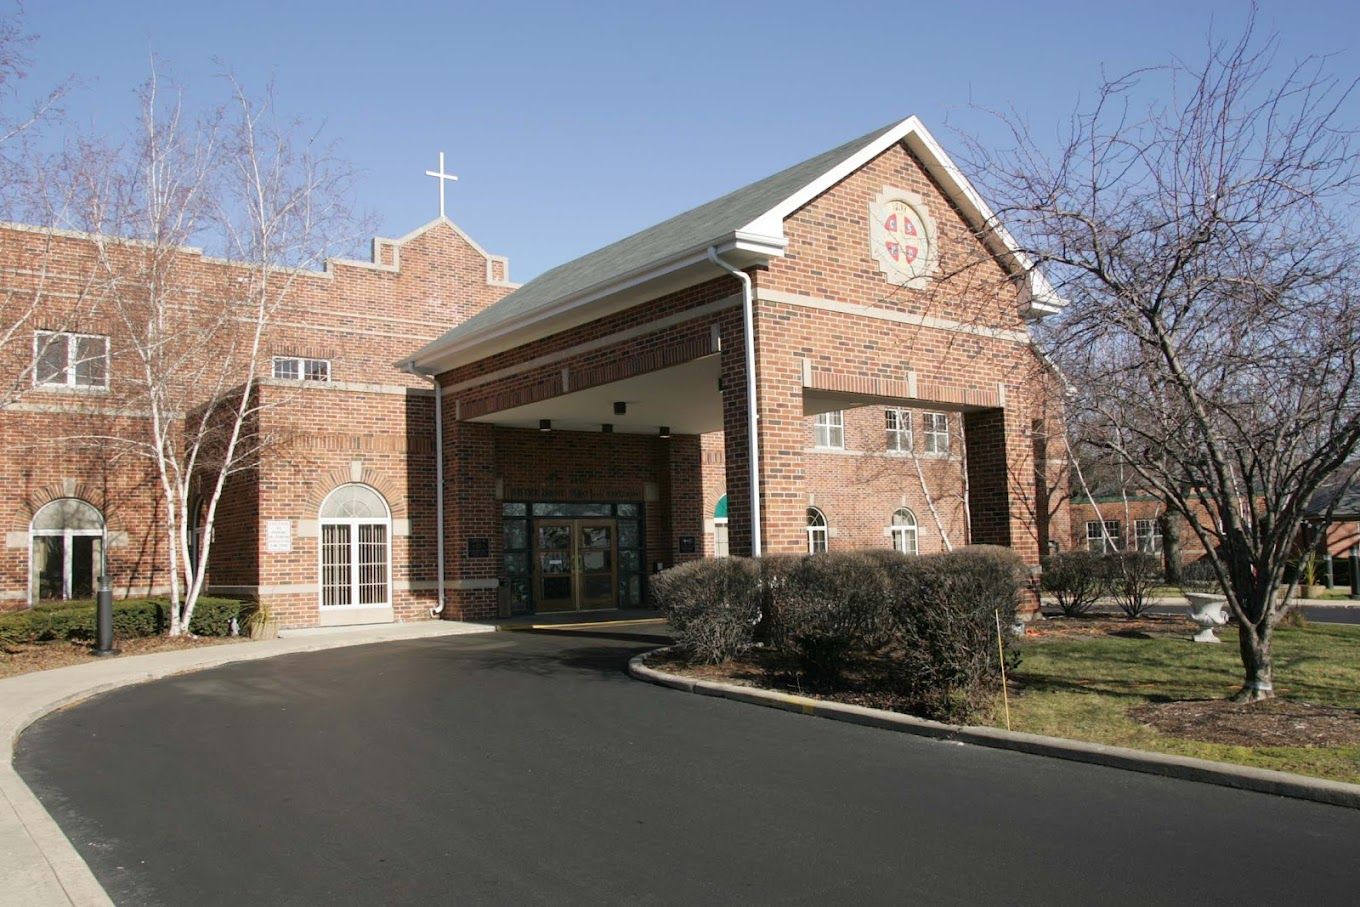
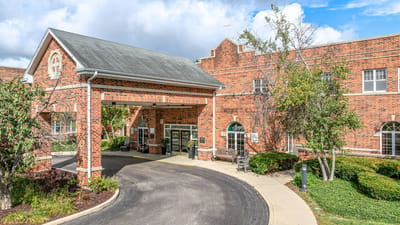
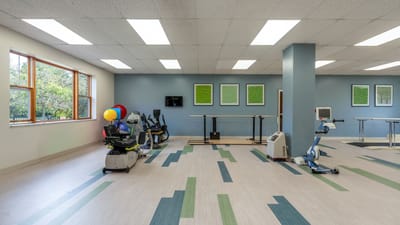
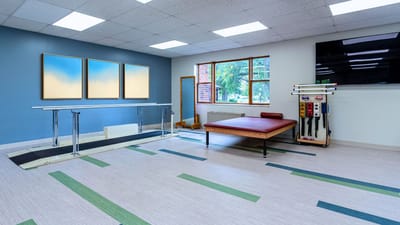
Dedicated to delivering a high quality of life, Citadel at Saint Benedict is a reliable community in Niles, IL that offers an array of care options. This community provides access to independent living, rehabilitation, memory care, and skilled nursing to accommodate residents’ changing needs. Residents here are empowered to focus on their happiness and well-being in their maintenance-free residence with support from a dependable care team.

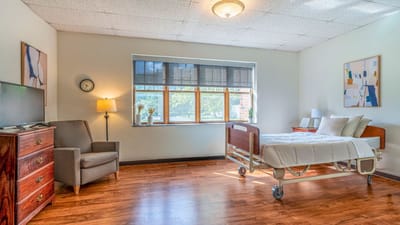
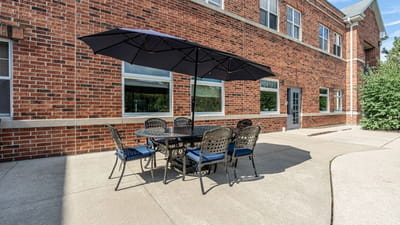
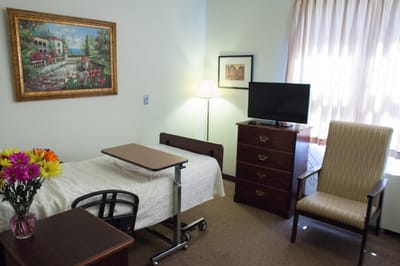
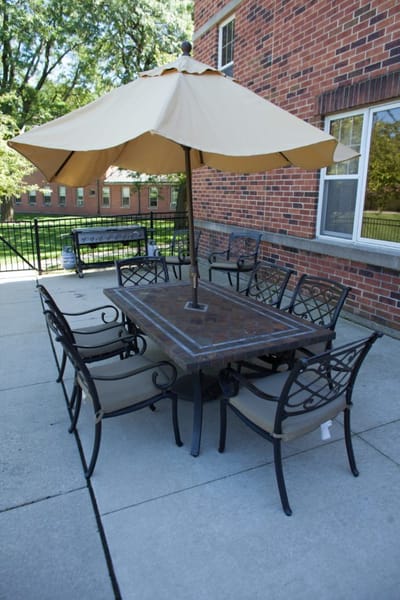
With a seamless blend of comfort, security, and recreation, residents here are bound to enjoy a wholesome living environment. Private and semi-private suites are surrounded by refreshing gardens and open-air courtyards that provide spaces for socialization and relaxation. Here, everyone is empowered to maintain their independence and functionality to enjoy the retirement they’ve dreamed of.

Quality ratings

Measured by Centers for Medicare & Medicaid Services (CMS)

Overall rating Info The Overall CMS Rating combines results from health inspections, staffing levels and quality measures. Health inspections carry the most weight. Staffing and quality scores can increase or decrease the final rating based on performance compared to state and national standards.
▲ 58.7% Above IL avg. ▲ 58.7% Above IL avg.IL average: 2.5Click the badge to see the full State ranking.Click here to see the full State ranking.
Health Inspection Info Based on the results of the facility's three most recent standard inspections and any complaint investigations. CMS reviews the number, scope, and severity of deficiencies, with more recent findings weighted more heavily.
▲ 44.1% Above IL avg. ▲ 44.1% Above IL avg.IL average: 2.8Click the badge to see the full State ranking.Click here to see the full State ranking.
Staffing Info Measures average nursing staff hours per resident per day, including Registered Nurses (RNs) and total nursing staff. Ratings are adjusted based on the level of care residents require and are compared to state and national benchmarks.
▼ 6.4% Below IL avg. ▼ 6.4% Below IL avg.IL average: 2.1Click the badge to see the full State ranking.Click here to see the full State ranking.
Quality Measures Info Based on clinical and physical health indicators reported to CMS, such as hospital readmissions, falls, pressure ulcers, and improvements in mobility. These measures reflect how well residents' health needs are being managed.
▲ 42.1% Above IL avg. ▲ 42.1% Above IL avg.IL average: 2.8Click the badge to see the full State ranking.Click here to see the full State ranking.

Staffing hours breakdown

Info Daily nursing hours per resident by staff type, reported to CMS. Higher is generally better — compare this facility to state and national averages to see where staffing stands.

Hours per resident per day — compared to Illinois state averages

Total nursing care / resident Info This home is ranked 103rd out of 172 homes in Illinois for nurse hours. Total adjusted nursing hours per resident per day, combining RN, LPN, and aide time. CMS adjusts this for case-mix so facilities can be fairly compared.
2h 41m per day
Rank #103 / 172Nurse hours — State benchmarkedThis home is ranked 103rd out of 172 homes in Illinois. Shows adjusted nurse hours per resident per day benchmarked to the Illinois average, with a ranking across 172 Illinois facilities. More hours mean more direct care. The national average is about 3.5 hrs; below 3.0 is a red flag.Rankings are based only on facilities in Illinois that report data for that category. Facilities without available data are excluded from the ranking.Click the rank badge to see the full State ranking.Click here to see the full State ranking.
This facility Illinois avg (3h 6m per day)
vs Illinois avg
-14%

4 of 6 metrics below state avg

Standout metric Physical Therapist is +147% above state avg
Staff typeHours / Day / Residentvs state avg
Registered Nurse (RN) Info RNs hold the highest nursing license and can assess residents, interpret test results, and direct care plans. More RN hours per day often signals stronger clinical oversight and faster response to health changes. 40m per day ▼ 10% State avg: 44m per day · National avg: 41m per day
LPN / LVN Info Licensed Practical Nurses (LPNs) or Licensed Vocational Nurses (LVNs) deliver routine hands-on care — medication administration, wound dressing, and monitoring vital signs. They work under RN supervision and make up a large share of daily bedside care. 44m per day ▲ 15% State avg: 38m per day · National avg: 52m per day
Nurse Aide Info Certified Nurse Aides (CNAs) provide the most direct day-to-day assistance: bathing, dressing, feeding, and mobility. Nurse aide hours are typically the largest staffing category and directly affect residents' quality of life. 1h 59m per day ▼ 7% State avg: 2h 8m per day · National avg: 2h 21m per day
Weekend Total Nursing Info Combined nursing hours (RN + LPN + Nurse Aide) per resident per day on weekends. Staffing often drops on weekends — this figure reveals whether the facility maintains adequate coverage outside of weekday hours. 2h 58m per day ▼ 4% State avg: 3h 5m per day · National avg: 3h 26m per day
Physical Therapist Info Hours per resident per day provided by licensed Physical Therapists (PTs) or PT Assistants. PT services help residents recover mobility after injury or illness and are especially important for post-acute (short-stay) rehabilitation. 7m per day ▲ 147% State avg: 3m per day · National avg: 4m per day
Weekend RN Info Registered nurse hours specifically on weekends. Facilities sometimes reduce RN presence on Saturdays and Sundays — a low weekend RN figure compared to weekday hours can indicate reduced clinical oversight when most administrative staff are absent. 28m per day ▼ 18% State avg: 34m per day · National avg: 29m per day

Capacity and availability

This home usually has limited availability

Higher occupancy than the Illinois average: 69.3%
Occupancy rate
87.5% Rank #42 / 204Occupancy rate — State benchmarkedThis home is ranked 42nd out of 204 homes in Illinois. Shows this facility's occupancy rate versus the Illinois average, with its Statewide rank out of 204. Higher occupancy signals strong local demand and financial stability.Rankings are based only on facilities in Illinois that report data for that category. Facilities without available data are excluded from the ranking.Click the rank badge to see the full State ranking.Click here to see the full State ranking.
Avg. Length of Stay
173 days
Bed community size
135-bed community Rank #64 / 426Bed count — State benchmarkedThis home is ranked 64th out of 426 homes in Illinois. Shows this facility's certified or reported bed count compared to other Illinois facilities. Larger communities may offer more amenities, programs, and on-site services for residents and families.Rankings are based only on facilities in Illinois that report data for that category. Facilities without available data are excluded from the ranking.Click the rank badge to see the full State ranking.Click here to see the full State ranking.
A larger shared setting that may offer more common spaces and organized community services.
Walk Score
Walk Score: 79 / 100 Rank #109 / 648Walk Score — State benchmarkedThis home is ranked 109th out of 648 homes in Illinois. Shows how walkable this facility's neighborhood is compared to the average Walk Score across Illinois facilities. Higher scores benefit residents, families, and staff.Rankings are based only on facilities in Illinois that report data for that category. Facilities without available data are excluded from the ranking.Click the rank badge to see the full State ranking.Click here to see the full State ranking.
Very walkable. Most errands can be accomplished on foot, and many essentials are within a short walk.

Therapy & Rehabilitation

3 services
Rehabilitation Services
Respite Care
Short-Term Rehab

Staffing & Medical

1 service
24-Hour Staffing

Additional Services

5 services
Therapy & Rehabilitation
Alzheimer's
Dementia & Memory Support
Palliative Care
Respite Stays

Amenities & Lifestyle

Private Suites For Rehabilitation
Private And Semi-Private Suites
Phones Provided For Each Guest
Lounges And Activity Areas
Full-Service Dining Options
Pet Therapy
Onsite Assessments
Gardens And Open-Air Courtyards
Housekeeping Services
Laundry And Linen Services
Specific Programs24-Hour Nursing Care, Medically Complex Care, CPAP BiPAP Oxygen, Stroke Rehabilitation, Cardiac Rehabilitation, Orthopedic Rehabilitation, Pulmonary Rehabilitation

Dining & Nutrition

Food DescriptionFull-Service Dining Options

Contact Citadel at Saint Benedict

Staffing Data

Reporting period: October 1 – December 31, 2025 (Q4 2025). Source: CMS Payroll-Based Journal report.

Total staff 161
Employees 116
Contractors 45
Staff to resident ratio 1.35 : 1
25% fewer staff per resident than Illinois average
Illinois average ratio: 1.80 : 1 Illinois average ratio: 1.80 : 1See full Illinois ranking
Avg staff/day 64
Average shift 7.6 hours
0% compared with Illinois average
Illinois average: 7.6 hours Illinois average shift: 7.6 hoursSee full Illinois ranking
Total staff hours (quarter) 44,461

Nursing staff breakdown

Q4 2025 · Oct 1 – Dec 31 More info This data comes from the CMS Payroll-Based Journal report covering October 1 – December 31, 2025.
Registered Nurse

Manages medical care and health needs.

RN Staff Info 28 total: 17 full-time employees and 11 contractors. 28
Average shift length Info Average shift length. Calculated as total hours divided by days worked and average staff per day. 8.1 hours
Licensed Practical Nurse

Assists with medical care and medications.

LPN Staff Info All 20 LPN Staff are full-time employees. No contractors work on this role. 20
Average shift length Info Average shift length. Calculated as total hours divided by days worked and average staff per day. 8 hours
Certified Nursing Assistant

Helps with daily care and mobility.

CNA Staff Info All 63 CNA Staff are full-time employees. No contractors work on this role. 63
Average shift length Info Average shift length. Calculated as total hours divided by days worked and average staff per day. 7.5 hours

Contractor staffing

Q4 2025 · Oct 1 – Dec 31 More info This data comes from the CMS Payroll-Based Journal report covering October 1 – December 31, 2025.

Total hours from contractors

11.2%

4,971 contractor hours this quarter

Registered Nurse: 11 Respiratory Therapy Technician: 8 Speech Language Pathologist: 7 Occupational Therapy Assistant: 5 Physical Therapy Assistant: 5 Qualified Social Worker: 4 Physical Therapy Aide: 3 Medical Director: 2

Staff by category

Q4 2025 · Oct 1 – Dec 31 More info This data comes from the CMS Payroll-Based Journal report covering October 1 – December 31, 2025.
Certified Nursing Assistant6306321,63192100%7.5
Licensed Practical Nurse200207,35292100%8
Registered Nurse1711286,19892100%8.1
Other Dietary Services Staff6061,87792100%7.5
Respiratory Therapy Technician0881,3438795%6.8
Administrator2029526470%8
Physical Therapy Aide0337569199%7.7
Speech Language Pathologist0777388795%6.6
RN Director of Nursing2025786470%7.7
Physical Therapy Assistant0555657480%5.8
Nurse Practitioner1015126470%8
Qualified Social Worker0444906571%7.5
Clinical Nurse Specialist3034866065%7.9
Dietitian1014325459%8
Dental Services Staff1014085155%8
Medical Director022751516%5
Occupational Therapy Assistant055694751%1.3
63 Certified Nursing Assistant
% of Days 100%
20 Licensed Practical Nurse
% of Days 100%
28 Registered Nurse
% of Days 100%
6 Other Dietary Services Staff
% of Days 100%
8 Respiratory Therapy Technician
% of Days 95%
2 Administrator
% of Days 70%
3 Physical Therapy Aide
% of Days 99%
7 Speech Language Pathologist
% of Days 95%
2 RN Director of Nursing
% of Days 70%
5 Physical Therapy Assistant
% of Days 80%
1 Nurse Practitioner
% of Days 70%
4 Qualified Social Worker
% of Days 71%
3 Clinical Nurse Specialist
% of Days 65%
1 Dietitian
% of Days 59%
1 Dental Services Staff
% of Days 55%
2 Medical Director
% of Days 16%
5 Occupational Therapy Assistant
% of Days 51%

Penalties and fines

Federal penalties imposed by CMS for regulatory violations, including civil money penalties (fines) and denials of payment for new Medicare/Medicaid admissions.

Source: CMS Penalties Database (Data as of Jan 2026)

Total fines amount $48K Rank #1 / 173Federal fines — State benchmarkedThis home is ranked 1st out of 173 homes in Illinois. Shows this facility's cumulative CMS federal fine dollars versus the Illinois average among facilities with fines, and where it ranks among 173 facilities in the pool. Lower total dollars mean a better rank.Rankings are based only on facilities in Illinois that report data for that category. Facilities without available data are excluded from the ranking.Click the rank badge to see the full State ranking.Click here to see the full State ranking.
66% lower than Illinois average

Illinois average: $143K

Number of fines 1
66% fewer fines than Illinois average

Illinois average: 3.0

Payment Denials Info Serious action where Medicare and/or Medicaid temporarily stops payments for new residents until issues are fixed. 0
100% fewer payment denials than Illinois average

Illinois average: 1.1

Fines amount comparison
This facility $48K
Illinois average $143K

No penalties in the past 3 years

No civil money penalties or payment denials were reported in the last 3 years.

Quality of care over time

These measures show how residents usually do over time at this home, based on health outcomes and preventive care.

High-risk clinical events score Info A composite score based on pressure ulcers, falls with injury, weight loss, walking ability decline, and activities of daily living decline. 7.3
25% better than Illinois average

Illinois average: 9.7

Functional decline score Info A composite score based on activities of daily living decline, walking ability decline, and incontinence. 11.7
37% better than Illinois average

Illinois average: 18.6

Long-stay resident measures
Above average Info CMS star rating based on long-stay quality measure performance. 5 stars = significantly above average, 1 star = significantly below average.
Need for Help with Daily Activities Increased Info Percent of long-stay residents whose need for help with daily activities has increased 8.1%
48% better than Illinois average

Illinois average: 15.5%

Walking Ability Worsened Info Percent of long-stay residents whose ability to move independently worsened 12.5%
32% better than Illinois average

Illinois average: 18.4%

Low Risk Residents with Bowel/Bladder Incontinence Info Percent of low risk long-stay residents who lose control of their bowels or bladder 14.5%
33% better than Illinois average

Illinois average: 21.6%

Falls with Major Injury Info Percent of long-stay residents experiencing one or more falls with major injury 6.5%
94% worse than Illinois average

Illinois average: 3.4%

High Risk Residents with Pressure Ulcers Info Percent of long-stay high risk residents with pressure ulcers 4.2%
21% better than Illinois average

Illinois average: 5.3%

Urinary Tract Infection Info Percent of long-stay residents with a urinary tract infection 0.2%
87% better than Illinois average

Illinois average: 1.8%

Lost Too Much Weight Info Percent of long-stay residents who lose too much weight 5.3%
18% better than Illinois average

Illinois average: 6.5%

Depressive Symptoms Info Percent of long-stay residents who have depressive symptoms 92.6%
92% worse than Illinois average

Illinois average: 48.1%

Antipsychotic Use Info Percent of long-stay residents who received an antipsychotic medication 28.3%
40% worse than Illinois average

Illinois average: 20.2%

Pneumococcal Vaccine Info Percent of long-stay residents assessed and appropriately given the pneumococcal vaccine 96.3%
8% better than Illinois average

Illinois average: 89.2%

Influenza Vaccine Info Percent of long-stay residents assessed and appropriately given the seasonal influenza vaccine 100.0%
9% better than Illinois average

Illinois average: 91.6%

Hospitalizations per 1,000 days Info Number of hospitalizations per 1,000 long-stay resident days. 3.15
54% worse than Illinois average

Illinois average: 2.05

ED visits per 1,000 days Info Number of outpatient emergency department visits per 1,000 long-stay resident days. 1.11
51% better than Illinois average

Illinois average: 2.25

Short-stay resident measures
Below average Info CMS star rating based on short-stay quality measure performance. 5 stars = much above average, 1 star = much below average.
Pneumococcal Vaccine Info Percent of short-stay residents assessed and appropriately given the pneumococcal vaccine 96.0%
41% better than Illinois average

Illinois average: 68.3%

Antipsychotic medication increase Info Percent of short-stay residents who newly received an antipsychotic medication 3.2%
39% worse than Illinois average

Illinois average: 2.3%

Influenza Vaccine Info Percent of short-stay residents assessed and appropriately given the seasonal influenza vaccine 100.0%
59% better than Illinois average

Illinois average: 63.0%

Re-hospitalized after SNF stay Info Percentage of short-stay residents who were re-hospitalized after their nursing home admission. 31.4%
20% worse than Illinois average

Illinois average: 26.2%

Emergency department visits Info Percentage of short-stay residents who had an outpatient emergency department visit. 10.1%
28% better than Illinois average

Illinois average: 14.0%

Falls with major injury Info Percentage of SNF residents who experience falls with major injury during their stay. 2.4%
213% worse than Illinois average

Illinois average: 0.8%

Ability to care for self at discharge Info Percentage of residents at or above expected ability to care for themselves at discharge. 50.0%
7% worse than Illinois average

Illinois average: 53.7%

Successful return to home or community Info Rate of successful return to home or community from a skilled nursing facility. 53.6%
6% better than Illinois average

Illinois average: 50.6%

Breakdown by payment type

Medicare

70% of new residents, usually for short-term rehab.

Typical stay 26 days

Private pay

23% of new residents, often for short stays.

Typical stay 1 years

Medicaid

7% of new residents, often for long-term daily care.

Typical stay 1 - 2 years

Facility Characteristics

Source: CMS Long-Term Care Facility Characteristics (Data as of Jan 2026)

Total residents 119
Medicare
20
16.8% of residents
Medicaid
80
67.2% of residents
Private pay or other
19
16% of residents
Programs & Services
Residents Group

Residents meet regularly to discuss policies, care quality, and activities

Active Resident Council

Organized group of residents that meets regularly to discuss facility policies, quality of life, and activities.

Finances and operations

Based on CMS SNF Cost Report for fiscal year ending in 12/2023.

Privately-owned community
Operated by a single business entity.
Net patient revenue Info Net patient revenue — what the home actually collects for resident care, after contractual allowances, bad debt and discounts are subtracted from its gross charges (CMS cost report, Worksheet G-3). It covers resident care only; money the home earns from other sources is shown separately as "Other income."
$14.5M
Net patient income Info Net patient income: net patient revenue minus the home's total operating expenses. A positive figure means it earns more from resident care than it spends to deliver it; a negative figure means the opposite. It excludes non-operating "other income."
$277.7K
Privately-owned community Operated by a single business entity.
Net patient revenue Info Net patient revenue — what the home actually collects for resident care, after contractual allowances, bad debt and discounts are subtracted from its gross charges (CMS cost report, Worksheet G-3). It covers resident care only; money the home earns from other sources is shown separately as "Other income."
$14.5M Rank #50 / 171Revenue — State benchmarkedThis home is ranked 50th out of 171 homes in Illinois. Shows this facility's annual revenue compared to the Illinois average. Higher revenue generally means more resources for staffing and capital — read alongside Payroll %.Rankings are based only on facilities in Illinois that report data for that category. Facilities without available data are excluded from the ranking.Click the rank badge to see the full State ranking.Click here to see the full State ranking.
Net patient income Info Net patient income: net patient revenue minus the home's total operating expenses. A positive figure means it earns more from resident care than it spends to deliver it; a negative figure means the opposite. It excludes non-operating "other income."
$277.7K
Other income Info Money the home earns outside of resident care — such as investments, grants, rentals and other non-operating sources (CMS cost report, Worksheet G-3). It is tracked separately from net patient revenue: it is not part of that figure, and it is not included in net patient income.
$434.3K
Payroll costs Info Staff salaries plus wage-related costs — benefits such as payroll taxes, health insurance and retirement — from the home's own accounting records (CMS cost report, Worksheet A). Contract or agency labor is counted separately, under other operating costs. Rank #68 / 171Payroll — State benchmarkedThis home is ranked 68th out of 171 homes in Illinois. Shows total annual staff payroll benchmarked to the Illinois average. Higher payroll investment relative to peers often signals better staffing and less reliance on cheaper contract labor.Rankings are based only on facilities in Illinois that report data for that category. Facilities without available data are excluded from the ranking.Click the rank badge to see the full State ranking.Click here to see the full State ranking.
$7.2M 49.8% of net patient revenue Info Payroll as a share of revenue: staff salaries and wage-related benefits divided by net patient revenue. A higher figure means more of each revenue dollar goes to staff pay. Rank #132 / 171Payroll % — State benchmarkedThis home is ranked 132nd out of 171 homes in Illinois. Shows payroll as a percentage of revenue versus the Illinois average. Well-run Illinois facilities typically land around 54–67% — the top third Statewide. Below 25% may signal understaffing or heavy agency use — read with Staffing ratings.Rankings are based only on facilities in Illinois that report data for that category. Facilities without available data are excluded from the ranking.Click the rank badge to see the full State ranking.Click here to see the full State ranking.
Other operating costs Info Everything it costs to run the home apart from payroll — food, utilities, supplies, maintenance, contract labor and administration. Calculated as total operating expense minus payroll (staff salaries and wage-related benefits).
$7.0M
Total costs Info The home's total operating expense for the year — all the costs of running it, salaries included (CMS cost report, Worksheet G-3).
$14.2M

What does this home offer?

Housing options icon

Housing Options: Private / Semi-Private Suites

Building type icon
Building type icon

Building Type: 2-story

Housekeeping icon
Housekeeping icon

Housekeeping Services

Recreational activities icon

Recreational Activities

Who this home usually serves

TYPE OF STAY

Mostly short-term rehab stays

Most residents typically stay for a few weeks or months before returning home or moving on.

Most new residents arrive under Medicare (70% of admissions), and a typical Medicare stay runs around 26 days.

Admissions
316 total

Coverage residents most often arrive under.

Medicare 70%
Private pay 23%
Medicaid 7%
Discharges
249 total

Coverage residents most often leave under.

Medicare 59%
Private pay 32%
Medicaid 9%

Places of interest near Citadel at Saint Benedict

Address 1.3 miles from city center Info Estimated distance in miles from Niles's city center to Citadel at Saint Benedict's address, calculated via Google Maps.

Calculate Travel Distance to Citadel at Saint Benedict

Add your location

Address

Compare Nursing Homes around Cook County

The information below is reported by the Illinois Department of Public Health, Office of Health Care Regulation.

2 facilities compared · CMS & IL Dept. of Health data

Celebrate Senior Living Niles
NH
AL
IL
MC
RC
Niles (North Newark Avenue)
59
Facility 59
IL AVG 86
Rank #268 / 426
89.7%
Facility 89.7%
IL AVG 69.3%
Rank #35 / 204
+29%
3.54
Facility 3.54
IL AVG 3.10
Rank #54 / 172
-1%+14%
$29.8k
Facility $29.8k
IL AVG $151.3k
Rank #99 / 173
9
Facility 9
IL AVG 36.8
Rank #11 / 172
1.8
Facility 1.8
IL AVG 3.7
Rank #6 / 172
249A+
60
Facility 60
IL AVG 51
Rank #233 / 648
Elevate Housing Foundation
$8.5M
Facility $8.5M
IL AVG $12.2M
Rank #122 / 171
$5.4M
Facility $5.4M
IL AVG $4.8M
Rank #126 / 171
63.3%
Facility 63.3%
IL AVG 44.3%
Rank #81 / 171
146176
Citadel at Saint Benedict
NH
NC
Niles (West Touhy Avenue)
135
Facility 135
IL AVG 86
Rank #64 / 426
87.5%
Facility 87.5%
IL AVG 69.3%
Rank #42 / 204
+26%
2.68
Facility 2.68
IL AVG 3.10
Rank #103 / 172
+23%-14%
$0
Facility $0
IL AVG $151.3k
Rank #1 / 173
27
Facility 27
IL AVG 36.8
Rank #65 / 172
4.5
Facility 4.5
IL AVG 3.7
Rank #138 / 172
2118-
79
Facility 79
IL AVG 51
Rank #109 / 648
-
$14.5M
Facility $14.5M
IL AVG $12.2M
Rank #50 / 171
$7.2M
Facility $7.2M
IL AVG $4.8M
Rank #68 / 171
49.8%
Facility 49.8%
IL AVG 44.3%
Rank #132 / 171
145741

Financial Assistance for
Nursing Home in Illinois

Citadel at Saint Benedict is located in Niles, Illinois.
Here are the financial assistance programs available to residents in Illinois.

Get Financial aid guidance

Community Care Program

Illinois CCP

Age 60+
General Illinois resident, at risk of nursing home placement.
Income Limits (2025) ~$1,215/month individual
Asset Limits $17,500 individual, excludes home, car
IL

High demand in urban areas; waitlists possible.

Benefits
In-home care (3-5 hours/day) Adult day services ($65/day) Emergency home response systems ($30/month)

Illinois Respite Program

IL Respite (via NFCSP)

Age Caregiver of someone 60+ (or with dementia)
General Illinois resident.
Income Limits No strict limit; prioritizes low-income.
Asset Limits Not applicable.
IL

Limited slots; urban/rural balance.

Benefits
In-home respite (4-6 hours/day) Adult day care (~$65/day) Short-term facility care (up to 5 days)

Supportive Living Program (SLP)

Illinois Medicaid Supportive Living Program

Age 65+ or 22-64 with disability
General Illinois resident, Medicaid-eligible, needs moderate assistance (not nursing home-level).
Income Limits (2025) ~$2,829/month (300% FBR, individual); QIT allowed.
Asset Limits $2,000 (individual), $3,000 (couple) (excludes home, car).
IL

~200 SLP sites statewide; room/board not covered.

Benefits
Personal care (5-7 hours/day, e.g., bathing, mobility) Meals Housekeeping Medication management Respite (~240 hours/year)

Persons Who Are Elderly Waiver

Illinois Medicaid Elderly Waiver

Age 65+
General Illinois resident, Medicaid-eligible, nursing home-level care need.
Income Limits (2025) ~$2,829/month 300% FBR, individual
Asset Limits $2,000 (individual), $3,000 (couple).
IL

Part of HealthChoice Illinois; consumer-directed options available.

Benefits
Personal care (5-7 hours/day, e.g., dressing, eating) Homemaker Adult day care (~$60/day) Respite (240 hours/year) Home mods ($1,000 avg.)

Medicare Savings Program (MSP)

Illinois Medicare Savings Program

Age 65+ or disabled
General Illinois resident, Medicare Part A/B.
Income Limits (2025) ~$2,510/month (QMB), ~$3,380/month (SLMB), ~$3,598/month (QI)—individual.
Asset Limits $9,430 (individual), $14,130 (couple).
IL

Three tiers; no waitlist.

Benefits
Covers Part B premiums ($174.70/month) Deductibles ($240/year) Copays (~20%)

Optional State Supplementation (OSS)

Illinois Optional State Supplementation

Age 65+ or disabled
General Illinois resident, in approved facility, SSI recipient or low-income.
Income Limits (2025) ~$1,004/month including SSI
Asset Limits $2,000 (individual), $3,000 (couple).
IL

~$50-$500/month based on facility type.

Benefits
Cash (~$50-$500/month) for room/board in personal care homes or SLFs

VA Aid and Attendance (A&A) and Housebound Benefits

Illinois VA Aid and Attendance/Housebound

Age 65+ or disabled veteran/spouse
General Illinois resident, wartime service, need for ADL help (A&A) or homebound.
Income Limits (2025) Net income < ~$1,984/month (veteran with dependent, A&A); pension offsets income.
Asset Limits ~$155,356 net worth limit
IL

High veteran demand in urban/rural areas.

Benefits
Cash (~$1,433-$2,642/month veteran, ~$951-$1,318 spouse) for care costs (e.g., in-home, assisted living)

Frequently Asked Questions about Citadel at Saint Benedict

What neighborhood is Citadel at Saint Benedict in?

Citadel at Saint Benedict is in the West Touhy Avenue neighborhood.

Is Citadel at Saint Benedict in a walkable area?

Citadel at Saint Benedict has a walk score of 79. Very walkable. Most errands can be accomplished on foot, and many essentials are within a short walk.

What is the occupancy rate at Citadel at Saint Benedict?

Citadel at Saint Benedict's occupancy is 87.5%.

Are there photos of Citadel at Saint Benedict?

Yes — there are 15 photos of Citadel at Saint Benedict in the photo gallery on this page.

What is the address of Citadel at Saint Benedict?

Citadel at Saint Benedict is located at 6930 W Touhy Ave, Niles, IL 60714.

What is the phone number of Citadel at Saint Benedict?

(847) 647-0003 will put you in contact with the team at Citadel at Saint Benedict.

Is Citadel at Saint Benedict Medicare or Medicaid certified?

Yes — Citadel at Saint Benedict is a CMS-certified provider of Medicare and Medicaid.

Guides for Better Senior Living

Care Cost Calculator: See Prices in Your Area

Nursing Home Data Explorer

Don’t Wait Too Long: 7 Red Flag Signs Your Parent Needs Assisted Living Now

The True Cost of Assisted Living in 2025 – And How Families Are Paying For It

Understanding Senior Living Costs: Pricing Models, Discounts & Financial Assistance