Elevate Care Windsor Park
Nursing Home & Memory Care · Chicago, IL
CMS overall rating Info CMS (the Centers for Medicare & Medicaid Services) is the federal agency that rates nursing home quality. Its Overall Rating runs from 1 to 5 stars, combining health inspections, staffing, and quality measures, with inspections weighted most heavily.

Elevate Care Windsor Park

Nursing Home & Memory Care · Chicago, IL
CMS overall rating Info CMS (the Centers for Medicare & Medicaid Services) is the federal agency that rates nursing home quality. Its Overall Rating runs from 1 to 5 stars, combining health inspections, staffing, and quality measures, with inspections weighted most heavily.
Calculator: See prices in your area
Elevate Care Windsor Park accepts Medicare, Medicaid, and private pay.

Overview of Elevate Care Windsor Park

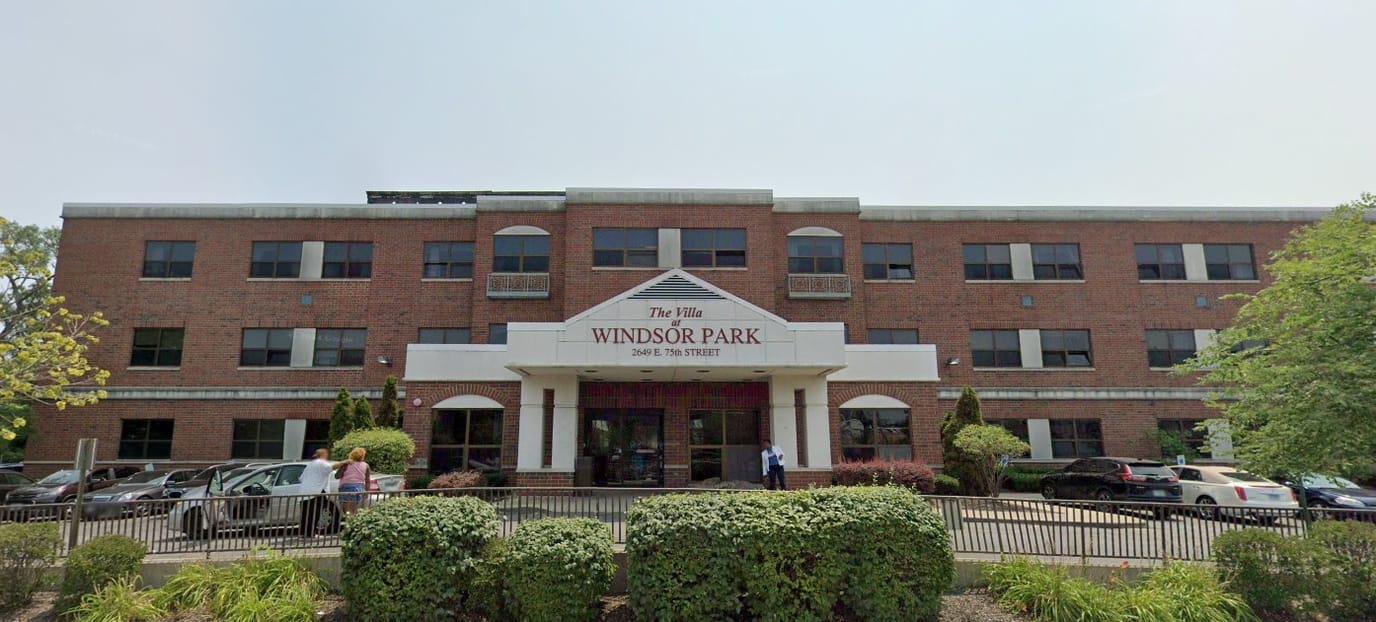
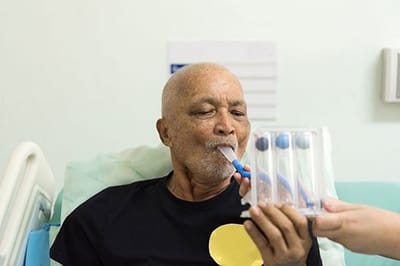
Conveniently nestled in Chicago, IL, Elevate Care Windsor Park offers a safe and convenient setting for those needing short-term rehabilitation and skilled nursing care. Residents here recover from their hospitalization, injury, or illness in spacious and welcoming accommodations tailored to their needs. An excellent care team is always available to assist residents and oversee their individualized care plans to guarantee the proper delivery of care.

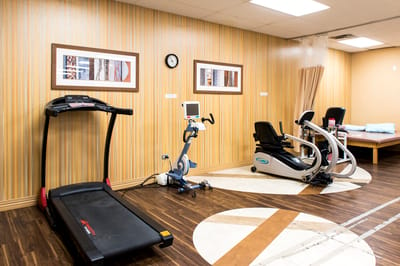
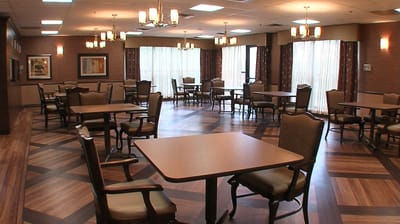
The community is fully equipped to provide the services, therapies, and support residents need to successfully recover or maintain their functionality. With an all-around team of care professionals, residents here typically don’t have to move into another community for their needs. Here, everyone is met with genuine care that allows them to recover with ease.

Quality ratings

Measured by Centers for Medicare & Medicaid Services (CMS)

Overall rating Info The Overall CMS Rating combines results from health inspections, staffing levels and quality measures. Health inspections carry the most weight. Staffing and quality scores can increase or decrease the final rating based on performance compared to state and national standards.
▼ 60.3% Below IL avg. ▼ 60.3% Below IL avg.IL average: 2.5Click the badge to see the full State ranking.Click here to see the full State ranking.
Health Inspection Info Based on the results of the facility's three most recent standard inspections and any complaint investigations. CMS reviews the number, scope, and severity of deficiencies, with more recent findings weighted more heavily.
▼ 64.0% Below IL avg. ▼ 64.0% Below IL avg.IL average: 2.8Click the badge to see the full State ranking.Click here to see the full State ranking.
Staffing Info Measures average nursing staff hours per resident per day, including Registered Nurses (RNs) and total nursing staff. Ratings are adjusted based on the level of care residents require and are compared to state and national benchmarks.
▼ 53.2% Below IL avg. ▼ 53.2% Below IL avg.IL average: 2.1Click the badge to see the full State ranking.Click here to see the full State ranking.
Quality Measures Info Based on clinical and physical health indicators reported to CMS, such as hospital readmissions, falls, pressure ulcers, and improvements in mobility. These measures reflect how well residents' health needs are being managed.
▲ 6.6% Above IL avg. ▲ 6.6% Above IL avg.IL average: 2.8Click the badge to see the full State ranking.Click here to see the full State ranking.

Staffing hours breakdown

Info Daily nursing hours per resident by staff type, reported to CMS. Higher is generally better — compare this facility to state and national averages to see where staffing stands.

Hours per resident per day — compared to Illinois state averages

Total nursing care / resident Info This home is ranked 146th out of 172 homes in Illinois for nurse hours. Total adjusted nursing hours per resident per day, combining RN, LPN, and aide time. CMS adjusts this for case-mix so facilities can be fairly compared.
2h 21m per day
Rank #146 / 172Nurse hours — State benchmarkedThis home is ranked 146th out of 172 homes in Illinois. Shows adjusted nurse hours per resident per day benchmarked to the Illinois average, with a ranking across 172 Illinois facilities. More hours mean more direct care. The national average is about 3.5 hrs; below 3.0 is a red flag.Rankings are based only on facilities in Illinois that report data for that category. Facilities without available data are excluded from the ranking.Click the rank badge to see the full State ranking.Click here to see the full State ranking.
This facility Illinois avg (3h 6m per day)
vs Illinois avg
-24%

5 of 6 metrics below state avg

Standout metric LPN / LVN is +41% above state avg
Staff typeHours / Day / Residentvs state avg
Registered Nurse (RN) Info RNs hold the highest nursing license and can assess residents, interpret test results, and direct care plans. More RN hours per day often signals stronger clinical oversight and faster response to health changes. 20m per day ▼ 55% State avg: 44m per day · National avg: 41m per day
LPN / LVN Info Licensed Practical Nurses (LPNs) or Licensed Vocational Nurses (LVNs) deliver routine hands-on care — medication administration, wound dressing, and monitoring vital signs. They work under RN supervision and make up a large share of daily bedside care. 54m per day ▲ 41% State avg: 38m per day · National avg: 52m per day
Nurse Aide Info Certified Nurse Aides (CNAs) provide the most direct day-to-day assistance: bathing, dressing, feeding, and mobility. Nurse aide hours are typically the largest staffing category and directly affect residents' quality of life. 1h 42m per day ▼ 20% State avg: 2h 8m per day · National avg: 2h 21m per day
Weekend Total Nursing Info Combined nursing hours (RN + LPN + Nurse Aide) per resident per day on weekends. Staffing often drops on weekends — this figure reveals whether the facility maintains adequate coverage outside of weekday hours. 2h 30m per day ▼ 19% State avg: 3h 5m per day · National avg: 3h 26m per day
Physical Therapist Info Hours per resident per day provided by licensed Physical Therapists (PTs) or PT Assistants. PT services help residents recover mobility after injury or illness and are especially important for post-acute (short-stay) rehabilitation. 2m per day ▼ 48% State avg: 3m per day · National avg: 4m per day
Weekend RN Info Registered nurse hours specifically on weekends. Facilities sometimes reduce RN presence on Saturdays and Sundays — a low weekend RN figure compared to weekday hours can indicate reduced clinical oversight when most administrative staff are absent. 12m per day ▼ 65% State avg: 34m per day · National avg: 29m per day

Capacity and availability

Avg. Length of Stay
236 days
Bed community size
240-bed community Rank #14 / 426Bed count — State benchmarkedThis home is ranked 14th out of 426 homes in Illinois. Shows this facility's certified or reported bed count compared to other Illinois facilities. Larger communities may offer more amenities, programs, and on-site services for residents and families.Rankings are based only on facilities in Illinois that report data for that category. Facilities without available data are excluded from the ranking.Click the rank badge to see the full State ranking.Click here to see the full State ranking.
A large-scale community that may provide a wide range of amenities, services, and structured programs.
Walk Score
Walk Score: 77 / 100 Rank #121 / 648Walk Score — State benchmarkedThis home is ranked 121st out of 648 homes in Illinois. Shows how walkable this facility's neighborhood is compared to the average Walk Score across Illinois facilities. Higher scores benefit residents, families, and staff.Rankings are based only on facilities in Illinois that report data for that category. Facilities without available data are excluded from the ranking.Click the rank badge to see the full State ranking.Click here to see the full State ranking.
Very walkable. Most errands can be accomplished on foot, and many essentials are within a short walk.
BBB Rating
BBB Rating: A- (Not Accredited)
An independent rating from the Better Business Bureau based on factors such as complaint history, transparency, and business practices.
How BBB ratings work

Therapy & Rehabilitation

1 service
Rehabilitation Services

Staffing & Medical

1 service
24-Hour Staffing

Amenities & Lifestyle

Specific Programs24-hour skilled nursing, post-operative recovery, chronic disease management, pain management, IV therapy, respiratory care, and ventilator care.

Contact Elevate Care Windsor Park

Inspection History

In Illinois, the Department of Public Health, Office of Health Care Regulation conducts annual unannounced surveys to assess compliance with state and federal healthcare facility standards.

Since 2023 · 3 years of data 84 deficiencies

Inspection Scorecard Info This scorecard compares key inspection, citation, and complaint metrics at this facility against the Illinois state average. Metrics rated ≥15% worse than average are highlighted in red; those ≥15% better are highlighted in green.

Since 2023 vs. Illinois state average
Overall vs. IL average 2 Worse Metrics worse than Illinois average:
• Total deficiencies (1100% above)
• Deficiencies per year (1117% above)
0 Better No metrics in this bucket.
Latest Inspection July 25, 2025 Annual Inspection

Deficiencies Info Deficiencies are formal regulatory issues recorded during state inspections.

This FacilityIL Averagevs. IL Avg
Total deficiencies Info Formal regulatory issues recorded by inspectors across all inspection types. 847 This facility has 1100% more total deficiencies than a typical Illinois nursing home (84 vs. IL avg 7).↑ 1100% worse
Deficiencies per year Info Average deficiencies per year since 2023. 282.3 This facility has 1117% more deficiencies per year than a typical Illinois nursing home (28 vs. IL avg 2.3).↑ 1117% worse

Inspection Reports Summary Info An editor-reviewed summary of the themes and findings across this facility's recent inspection reports.

  • The most recent inspection on July 25, 2025, found 4 deficiencies related to care plan updates and fall investigations, with no harm-level citations or complaints.
  • A May 9, 2025 routine inspection identified 13 deficiencies including medication errors causing seizures, inadequate restorative services, and multiple infection control and safety failures.
  • A substantiated complaint investigation on May 9, 2025 found failure to protect residents from abuse during a physical altercation, with one resident hospitalized.

Health Inspection History

Inspections since 2023
Total health inspections 18

Illinois average 10.4


Last Health inspection on Jul 2025

Total health citations
83 Rank #165 / 172Health citations — State benchmarkedThis home is ranked 165th out of 172 homes in Illinois. Shows this facility's total health deficiency citations benchmarked to the Illinois State average, with a ranking across all 172 IL facilities. Lower citation counts earn a better rank.Rankings are based only on facilities in Illinois that report data for that category. Facilities without available data are excluded from the ranking.Click the rank badge to see the full State ranking.Click here to see the full State ranking.

Illinois average 36.8

Citations per inspection
4.61 Rank #140 / 172Citations per inspection — State benchmarkedThis home is ranked 140th out of 172 homes in Illinois. Shows average deficiency citations per CMS inspection for this facility versus the Illinois mean across 172 facilities with citation data. Lower is better.Rankings are based only on facilities in Illinois that report data for that category. Facilities without available data are excluded from the ranking.Click the rank badge to see the full State ranking.Click here to see the full State ranking.

Illinois average 3.68


Health citations are formal notices following inspections when they fail to comply with safety and care standards.

53 of 83 citations resulted from standard inspections; 29 of 83 resulted from complaint investigations; and 1 of 83 came from combined inspections (standard and complaint).

Breakdown of citation severity (last 3 years)
Critical health citations
0
100% better than Illinois average

Illinois average: 0.7


Serious health citations
10
178% worse than Illinois average

Illinois average: 3.6

0 critical citations Illinois average: 0.7

10 serious citations Illinois average: 3.6

73 moderate citations Illinois average: 32

0 minor citations Illinois average: 0.5
Citations history (last 3 years)
Quality of Care moderate citation Jul 25, 2025
Corrected

Care Planning moderate citation Jul 25, 2025
Corrected

Infection Control moderate citation Jun 23, 2025
Corrected

Quality of Care serious citation Jun 23, 2025
Corrected

Staffing Data

Reporting period: October 1 – December 31, 2025 (Q4 2025). Source: CMS Payroll-Based Journal report.

Total staff 213
Employees 177
Contractors 36
Staff to resident ratio 1.00 : 1
44% fewer staff per resident than Illinois average
Illinois average ratio: 1.80 : 1 Illinois average ratio: 1.80 : 1See full Illinois ranking
Avg staff/day 86
Average shift 7.5 hours
0% compared with Illinois average
Illinois average: 7.6 hours Illinois average shift: 7.6 hoursSee full Illinois ranking
Total staff hours (quarter) 59,253

Nursing staff breakdown

Q4 2025 · Oct 1 – Dec 31 More info This data comes from the CMS Payroll-Based Journal report covering October 1 – December 31, 2025.
Registered Nurse

Manages medical care and health needs.

RN Staff Info 37 total: 20 full-time employees and 17 contractors. 37
Average shift length Info Average shift length. Calculated as total hours divided by days worked and average staff per day. 7.7 hours
Licensed Practical Nurse

Assists with medical care and medications.

LPN Staff Info 51 total: 48 full-time employees and 3 contractors. 51
Average shift length Info Average shift length. Calculated as total hours divided by days worked and average staff per day. 8.2 hours
Certified Nursing Assistant

Helps with daily care and mobility.

CNA Staff Info 96 total: 90 full-time employees and 6 contractors. 96
Average shift length Info Average shift length. Calculated as total hours divided by days worked and average staff per day. 7.2 hours

Contractor staffing

Q4 2025 · Oct 1 – Dec 31 More info This data comes from the CMS Payroll-Based Journal report covering October 1 – December 31, 2025.

Total hours from contractors

4.9%

2,919 contractor hours this quarter

Registered Nurse: 17 Certified Nursing Assistant: 6 Licensed Practical Nurse: 3 Qualified Social Worker: 3 Physical Therapy Assistant: 2 Speech Language Pathologist: 2 Physical Therapy Aide: 1 Respiratory Therapy Technician: 1 Occupational Therapy Aide: 1

Staff by category

Q4 2025 · Oct 1 – Dec 31 More info This data comes from the CMS Payroll-Based Journal report covering October 1 – December 31, 2025.
Certified Nursing Assistant9069630,88192100%7.2
Licensed Practical Nurse4835115,09792100%8.2
Registered Nurse2017375,54592100%7.7
Other Dietary Services Staff6062,03392100%7.4
RN Director of Nursing4041,1188087%7.3
Dental Services Staff2027087076%7.8
Administrator1015286672%8
Nurse Practitioner2024795863%8.3
Dietitian1014725964%8
Mental Health Service Worker1014725964%8
Respiratory Therapy Technician0114715964%8
Physical Therapy Assistant0224656166%7.5
Speech Language Pathologist0224506368%7
Physical Therapy Aide0113996368%6.3
Occupational Therapy Aide011741415%5.3
Qualified Social Worker033411516%2.7
Nurse Aide in Training2022133%6.9
96 Certified Nursing Assistant
% of Days 100%
51 Licensed Practical Nurse
% of Days 100%
37 Registered Nurse
% of Days 100%
6 Other Dietary Services Staff
% of Days 100%
4 RN Director of Nursing
% of Days 87%
2 Dental Services Staff
% of Days 76%
1 Administrator
% of Days 72%
2 Nurse Practitioner
% of Days 63%
1 Dietitian
% of Days 64%
1 Mental Health Service Worker
% of Days 64%
1 Respiratory Therapy Technician
% of Days 64%
2 Physical Therapy Assistant
% of Days 66%
2 Speech Language Pathologist
% of Days 68%
1 Physical Therapy Aide
% of Days 68%
1 Occupational Therapy Aide
% of Days 15%
3 Qualified Social Worker
% of Days 16%
2 Nurse Aide in Training
% of Days 3%

Penalties and fines

Includes penalties issued in 2023-2025

Federal penalties imposed by CMS for regulatory violations, including civil money penalties (fines) and denials of payment for new Medicare/Medicaid admissions.

Source: CMS Penalties Database (Data as of Jan 2026)

Total fines amount $70K Rank #118 / 173Federal fines — State benchmarkedThis home is ranked 118th out of 173 homes in Illinois. Shows this facility's cumulative CMS federal fine dollars versus the Illinois average among facilities with fines, and where it ranks among 173 facilities in the pool. Lower total dollars mean a better rank.Rankings are based only on facilities in Illinois that report data for that category. Facilities without available data are excluded from the ranking.Click the rank badge to see the full State ranking.Click here to see the full State ranking.
51% lower than Illinois average

Illinois average: $143K

Number of fines 2
33% fewer fines than Illinois average

Illinois average: 3.0

Payment Denials Info Serious action where Medicare and/or Medicaid temporarily stops payments for new residents until issues are fixed. 0
100% fewer payment denials than Illinois average

Illinois average: 1.1

Fines amount comparison
This facility $70K
Illinois average $143K
Penalty History

Penalties are imposed by CMS for violations of federal nursing home regulations.

2 penalties in the past 3 years

Multiple penalties were reported in the last 3 years.

Civil Money Penalty Info Fines imposed for noncompliance, which can be assessed per day or per instance of violation. Mar 6, 2025
$59K
Civil Money Penalty Info Fines imposed for noncompliance, which can be assessed per day or per instance of violation. Oct 6, 2023
$11K

Last updated: Jan 2026

Quality of care over time

These measures show how residents usually do over time at this home, based on health outcomes and preventive care.

High-risk clinical events score Info A composite score based on pressure ulcers, falls with injury, weight loss, walking ability decline, and activities of daily living decline. 6.5
33% better than Illinois average

Illinois average: 9.7

Functional decline score Info A composite score based on activities of daily living decline, walking ability decline, and incontinence. 9.4
50% better than Illinois average

Illinois average: 18.6

Long-stay resident measures
Above average Illinois avg: 3.6 Info CMS star rating based on long-stay quality measure performance. 5 stars = significantly above average, 1 star = significantly below average.
Need for Help with Daily Activities Increased Info Percent of long-stay residents whose need for help with daily activities has increased 7.2%
54% better than Illinois average

Illinois average: 15.5%

Walking Ability Worsened Info Percent of long-stay residents whose ability to move independently worsened 7.9%
57% better than Illinois average

Illinois average: 18.4%

Low Risk Residents with Bowel/Bladder Incontinence Info Percent of low risk long-stay residents who lose control of their bowels or bladder 12.9%
40% better than Illinois average

Illinois average: 21.6%

Falls with Major Injury Info Percent of long-stay residents experiencing one or more falls with major injury 1.7%
48% better than Illinois average

Illinois average: 3.4%

High Risk Residents with Pressure Ulcers Info Percent of long-stay high risk residents with pressure ulcers 7.8%
48% worse than Illinois average

Illinois average: 5.3%

Urinary Tract Infection Info Percent of long-stay residents with a urinary tract infection 2.2%
20% worse than Illinois average

Illinois average: 1.8%

Lost Too Much Weight Info Percent of long-stay residents who lose too much weight 7.9%
21% worse than Illinois average

Illinois average: 6.5%

Depressive Symptoms Info Percent of long-stay residents who have depressive symptoms 99.1%
106% worse than Illinois average

Illinois average: 48.1%

Antipsychotic Use Info Percent of long-stay residents who received an antipsychotic medication 24.0%
19% worse than Illinois average

Illinois average: 20.2%

Pneumococcal Vaccine Info Percent of long-stay residents assessed and appropriately given the pneumococcal vaccine 74.0%
17% worse than Illinois average

Illinois average: 89.2%

Influenza Vaccine Info Percent of long-stay residents assessed and appropriately given the seasonal influenza vaccine 82.3%
10% worse than Illinois average

Illinois average: 91.6%

Short-stay resident measures
Significantly below average Illinois avg: 2.3 Info CMS star rating based on short-stay quality measure performance. 5 stars = much above average, 1 star = much below average.
Pneumococcal Vaccine Info Percent of short-stay residents assessed and appropriately given the pneumococcal vaccine 13.6%
80% worse than Illinois average

Illinois average: 68.3%

Antipsychotic medication increase Info Percent of short-stay residents who newly received an antipsychotic medication 3.8%
64% worse than Illinois average

Illinois average: 2.3%

Influenza Vaccine Info Percent of short-stay residents assessed and appropriately given the seasonal influenza vaccine 25.3%
60% worse than Illinois average

Illinois average: 63.0%

Re-hospitalized after SNF stay Info Percentage of short-stay residents who were re-hospitalized after their nursing home admission. 27.0%
In line with Illinois average

Illinois average: 26.2%

Emergency department visits Info Percentage of short-stay residents who had an outpatient emergency department visit. 15.7%
12% worse than Illinois average

Illinois average: 14.0%

Falls with major injury Info Percentage of SNF residents who experience falls with major injury during their stay. 1.8%
132% worse than Illinois average

Illinois average: 0.8%

Ability to care for self at discharge Info Percentage of residents at or above expected ability to care for themselves at discharge. 17.9%
67% worse than Illinois average

Illinois average: 53.7%

Successful return to home or community Info Rate of successful return to home or community from a skilled nursing facility. 40.0%
21% worse than Illinois average

Illinois average: 50.6%

Breakdown by payment type

Medicare

31% of new residents, usually for short-term rehab.

Typical stay 1 months

Private pay

55% of new residents, often for short stays.

Typical stay 11 - 12 months

Medicaid

13% of new residents, often for long-term daily care.

Typical stay 12 months

Facility Characteristics

Source: CMS Long-Term Care Facility Characteristics (Data as of Jan 2026)

Total residents 213
Medicare
8
3.8% of residents
Medicaid
191
89.7% of residents
Private pay or other
14
6.6% of residents
Programs & Services
Residents Group

Residents meet regularly to discuss policies, care quality, and activities

Active Resident Council

Organized group of residents that meets regularly to discuss facility policies, quality of life, and activities.

Finances and operations

Based on CMS SNF Cost Report for fiscal year ending in 12/2023.

Privately-owned community
Operated by a single business entity.
Net patient revenue Info Net patient revenue — what the home actually collects for resident care, after contractual allowances, bad debt and discounts are subtracted from its gross charges (CMS cost report, Worksheet G-3). It covers resident care only; money the home earns from other sources is shown separately as "Other income."
$18.5M
Net patient income Info Net patient income: net patient revenue minus the home's total operating expenses. A positive figure means it earns more from resident care than it spends to deliver it; a negative figure means the opposite. It excludes non-operating "other income."
-$3.1M
Privately-owned community Operated by a single business entity.
Net patient revenue Info Net patient revenue — what the home actually collects for resident care, after contractual allowances, bad debt and discounts are subtracted from its gross charges (CMS cost report, Worksheet G-3). It covers resident care only; money the home earns from other sources is shown separately as "Other income."
$18.5M Rank #40 / 171Revenue — State benchmarkedThis home is ranked 40th out of 171 homes in Illinois. Shows this facility's annual revenue compared to the Illinois average. Higher revenue generally means more resources for staffing and capital — read alongside Payroll %.Rankings are based only on facilities in Illinois that report data for that category. Facilities without available data are excluded from the ranking.Click the rank badge to see the full State ranking.Click here to see the full State ranking.
Net patient income Info Net patient income: net patient revenue minus the home's total operating expenses. A positive figure means it earns more from resident care than it spends to deliver it; a negative figure means the opposite. It excludes non-operating "other income."
-$3.1M
Other income Info Money the home earns outside of resident care — such as investments, grants, rentals and other non-operating sources (CMS cost report, Worksheet G-3). It is tracked separately from net patient revenue: it is not part of that figure, and it is not included in net patient income.
$1.4M
Payroll costs Info Staff salaries plus wage-related costs — benefits such as payroll taxes, health insurance and retirement — from the home's own accounting records (CMS cost report, Worksheet A). Contract or agency labor is counted separately, under other operating costs. Rank #31 / 171Payroll — State benchmarkedThis home is ranked 31st out of 171 homes in Illinois. Shows total annual staff payroll benchmarked to the Illinois average. Higher payroll investment relative to peers often signals better staffing and less reliance on cheaper contract labor.Rankings are based only on facilities in Illinois that report data for that category. Facilities without available data are excluded from the ranking.Click the rank badge to see the full State ranking.Click here to see the full State ranking.
$8.7M 47.2% of net patient revenue Info Payroll as a share of revenue: staff salaries and wage-related benefits divided by net patient revenue. A higher figure means more of each revenue dollar goes to staff pay. Rank #103 / 171Payroll % — State benchmarkedThis home is ranked 103rd out of 171 homes in Illinois. Shows payroll as a percentage of revenue versus the Illinois average. Well-run Illinois facilities typically land around 54–67% — the top third Statewide. Below 25% may signal understaffing or heavy agency use — read with Staffing ratings.Rankings are based only on facilities in Illinois that report data for that category. Facilities without available data are excluded from the ranking.Click the rank badge to see the full State ranking.Click here to see the full State ranking.
Other operating costs Info Everything it costs to run the home apart from payroll — food, utilities, supplies, maintenance, contract labor and administration. Calculated as total operating expense minus payroll (staff salaries and wage-related benefits).
$12.9M
Total costs Info The home's total operating expense for the year — all the costs of running it, salaries included (CMS cost report, Worksheet G-3).
$21.7M

What does this home offer?

Housing options icon

Housing Options: Private / Shared Rooms

Building type icon
Building type icon

Building Type: 3-story

Housekeeping icon
Housekeeping icon

Housekeeping Services

Beauty services icon

Beauty Services

Exercise program icon

Exercise Programs

Recreational activities icon

Recreational Activities

Who this home usually serves

TYPE OF STAY

Mix of rehab and long-term care

This home supports both short-term rehab and long-term care, with residents staying for a wide range of durations.

Most new residents arrive under private pay (55% of admissions), and a typical private pay stay runs around 11 - 12 months.

Admissions
283 total

Coverage residents most often arrive under.

Medicare 31%
Private pay 55%
Medicaid 13%
Discharges
297 total

Coverage residents most often leave under.

Medicare 31%
Private pay 56%
Medicaid 14%

Places of interest near Elevate Care Windsor Park

Address 10.1 miles from city center Info Estimated distance in miles from Chicago's city center to Elevate Care Windsor Park's address, calculated via Google Maps.

Calculate Travel Distance to Elevate Care Windsor Park

Add your location

Address

Compare Nursing Homes around Chicago

The information below is reported by the Illinois Department of Public Health, Office of Health Care Regulation.

5 facilities compared · CMS & IL Dept. of Health data

The Selfhelp Home Senior Living Community
NH
AL
IL
RC
Chicago (Uptown)
72
Facility 72
IL AVG 86
Rank #209 / 426
81.9%
Facility 81.9%
IL AVG 69.3%
Rank #74 / 204
+18%
5.56
Facility 5.56
IL AVG 3.10
Rank #8 / 172
+44%+79%
$0
Facility $0
IL AVG $151.3k
Rank #1 / 173
21
Facility 21
IL AVG 36.8
Rank #45 / 172
5.3
Facility 5.3
IL AVG 3.7
Rank #154 / 172
155A+
92
Facility 92
IL AVG 51
Rank #28 / 648
Marvin Rubin
$9.3M
Facility $9.3M
IL AVG $12.2M
Rank #78 / 171
$7.0M
Facility $7.0M
IL AVG $4.8M
Rank #73 / 171
75.3%
Facility 75.3%
IL AVG 44.3%
Rank #70 / 171
146009
Encore Village of Schaumburg
NH
AL
IL
MC
Schaumburg
109
Facility 109
IL AVG 86
Rank #108 / 426
55.4%
Facility 55.4%
IL AVG 69.3%
Rank #169 / 204
-20%
3.46
Facility 3.46
IL AVG 3.10
Rank #54 / 172
+8%+12%
$25.5k
Facility $25.5k
IL AVG $151.3k
Rank #94 / 173
28
Facility 28
IL AVG 36.8
Rank #69 / 172
2.6
Facility 2.6
IL AVG 3.7
Rank #28 / 172
2105A+
58
Facility 58
IL AVG 51
Rank #253 / 648
Il Ccrc, LLC
$16.2M
Facility $16.2M
IL AVG $12.2M
Rank #1 / 171
$15.9M
Facility $15.9M
IL AVG $4.8M
Rank #4 / 171
98.3%
Facility 98.3%
IL AVG 44.3%
Rank #171 / 171
145341
Smith Village
NH
AL
IL
MC
Chicago (South Side)
82
Facility 82
IL AVG 86
Rank #171 / 426
85.4%
Facility 85.4%
IL AVG 69.3%
Rank #57 / 204
+23%
5.28
Facility 5.28
IL AVG 3.10
Rank #10 / 172
+4%+70%
$0
Facility $0
IL AVG $151.3k
Rank #1 / 173
20
Facility 20
IL AVG 36.8
Rank #42 / 172
3.3
Facility 3.3
IL AVG 3.7
Rank #69 / 172
466A+
71
Facility 71
IL AVG 51
Rank #147 / 648
The Washington And Jane Smith Home
$11.0M
Facility $11.0M
IL AVG $12.2M
Rank #31 / 171
$8.0M
Facility $8.0M
IL AVG $4.8M
Rank #24 / 171
72.5%
Facility 72.5%
IL AVG 44.3%
Rank #108 / 171
145904
Montgomery Place
NH
AL
IL
MC
Chicago (East Hyde Park)
40
Facility 40
IL AVG 86
Rank #350 / 426
35.0%
Facility 35.0%
IL AVG 69.3%
Rank #189 / 204
-49%
4.00
Facility 4.00
IL AVG 3.10
Rank #42 / 172
+31%+29%
$51.6k
Facility $51.6k
IL AVG $151.3k
Rank #107 / 173
30
Facility 30
IL AVG 36.8
Rank #79 / 172
4.3
Facility 4.3
IL AVG 3.7
Rank #132 / 172
114A+
82
Facility 82
IL AVG 51
Rank #98 / 648
Margo Brooks Pugh
$13.8M
Facility $13.8M
IL AVG $12.2M
Rank #70 / 171
$6.9M
Facility $6.9M
IL AVG $4.8M
Rank #69 / 171
49.7%
Facility 49.7%
IL AVG 44.3%
Rank #86 / 171
145748
Elevate Care Windsor Park
NH
MC
Chicago (South Shore)
240
Facility 240
IL AVG 86
Rank #14 / 426
--
2.34
Facility 2.34
IL AVG 3.10
Rank #146 / 172
+23%-24%
$69.4k
Facility $69.4k
IL AVG $151.3k
Rank #118 / 173
83
Facility 83
IL AVG 36.8
Rank #165 / 172
4.6
Facility 4.6
IL AVG 3.7
Rank #140 / 172
1015A-
77
Facility 77
IL AVG 51
Rank #121 / 648
75Th And Exchange LLC
$18.5M
Facility $18.5M
IL AVG $12.2M
Rank #40 / 171
$8.7M
Facility $8.7M
IL AVG $4.8M
Rank #31 / 171
47.2%
Facility 47.2%
IL AVG 44.3%
Rank #103 / 171
145970

Financial Assistance for
Nursing Home in Illinois

Elevate Care Windsor Park is located in Chicago, Illinois.
Here are the financial assistance programs available to residents in Illinois.

Get Financial aid guidance

Community Care Program

Illinois CCP

Age 60+
General Illinois resident, at risk of nursing home placement.
Income Limits (2025) ~$1,215/month individual
Asset Limits $17,500 individual, excludes home, car
IL

High demand in urban areas; waitlists possible.

Benefits
In-home care (3-5 hours/day) Adult day services ($65/day) Emergency home response systems ($30/month)

Illinois Respite Program

IL Respite (via NFCSP)

Age Caregiver of someone 60+ (or with dementia)
General Illinois resident.
Income Limits No strict limit; prioritizes low-income.
Asset Limits Not applicable.
IL

Limited slots; urban/rural balance.

Benefits
In-home respite (4-6 hours/day) Adult day care (~$65/day) Short-term facility care (up to 5 days)

Supportive Living Program (SLP)

Illinois Medicaid Supportive Living Program

Age 65+ or 22-64 with disability
General Illinois resident, Medicaid-eligible, needs moderate assistance (not nursing home-level).
Income Limits (2025) ~$2,829/month (300% FBR, individual); QIT allowed.
Asset Limits $2,000 (individual), $3,000 (couple) (excludes home, car).
IL

~200 SLP sites statewide; room/board not covered.

Benefits
Personal care (5-7 hours/day, e.g., bathing, mobility) Meals Housekeeping Medication management Respite (~240 hours/year)

Persons Who Are Elderly Waiver

Illinois Medicaid Elderly Waiver

Age 65+
General Illinois resident, Medicaid-eligible, nursing home-level care need.
Income Limits (2025) ~$2,829/month 300% FBR, individual
Asset Limits $2,000 (individual), $3,000 (couple).
IL

Part of HealthChoice Illinois; consumer-directed options available.

Benefits
Personal care (5-7 hours/day, e.g., dressing, eating) Homemaker Adult day care (~$60/day) Respite (240 hours/year) Home mods ($1,000 avg.)

Medicare Savings Program (MSP)

Illinois Medicare Savings Program

Age 65+ or disabled
General Illinois resident, Medicare Part A/B.
Income Limits (2025) ~$2,510/month (QMB), ~$3,380/month (SLMB), ~$3,598/month (QI)—individual.
Asset Limits $9,430 (individual), $14,130 (couple).
IL

Three tiers; no waitlist.

Benefits
Covers Part B premiums ($174.70/month) Deductibles ($240/year) Copays (~20%)

Optional State Supplementation (OSS)

Illinois Optional State Supplementation

Age 65+ or disabled
General Illinois resident, in approved facility, SSI recipient or low-income.
Income Limits (2025) ~$1,004/month including SSI
Asset Limits $2,000 (individual), $3,000 (couple).
IL

~$50-$500/month based on facility type.

Benefits
Cash (~$50-$500/month) for room/board in personal care homes or SLFs

VA Aid and Attendance (A&A) and Housebound Benefits

Illinois VA Aid and Attendance/Housebound

Age 65+ or disabled veteran/spouse
General Illinois resident, wartime service, need for ADL help (A&A) or homebound.
Income Limits (2025) Net income < ~$1,984/month (veteran with dependent, A&A); pension offsets income.
Asset Limits ~$155,356 net worth limit
IL

High veteran demand in urban/rural areas.

Benefits
Cash (~$1,433-$2,642/month veteran, ~$951-$1,318 spouse) for care costs (e.g., in-home, assisted living)

Frequently Asked Questions about Elevate Care Windsor Park

What neighborhood is Elevate Care Windsor Park in?

Elevate Care Windsor Park is in the South Shore neighborhood of Chicago.

Is Elevate Care Windsor Park in a walkable area?

Elevate Care Windsor Park has a walk score of 77. Very walkable. Most errands can be accomplished on foot, and many essentials are within a short walk.

What is the occupancy rate at Elevate Care Windsor Park?

Elevate Care Windsor Park's occupancy is 79.9%.

Are there photos of Elevate Care Windsor Park?

Yes — there are 5 photos of Elevate Care Windsor Park in the photo gallery on this page.

What is the address of Elevate Care Windsor Park?

Elevate Care Windsor Park is located at 2649 E 75Th St, Chicago, IL 60649.

What is the phone number of Elevate Care Windsor Park?

(773) 734-5500 will put you in contact with the team at Elevate Care Windsor Park.

Is Elevate Care Windsor Park Medicare or Medicaid certified?

Yes — Elevate Care Windsor Park is a CMS-certified provider of Medicare and Medicaid.

Guides for Better Senior Living

Care Cost Calculator: See Prices in Your Area

Nursing Home Data Explorer

Don’t Wait Too Long: 7 Red Flag Signs Your Parent Needs Assisted Living Now

The True Cost of Assisted Living in 2025 – And How Families Are Paying For It

Understanding Senior Living Costs: Pricing Models, Discounts & Financial Assistance