Everett Center
Nursing Home · Everett, WA

Everett Center

Nursing Home · Everett, WA
Calculator: See prices in your area
Everett Center accepts Medicare, Medicaid, and private pay.

Overview of Everett Center

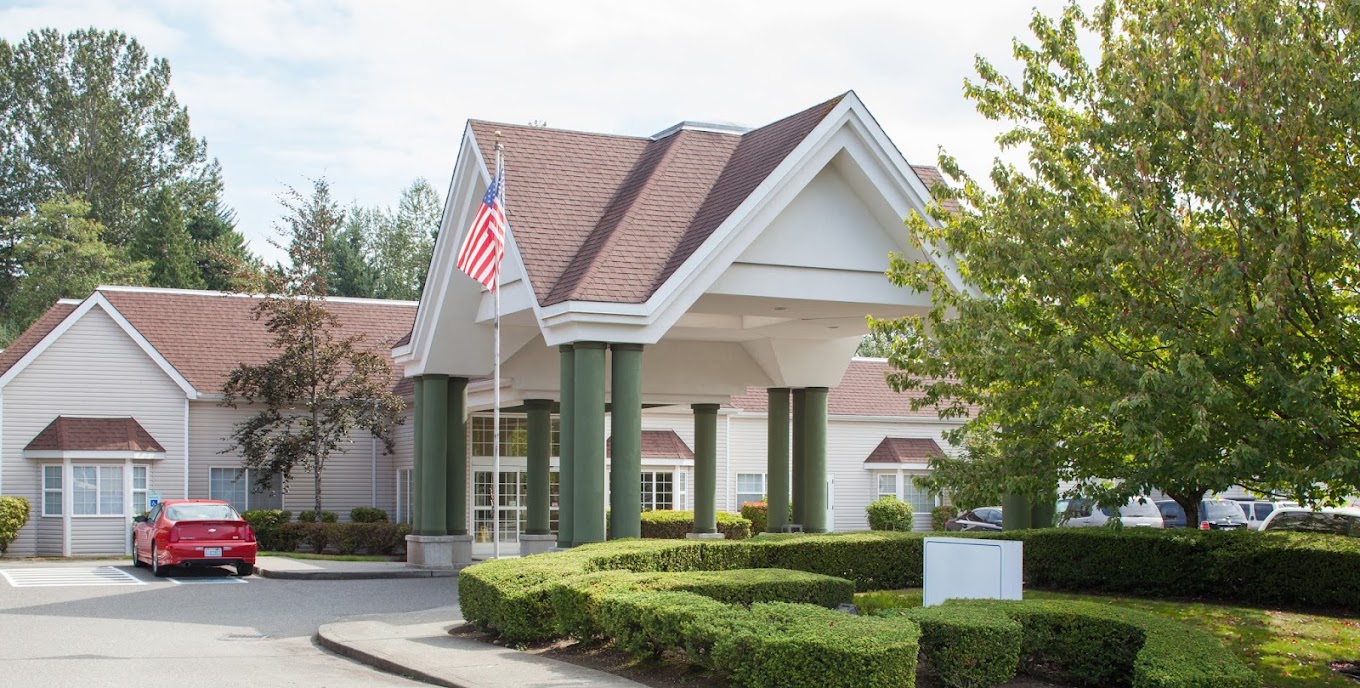
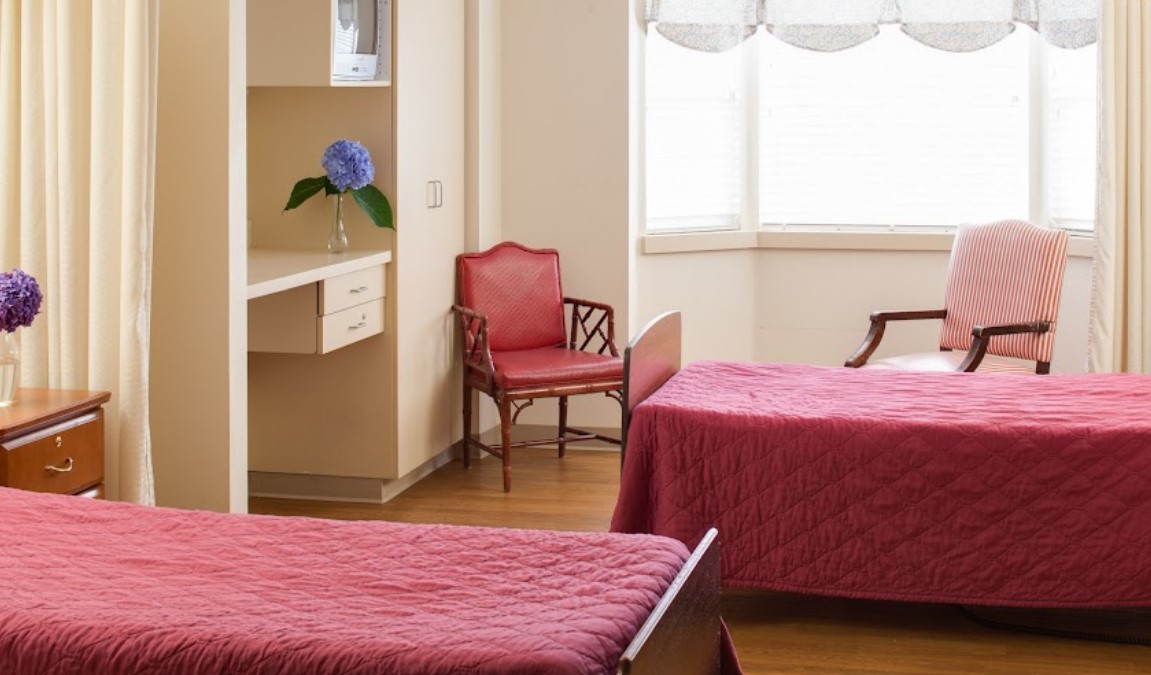
Nestled in the charming town of Everett, WA, Everett Center provides compassionate memory care and rehabilitation in a caring and supportive environment. The community is dedicated to offering high-quality, personalized care that emphasizes each resident’s well-being, dignity, and quality of life through innovative approaches. The tastefully designed private and semi-private rooms are created for comfort and convenience, catering to a variety of needs and preferences.

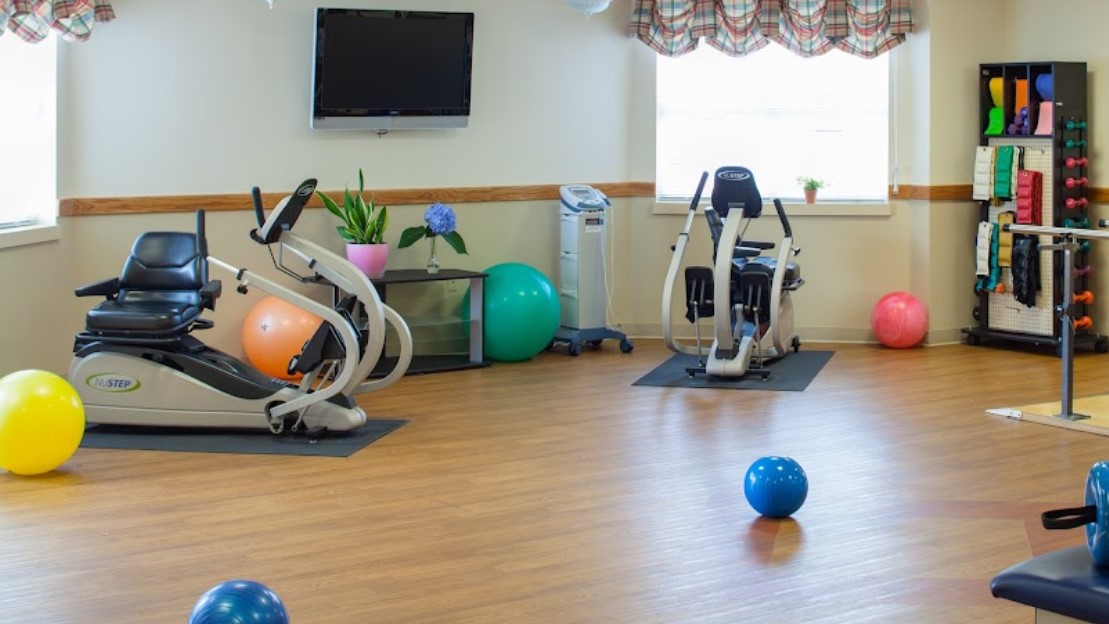
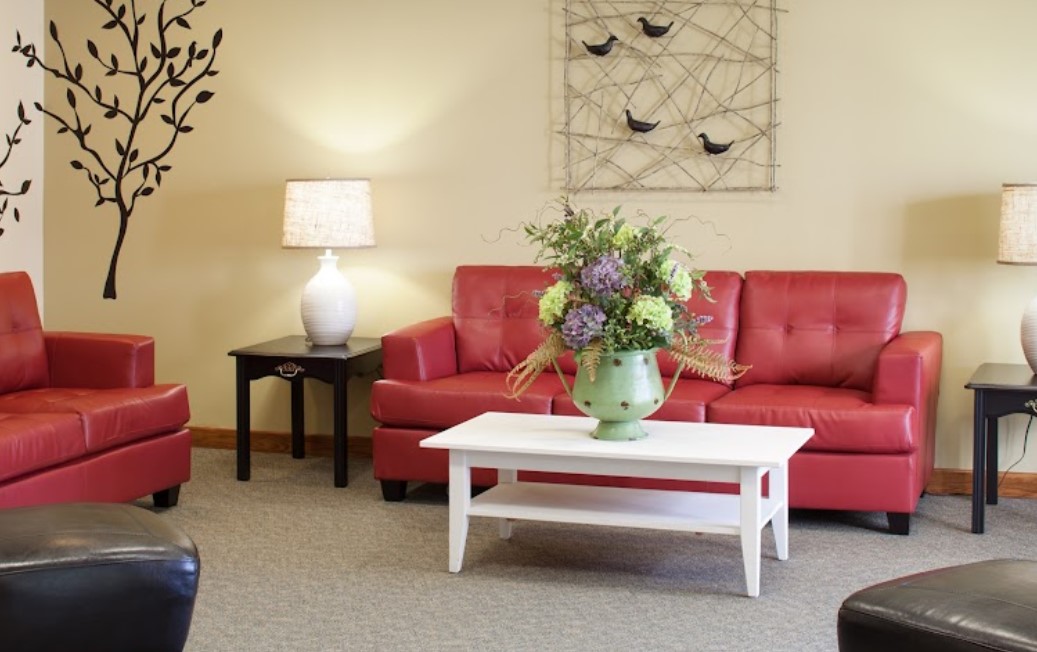
Residents can enjoy a diverse range of dining options and engaging activities that nurture the mind, body, and spirit. With services like a beauty salon and recreational programs, Everett Center is filled with warmth, energy, and enthusiasm. Here, residents can truly enjoy an empowering and secure living experience.

(425) 513-1600

Staffing hours breakdown

Info Daily nursing hours per resident by staff type, reported to CMS. Higher is generally better — compare this facility to state and national averages to see where staffing stands.

Hours per resident per day — compared to Washington state averages

Total nursing care / resident Info This home is ranked 89th out of 89 homes in Washington. Total adjusted nursing hours per resident per day, combining RN, LPN, and aide time. CMS adjusts this for case-mix so facilities can be fairly compared.
2h 33m per day
Rank #89 / 89Nurse hours — State benchmarkedThis home is ranked 89th out of 89 homes in Washington. Shows adjusted nurse hours per resident per day benchmarked to the Washington average, with a ranking across 89 Washington SNFs. More hours mean more direct care. The national average is about 3.5 hrs; below 3.0 is a red flag.Click the rank badge to see the full State ranking.Click here to see the full State ranking.
vs Washington avg

3 of 6 metrics below state avg

Standout metric Registered Nurse (RN) is +11% above state avg
Staff typeHours / Day / Residentvs state avg
Registered Nurse (RN) Info RNs hold the highest nursing license and can assess residents, interpret test results, and direct care plans. More RN hours per day often signals stronger clinical oversight and faster response to health changes. 59m per day ▲ 11% State avg: 53m per day · National avg: 41m per day
LPN / LVN Info Licensed Practical Nurses (LPNs) or Licensed Vocational Nurses (LVNs) deliver routine hands-on care — medication administration, wound dressing, and monitoring vital signs. They work under RN supervision and make up a large share of daily bedside care. 48m per day ■ Avg State avg: 49m per day · National avg: 52m per day
Nurse Aide Info Certified Nurse Aides (CNAs) provide the most direct day-to-day assistance: bathing, dressing, feeding, and mobility. Nurse aide hours are typically the largest staffing category and directly affect residents' quality of life. 2h 21m per day ▼ 12% State avg: 2h 41m per day · National avg: 2h 21m per day
Weekend Total Nursing Info Combined nursing hours (RN + LPN + Nurse Aide) per resident per day on weekends. Staffing often drops on weekends — this figure reveals whether the facility maintains adequate coverage outside of weekday hours. 3h 46m per day ■ Avg State avg: 3h 47m per day · National avg: 3h 26m per day
Physical Therapist Info Hours per resident per day provided by licensed Physical Therapists (PTs) or PT Assistants. PT services help residents recover mobility after injury or illness and are especially important for post-acute (short-stay) rehabilitation. 4m per day ▼ 20% State avg: 5m per day · National avg: 4m per day
Weekend RN Info Registered nurse hours specifically on weekends. Facilities sometimes reduce RN presence on Saturdays and Sundays — a low weekend RN figure compared to weekday hours can indicate reduced clinical oversight when most administrative staff are absent. 37m per day ▼ 3% State avg: 38m per day · National avg: 29m per day

Types of Care at Everett Center

Nursing Home

Capacity and availability

This home usually has availability

Occupancy lower than 85% suggests more openings may be available.

Lower occupancy than the Washington average: 72.5%
Occupancy rate 72.1% Rank #179 / 310Occupancy rate — State benchmarkedThis home is ranked 179th out of 310 homes in Washington. Shows this facility's occupancy rate versus the Washington average, with its Statewide rank out of 310. Higher occupancy signals strong local demand and financial stability.Click the rank badge to see the full State ranking.Click here to see the full State ranking.
Avg. Length of Stay 111 days
Occupancy rate
72.1% Rank #179 / 310Occupancy rate — State benchmarkedThis home is ranked 179th out of 310 homes in Washington. Shows this facility's occupancy rate versus the Washington average, with its Statewide rank out of 310. Higher occupancy signals strong local demand and financial stability.Click the rank badge to see the full State ranking.Click here to see the full State ranking.
Avg. Length of Stay
111 days
Walk Score
Walk Score: 51 / 100 Rank #320 / 628Walk Score — State benchmarkedThis home is ranked 320th out of 628 homes in Washington. Shows how walkable this facility's neighborhood is compared to the average Walk Score across Washington SNFs. Higher scores benefit residents, families, and staff.Click the rank badge to see the full State ranking.Click here to see the full State ranking.
Moderately walkable. Some errands can be accomplished on foot, with a mix of nearby amenities.

Contact Everett Center

Staffing Data

Reporting period: October 1 – December 31, 2025 (Q4 2025). Source: CMS Payroll-Based Journal report.

Total staff 126
Employees 120
Contractors 6
Staff to resident ratio 1.47:1
21% worse than Washington average
Washington average ratio: 1.86:1 Washington average ratio: 1.86:1See full Washington ranking
Avg staff/day 53
Average shift 7.7 hours
5% worse than Washington average
Washington average: 8.1 hours Washington average shift: 8.1 hoursSee full Washington ranking
Total staff hours (quarter) 37,779

Nursing staff breakdown

Q4 2025 · Oct 1 – Dec 31 More info This data comes from the CMS Payroll-Based Journal report covering October 1 – December 31, 2025.
Registered Nurse

Manages medical care and health needs.

RN Staff 27
Average shift length Info Average shift length. Calculated as total hours divided by days worked and average staff per day. 8.1 hours

No contractors work on this role.

Licensed Practical Nurse

Assists with medical care and medications.

LPN Staff 14
Average shift length Info Average shift length. Calculated as total hours divided by days worked and average staff per day. 8.8 hours

No contractors work on this role.

Certified Nursing Assistant

Helps with daily care and mobility.

CNA Staff 46
Average shift length Info Average shift length. Calculated as total hours divided by days worked and average staff per day. 7.7 hours

No contractors work on this role.

Contractor staffing

Q4 2025 · Oct 1 – Dec 31 More info This data comes from the CMS Payroll-Based Journal report covering October 1 – December 31, 2025.

Total hours from contractors

1.5%

566 contractor hours this quarter

Occupational Therapy Assistant: 4 Occupational Therapy Aide: 1 Medical Director: 1

Staff by category

Q4 2025 · Oct 1 – Dec 31 More info This data comes from the CMS Payroll-Based Journal report covering October 1 – December 31, 2025.
Certified Nursing Assistant4604616,90792100%7.7
Registered Nurse270276,90292100%8.1
Licensed Practical Nurse140145,24192100%8.8
Clinical Nurse Specialist3031,3176470%8
Mental Health Service Worker2029156571%7.9
Qualified Social Worker4048768188%6.4
Other Dietary Services Staff2028628491%7.7
Speech Language Pathologist3035426571%7.1
Physical Therapy Assistant3035276975%7.4
Other Social Services Staff1015016571%7.7
Administrator1014886166%8
Physical Therapy Aide3034666065%6.8
Occupational Therapy Aide0114556874%6.7
Nurse Practitioner2024405560%8
Nurse Aide in Training3034404751%7.1
Respiratory Therapy Technician3033975964%5.9
RN Director of Nursing3033934347%6.8
Occupational Therapy Assistant044641921%3.2
Medical Director011481415%3.4
46 Certified Nursing Assistant
% of Days 100%
27 Registered Nurse
% of Days 100%
14 Licensed Practical Nurse
% of Days 100%
3 Clinical Nurse Specialist
% of Days 70%
2 Mental Health Service Worker
% of Days 71%
4 Qualified Social Worker
% of Days 88%
2 Other Dietary Services Staff
% of Days 91%
3 Speech Language Pathologist
% of Days 71%
3 Physical Therapy Assistant
% of Days 75%
1 Other Social Services Staff
% of Days 71%
1 Administrator
% of Days 66%
3 Physical Therapy Aide
% of Days 65%
1 Occupational Therapy Aide
% of Days 74%
2 Nurse Practitioner
% of Days 60%
3 Nurse Aide in Training
% of Days 51%
3 Respiratory Therapy Technician
% of Days 64%
3 RN Director of Nursing
% of Days 47%
4 Occupational Therapy Assistant
% of Days 21%
1 Medical Director
% of Days 15%

Penalties and fines

Includes penalties issued in 2023

Federal penalties imposed by CMS for regulatory violations, including civil money penalties (fines) and denials of payment for new Medicare/Medicaid admissions.

Source: CMS Penalties Database (Data as of Jan 2026)

Total fines amount $378K Rank #90 / 91Federal fines — State benchmarkedThis home is ranked 90th out of 91 homes in Washington. Shows this facility's cumulative CMS federal fine dollars versus the Washington average among facilities with fines, and where it ranks among 91 skilled nursing facilities in the pool. Lower total dollars mean a better rank.Click the rank badge to see the full State ranking.Click here to see the full State ranking.
363% higher than Washington average

Washington average: $82K

Number of fines 2
8% more fines than Washington average

Washington average: 1.8

Payment Denials Info Serious action where Medicare and/or Medicaid temporarily stops payments for new residents until issues are fixed. 1
261% more payment denials than Washington average

Washington average: 0.3

Fines amount comparison
This facility $378K
Washington average $82K
Penalty History

Penalties are imposed by CMS for violations of federal nursing home regulations.

3 penalties in the past 3 years

Multiple penalties were reported in the last 3 years.

Civil Money Penalty Info Fines imposed for noncompliance, which can be assessed per day or per instance of violation. Dec 29, 2023
$148K
Civil Money Penalty Info Fines imposed for noncompliance, which can be assessed per day or per instance of violation. Sep 20, 2023
$230K
Payment Denial Info Serious action where Medicare and/or Medicaid temporarily stops payments for new residents until issues are fixed. Sep 20, 2023
35 days

Last updated: Jan 2026

Quality of care over time

These measures show how residents usually do over time at this home, based on health outcomes and preventive care.

High-risk clinical events score Info A composite score based on pressure ulcers, falls with injury, weight loss, walking ability decline, and activities of daily living decline. 12.3
22% worse than Washington average

Washington average: 10.0

Functional decline score Info A composite score based on activities of daily living decline, walking ability decline, and incontinence. 22.3
7% worse than Washington average

Washington average: 20.9

Long-stay resident measures
Need for Help with Daily Activities Increased Info Percent of long-stay residents whose need for help with daily activities has increased 17.3%
5% worse than Washington average

Washington average: 16.4%

Walking Ability Worsened Info Percent of long-stay residents whose ability to move independently worsened 31.4%
44% worse than Washington average

Washington average: 21.8%

Low Risk Residents with Bowel/Bladder Incontinence Info Percent of low risk long-stay residents who lose control of their bowels or bladder 18.1%
25% better than Washington average

Washington average: 24.3%

Falls with Major Injury Info Percent of long-stay residents experiencing one or more falls with major injury 0.4%
86% better than Washington average

Washington average: 2.6%

High Risk Residents with Pressure Ulcers Info Percent of long-stay high risk residents with pressure ulcers 8.7%
76% worse than Washington average

Washington average: 4.9%

Urinary Tract Infection Info Percent of long-stay residents with a urinary tract infection 0.0%
100% better than Washington average

Washington average: 1.7%

Lost Too Much Weight Info Percent of long-stay residents who lose too much weight 3.7%
36% better than Washington average

Washington average: 5.8%

Depressive Symptoms Info Percent of long-stay residents who have depressive symptoms 0.0%
100% better than Washington average

Washington average: 16.2%

Antipsychotic Use Info Percent of long-stay residents who received an antipsychotic medication 5.8%
60% better than Washington average

Washington average: 14.5%

Pneumococcal Vaccine Info Percent of long-stay residents assessed and appropriately given the pneumococcal vaccine 79.9%
17% worse than Washington average

Washington average: 96.2%

Influenza Vaccine Info Percent of long-stay residents assessed and appropriately given the seasonal influenza vaccine 91.7%
In line with Washington average

Washington average: 93.8%

Hospitalizations per 1,000 days Info Number of hospitalizations per 1,000 long-stay resident days. 2.44
77% worse than Washington average

Washington average: 1.38

ED visits per 1,000 days Info Number of outpatient emergency department visits per 1,000 long-stay resident days. 2.60
72% worse than Washington average

Washington average: 1.51

Short-stay resident measures
Pneumococcal Vaccine Info Percent of short-stay residents assessed and appropriately given the pneumococcal vaccine 83.4%
5% worse than Washington average

Washington average: 88.1%

Antipsychotic medication increase Info Percent of short-stay residents who newly received an antipsychotic medication 2.3%
62% worse than Washington average

Washington average: 1.4%

Influenza Vaccine Info Percent of short-stay residents assessed and appropriately given the seasonal influenza vaccine 76.4%
7% worse than Washington average

Washington average: 82.0%

Falls with major injury Info Percentage of SNF residents who experience falls with major injury during their stay. 0.0%
100% better than Washington average

Washington average: 0.8%

Successful return to home or community Info Rate of successful return to home or community from a skilled nursing facility. 68.3%
35% better than Washington average

Washington average: 50.6%

Breakdown by payment type

Medicare

18% of new residents, usually for short-term rehab.

Typical stay 1 - 2 months

Private pay

43% of new residents, often for short stays.

Typical stay 1 - 2 months

Medicaid

39% of new residents, often for long-term daily care.

Typical stay 7 - 8 months

Facility Characteristics

Source: CMS Long-Term Care Facility Characteristics (Data as of Jan 2026)

Total residents 86
Medicare
4
4.7% of residents
Medicaid
64
74.4% of residents
Private pay or other
18
20.9% of residents
Programs & Services
Residents Group

Residents meet regularly to discuss policies, care quality, and activities

Active Resident Council

Organized group of residents that meets regularly to discuss facility policies, quality of life, and activities.

Finances and operations

Privately-owned community
Home revenue
$22.7M
Operating loss
-$585.1K
Privately-owned community
Home revenue
$22.7M Rank #20 / 93Revenue — State benchmarkedThis home is ranked 20th out of 93 homes in Washington. Shows this facility's annual revenue compared to the Washington SNF average. Higher revenue generally means more resources for staffing and capital — read alongside Payroll %.Click the rank badge to see the full State ranking.Click here to see the full State ranking.
Operating loss
-$585.1K
Payroll costs Info The portion of the home's budget spent on staff, including nurses, caregivers, and other employees who support care and operations. Rank #40 / 93Payroll — State benchmarkedThis home is ranked 40th out of 93 homes in Washington. Shows total annual staff payroll benchmarked to the Washington average. Higher payroll investment relative to peers often signals better staffing and less reliance on cheaper contract labor.Click the rank badge to see the full State ranking.Click here to see the full State ranking.
$7.1M
31.4% of revenue Rank #84 / 93Payroll % — State benchmarkedThis home is ranked 84th out of 93 homes in Washington. Shows payroll as a percentage of revenue versus the Washington average. Well-run Washington SNFs typically land around 53–61% — the top third Statewide. Below 25% may signal understaffing or heavy agency use — read with Staffing ratings.Click the rank badge to see the full State ranking.Click here to see the full State ranking.
Other operating costs Info All remaining costs needed to run the home, such as food, utilities, building maintenance, supplies and administrative expenses.
$16.2M
Total costs $23.3M

What does this home offer?

Total residents icon

Total Residents: 100 Residents

Housing options icon

Housing Options: Private / Semi-Private Rooms

Building type icon
Building type icon

Building Type: Single-story

Fitness and recreation icon

Fitness and Recreation

Who this home usually serves

TYPE OF STAY

Mix of rehab and long-term care

This home supports both short-term rehab and long-term care, with residents staying for a wide range of durations.

Places of interest near Everett Center

Address 7.5 miles from city center Info Estimated distance in miles from Everett's city center to Everett Center's address, calculated via Google Maps.

Calculate Travel Distance to Everett Center

Add your location

Address

Financial Assistance for
Nursing Home in Washington

Everett Center is located in Everett, Washington.
Here are the financial assistance programs available to residents in Washington.

Get Financial aid guidance

Community Options Program Entry System (COPES)

WA Medicaid COPES

Age 65+ or disabled
General Washington resident, Medicaid-eligible, nursing home-level care need.
Income Limits (2025) ~$2,829/month 300% FBR, individual
Asset Limits $2,000 (individual), $3,000 (couple).
WA

High demand in urban areas (e.g., Seattle).

Benefits
Personal care (5-7 hours/day) Respite (240 hours/year) Adult day care ($70/day) Home modifications ($1,500 avg.)

Washington Family Caregiver Support Program

WA NFCSP

Age Caregiver of someone 60+ (or with dementia)
General Washington resident.
Income Limits No strict limit; prioritizes low-income.
Asset Limits Not applicable.
WA

High urban demand; rural outreach.

Benefits
In-home respite (4-6 hours/day) Adult day care (~$70/day) Short-term facility care (up to 5 days)

Community First Choice (CFC)

Washington Community First Choice

Age 65+ (or disabled 18+)
General WA resident, Medicaid-eligible, need help with 2+ ADLs/IADLs.
Income Limits (2025) ~$2,829/month; QIT optional.
Asset Limits $2,000 (individual), $3,000 (couple).
WA

Broader than COPES; serves ~20,000; self-directed option.

Benefits
Personal care (4-6 hours/day) Respite (~240 hours/year) Assistive devices Training Transportation

Older Americans Act (OAA) Services

Washington OAA Services

Age 60+
General WA resident; no income/asset limits.
Income Limits (2025) None; donations encouraged.
Asset Limits Not assessed.
WA

13 AAAs; includes Meals on Wheels; rural focus.

Benefits
Meals (~$5-$7/meal) Transportation Homemaker services (~4 hours/week) Respite (~5 days/year) Legal aid

Medicare Savings Program (MSP)

Washington Medicare Savings Program

Age 65+ or disabled
General WA resident, Medicare Part A/B.
Income Limits (2025) ~$2,510/month (QMB), ~$3,380/month (SLMB), ~$3,598/month (QI)—individual.
Asset Limits $9,430 (individual), $14,130 (couple).
WA

Includes Extra Help for Part D; no waitlist.

Benefits
Covers Part B premiums ($174.70/month) Deductibles ($240/year) Copays (~20%)

VA Aid and Attendance (A&A) and Housebound Benefits

Washington VA Aid and Attendance/Housebound

Age 65+ or disabled veteran/spouse
General WA resident, wartime service, ADL help (A&A) or homebound.
Income Limits (2025) Net income < ~$1,984/month (veteran with dependent, A&A); pension offsets income.
Asset Limits ~$155,356 net worth
WA

High veteran use; supports rural/urban needs.

Benefits
Cash (~$1,433-$2,642/month veteran, ~$951-$1,318 spouse) for care costs

Senior Citizens Property Tax Exemption

Washington Senior Property Tax Exemption

Age 61+ or disabled retiree
General WA resident, homeowner, income-based.
Income Limits (2025) ~$45,000-$70,000/year varies by county, e.g., King: $70,000
Asset Limits Not assessed; home value cap varies ~$250,000-$400,000
WA

Saves ~$500-$1,500/year; offered statewide.

Benefits
Tax exemption (~$500-$1,500/year depending on county)

Senior Farmers’ Market Nutrition Program (SFMNP)

Washington SFMNP

Age 60+
General WA resident, low-income.
Income Limits (2025) ~$2,322/month 185% FPL
Asset Limits Not assessed.
WA

Vouchers (~$80/season); serves ~20,000 via AAAs.

Benefits
Vouchers (~$80/season) for produce at farmers’ markets

Compare Nursing Home around Everett

The information below is reported by the Washington Department of Social and Health Services, Residential Care Services.

3 facilities compared · CMS & WA Dept. of Health data

Filter by care type
Brookdale Silver Lake
NH

Nursing Home Licensed facility providing 24/7 skilled nursing care for residents with complex, ongoing medical needs. Staffed by RNs, LPNs, and CNAs. Inspected and star-rated annually by CMS. Accepts Medicare (short-term rehab) and Medicaid (long-term care).

MC

Memory Care Secured, specialized care for people living with Alzheimer's or dementia. Staff trained in cognitive impairment, with higher staff-to-resident ratios and an environment designed to reduce confusion and wandering risk.

Everett (Silver Lake)60 81.7% +13%3.24 +17%-23%$130.8k5511.0549 54 Bethany Of The Northwest$23.0M$10.2M44.1%505403
MorningStar Senior Living at Silver Lake
NH

Nursing Home Licensed facility providing 24/7 skilled nursing care for residents with complex, ongoing medical needs. Staffed by RNs, LPNs, and CNAs. Inspected and star-rated annually by CMS. Accepts Medicare (short-term rehab) and Medicaid (long-term care).

AL

Assisted Living A licensed, long-term care setting for seniors or individuals with disabilities who need help with daily activities — like bathing, dressing, and medication management — but not 24-hour skilled nursing. Offers housing, meals, and around-the-clock support while aiming to maximize resident independence.

IL

Independent Living Lifestyle-focused communities for older adults offering dining, activities, and transportation with minimal personal care. Best for active, independent seniors who want community without medical support.

Everett (Twin Creeks)80 90.8% +25%3.92 +1%-7%$0496.1-60 42 Tonya Fisher$13.0M$6.8M52.7%505434
Everett Center -
NH

Nursing Home Licensed facility providing 24/7 skilled nursing care for residents with complex, ongoing medical needs. Staffed by RNs, LPNs, and CNAs. Inspected and star-rated annually by CMS. Accepts Medicare (short-term rehab) and Medicaid (long-term care).

AL

Assisted Living A licensed, long-term care setting for seniors or individuals with disabilities who need help with daily activities — like bathing, dressing, and medication management — but not 24-hour skilled nursing. Offers housing, meals, and around-the-clock support while aiming to maximize resident independence.

IL

Independent Living Lifestyle-focused communities for older adults offering dining, activities, and transportation with minimal personal care. Best for active, independent seniors who want community without medical support.

MC

Memory Care Secured, specialized care for people living with Alzheimer's or dementia. Staff trained in cognitive impairment, with higher staff-to-resident ratios and an environment designed to reduce confusion and wandering risk.

Everett (Holly)100 72.1% -1%2.55---+49%-40%$378.3k454.5283 51 Gen Management LLC$22.7M$7.1M31.4%505491

Frequently Asked Questions about Everett Center

What neighborhood is Everett Center in?

Everett Center is in the Holly neighborhood.

Is Everett Center in a walkable area?

Everett Center has a walk score of 51. Moderately walkable. Some errands can be accomplished on foot, with a mix of nearby amenities.

What is the occupancy rate at Everett Center?

Everett Center's occupancy is 72.1%.

What is the address of Everett Center?

Everett Center is located at 1919 112th St SW, Everett, WA 98204, United States.

What is the phone number of Everett Center?

(425) 513-1600 will put you in contact with the team at Everett Center.

Is Everett Center Medicare or Medicaid certified?

Yes — Everett Center is a CMS-certified provider of Medicare and Medicaid.

Guides for Better Senior Living

Care Cost Calculator: See Prices in Your Area

Nursing Home Data Explorer

Don’t Wait Too Long: 7 Red Flag Signs Your Parent Needs Assisted Living Now

The True Cost of Assisted Living in 2025 – And How Families Are Paying For It

Understanding Senior Living Costs: Pricing Models, Discounts & Financial Assistance

Explore Open Rooms
1 Contact details
2 What type of senior care service are you looking for?
3 What budget do you have in mind for senior care?
4 How soon do you need to find care?
5 Additional details

Thank you for your interest!

Our team will be in touch shortly to help with next steps.